 English
 پارسی


Technical Analysis
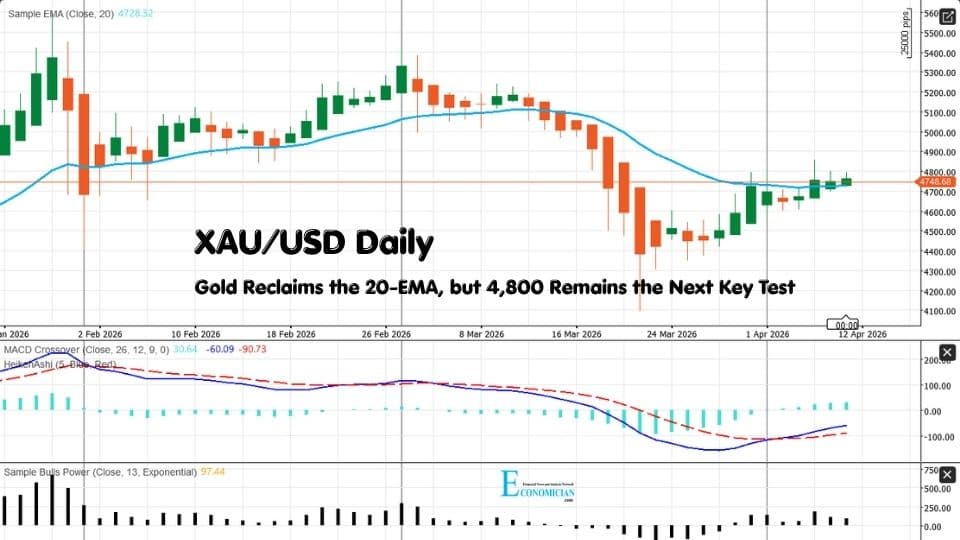
The daily chart of XAU/USD shows that gold is attempting to rebuild upward momentum after the sharp late-March selloff. Price is trading around 4,748.68, slightly above the 20-day EMA at 4,728.32, which is an early sign that short-term control is shifting back toward buyers. The recent candle structure also shows a sequence of higher lows from the late-March base, suggesting that the rebound is becoming more organized.
Momentum indicators have improved. The MACD histogram is back in positive territory, while the MACD line has crossed above the signal line, indicating that bearish momentum has faded and short-term upside momentum is recovering. At the same time, Bulls Power has turned positive at 97.44, which supports the case that buying pressure is returning after the correction phase.
Even so, the recovery is not yet a full bullish breakout. The 4,780-4,800 area remains an important near-term resistance zone, and the chart still needs a stronger push above that region to confirm a broader continuation higher. On the downside, the 20-day EMA near 4,728 is the first support, followed by the 4,680-4,700 area. As long as the price remains above the EMA and continues to print higher lows, the near-term bias stays cautiously constructive.
Fundamental Note
The latest market backdrop remains broadly supportive for gold, though not without crosscurrents. Reuters reported that spot gold was holding near $4,761.79 on April 10 and was up nearly 2% for the week, helped by a weaker U.S. dollar after the U.S.-Iran truce. Reuters also noted that the ceasefire remains fragile, the Strait of Hormuz is still not fully normalized, and parallel tensions in Lebanon continue to keep geopolitical uncertainty in the market.
At the same time, the inflation backdrop remains firm. Reuters reported that U.S. CPI rose 0.9% month-on-month in March and 3.3% year-on-year, the biggest monthly increase since mid-2022, while New York Fed President John Williams said the Middle East energy shock is likely to push headline inflation higher this year and could lift it above 3% in the near term. That mix matters for gold: a weaker dollar and lingering geopolitical risk are supportive, but sticky inflation can restrain the pace of Fed easing, which may limit upside acceleration.
Trading Signal
Signal: Buy on pullbacks while above the 20-day EMA
Entry: 4,745
Stop Loss: 4,685
Take Profit 1: 4,800
Take Profit 2: 4,885
This setup is based on price reclaiming the 20-day EMA, a positive MACD crossover, and improving Bull's Power. A daily close back below 4,728 would weaken the bullish setup and increase the risk of another test of the 4,680-4,700 support zone.
Comments