 English
 پارسی


Market Condition: Buy / Mildly Bullish
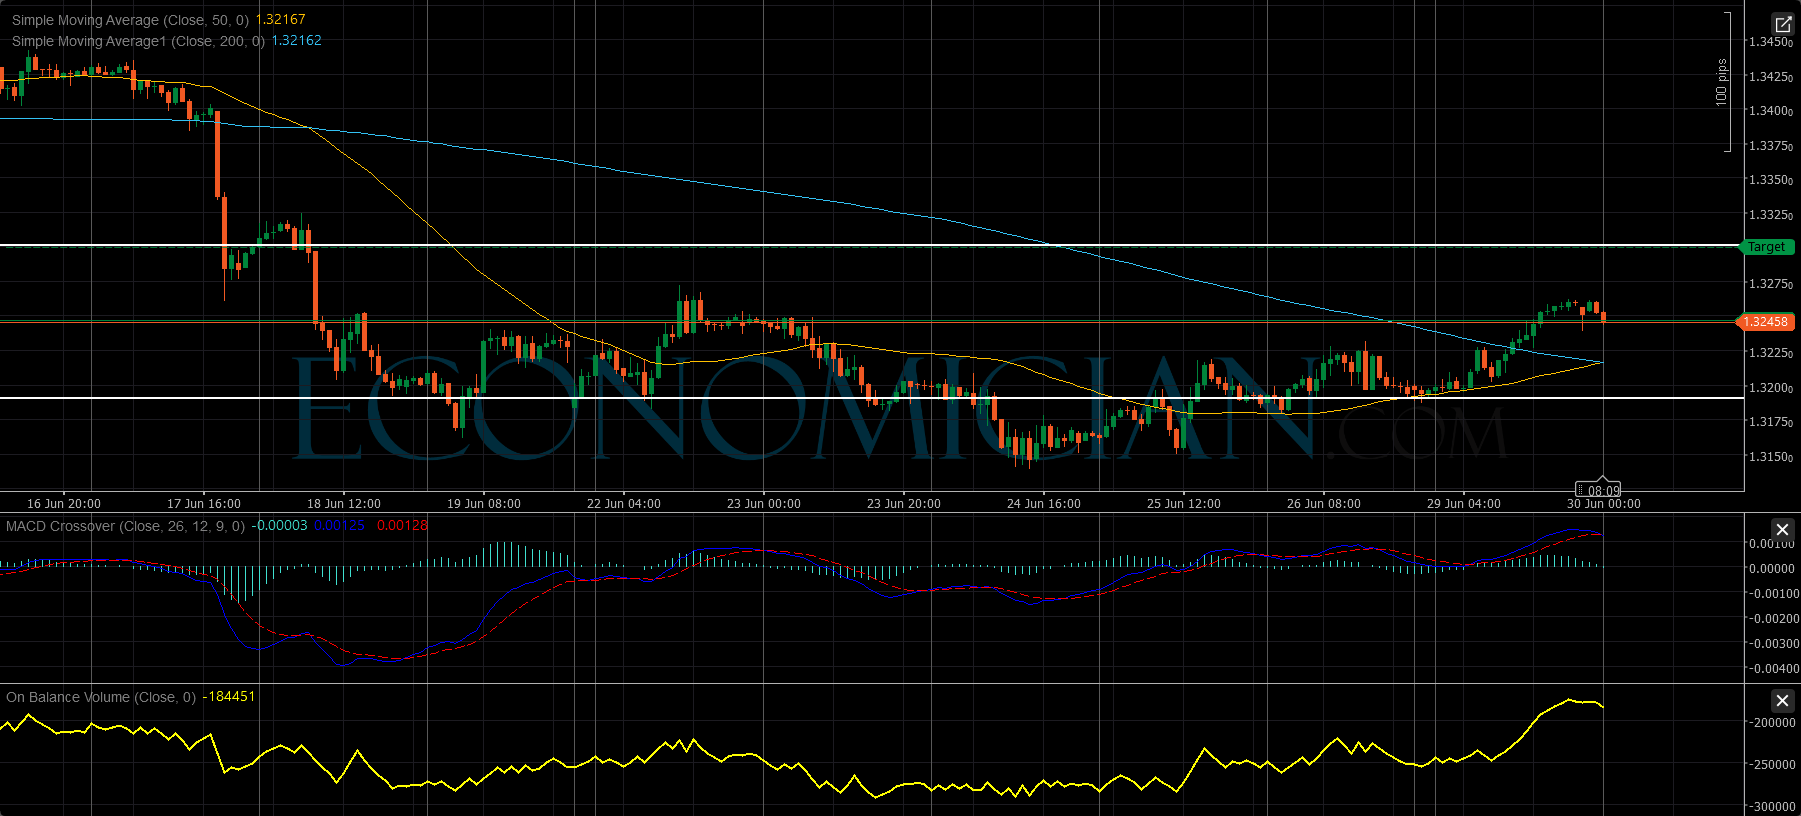
The provided GBP/USD H1 chart has improved technically. Price is trading around 1.32458, above both the 50-period SMA at 1.32167 and the 200-period SMA at 1.32162. That shift matters because the pair is no longer trading under its short-term trend base; instead, it has pushed back above both moving averages and is trying to hold that recovery.
From a price-structure perspective, the first support sits in the 1.3215–1.3220 zone, which is where the two moving averages are clustered. As long as price remains above that base, the intraday bias stays constructive. The first resistance is the current 1.3245–1.3250 area, and if that zone gives way, the chart opens room toward 1.3275 and then the marked target area near 1.3290. On the downside, a break back below 1.3215 would weaken the recovery and expose 1.3195 next.
The indicator structure is supportive, but not aggressively bullish. MACD is slightly positive, with the MACD line still above the signal line, although momentum has started to flatten. On-Balance Volume has improved sharply, showing stronger buying participation during the rebound, even if the latest bars suggest some cooling. In practical terms, this is a bullish intraday chart, but one that still needs a clean break above 1.3250 for stronger follow-through.
Fundamental Note:
The latest macro backdrop for sterling is mixed. Reuters reported on June 29 that the pound edged higher after Andy Burnham said he would stick to fiscal rules, giving markets some reassurance, even though sterling was still down 1.7% for the month and speculative short positions had risen to $8.72 billion, the highest since 2015. Reuters also said sterling was up about 0.42% on the day as the dollar eased slightly from elevated levels.
At the same time, the dollar remains broadly supported by U.S. rate expectations. Reuters reported that the dollar was still near a 13-month high, with markets pricing about a 64% chance of a Fed rate hike by September, while Reuters had earlier noted that sterling fell to around $1.3212 after the Bank of England kept rates unchanged and struck a measured tone on inflation. That combination fits the chart well: GBP/USD is rebounding, but the broader macro environment is not yet decisively sterling-positive.
Possible Market Effect:
If GBP/USD holds above 1.3215 and breaks 1.3250, the rebound could extend toward 1.3275 and 1.3290. If the pair falls back below the moving-average cluster, the move would look more like a temporary squeeze than the start of a stronger upside leg.
Trading Signal:
Signal: Buy on intraday stability
Entry: 1.3248
Stop Loss: 1.3210
Take Profit 1: 1.3275
Take Profit 2: 1.3290
This setup favors a controlled bullish trade because price is above both the 50-period and 200-period moving averages, MACD remains positive, and OBV has improved materially. A move back below 1.3210 would invalidate the immediate bullish setup.
Comments