 English
 پارسی


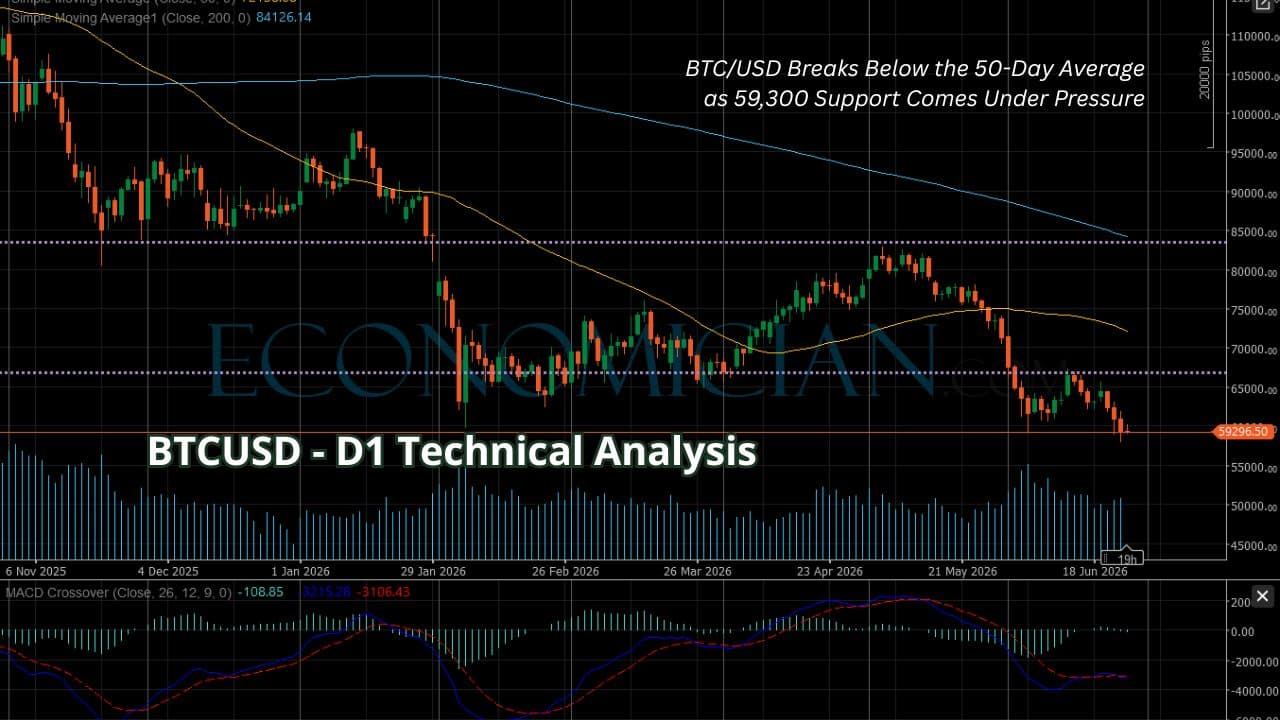
Market Condition: Sell / Bearish
BTC/USD daily chart remains technically weak. Price is trading near 59,271.50, well below the 50-day simple moving average at 72,138.18 and far below the 200-day simple moving average at 84,126.01. That gap confirms that the medium-term trend is still negative and that the recent market structure remains dominated by sellers.
From a price-action perspective, Bitcoin is pressing an important support zone around 59,000–60,000. A confirmed daily break below this area would expose the next downside level near 55,000, followed by a broader bearish extension toward 50,000. On the upside, the first recovery barrier comes in near 65,000–68,000, while the more important resistance sits around the 50-day SMA near 72,100. The 200-day SMA near 84,100 remains the major longer-term trend barrier.
The momentum backdrop is also negative. The MACD remains below zero, and both the MACD line and signal line are still in bearish territory, even if downside momentum has started to flatten slightly. In practical terms, this is not yet a reversal chart. It is still a bearish daily structure with only a limited risk of short-covering rebounds.
Fundamental Note
The broader crypto backdrop has stayed fragile. Reuters reported on June 5 that Bitcoin was suffering its worst start to a year in more than a decade, down roughly 33% in 2026, with more than $3.1 billion of outflows from Bitcoin ETFs as investors shifted toward AI-linked equities and large IPO stories. Reuters also noted that the slump had been aggravated by selling from the major corporate holder Strategy.
The macro environment has also remained unfriendly for high-beta assets. Reuters reported on June 17 that the Federal Reserve kept rates in the 3.50%–3.75% range, while policymakers’ projections still pointed to a rate hike in 2026. Reuters then reported on June 25 that New York Fed President John Williams said inflation remained too high and policy was still well positioned to bring it down, reinforcing the higher-for-longer rate narrative.
There is still a longer-term bullish narrative in the market, but it has not yet changed the short-term tone. Reuters reported on June 4 that Standard Chartered maintained its $100,000 year-end 2026 Bitcoin call despite the sharp drawdown, showing that strategic bulls remain in place even as near-term sentiment stays weak.
Possible Market Effect
If BTC/USD closes decisively below 59,000, the move could reinforce risk aversion across crypto and pressure altcoins further. If Bitcoin reclaims 68,000 and then moves back above the 50-day average, the immediate bearish pressure would begin to ease.
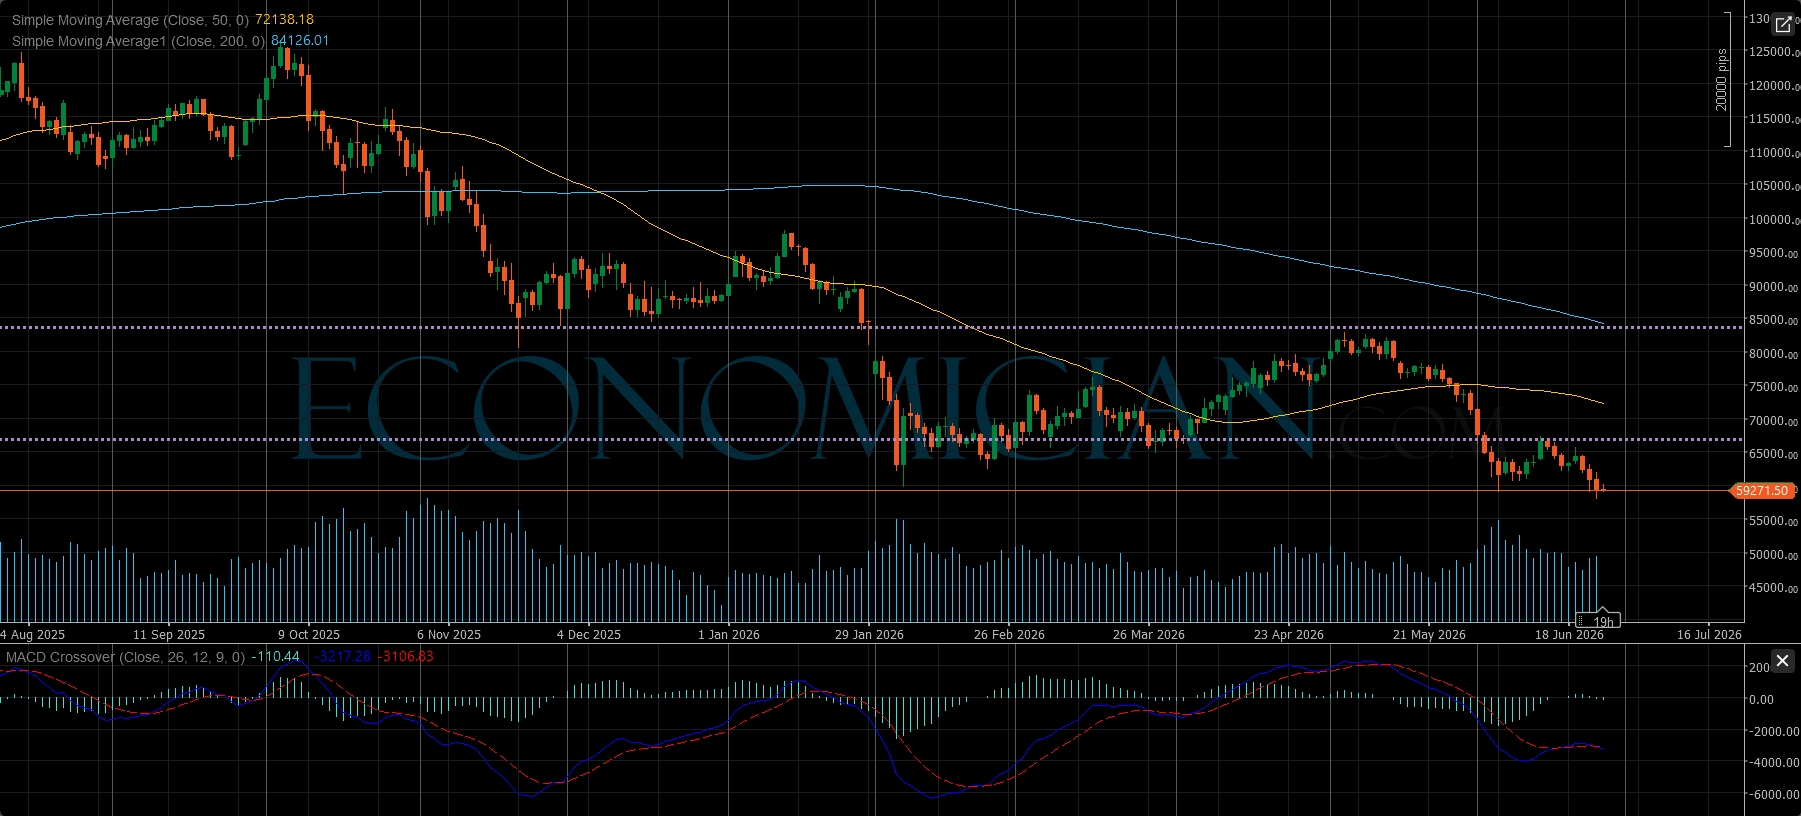
Trading Signal
Signal: Sell on confirmed weakness
Entry: 58,900
Stop Loss: 62,500
Take Profit 1: 55,000
Take Profit 2: 50,000
This setup favors a controlled bearish trade because the price remains below both the 50-day and 200-day moving averages, while MACD is still negative. A daily close back above 62,500 would weaken the bearish setup, while a stronger trend change would require recovery above the 72,100 area.
Comments