 English
 پارسی


Market Condition: Buy / Mildly Bullish
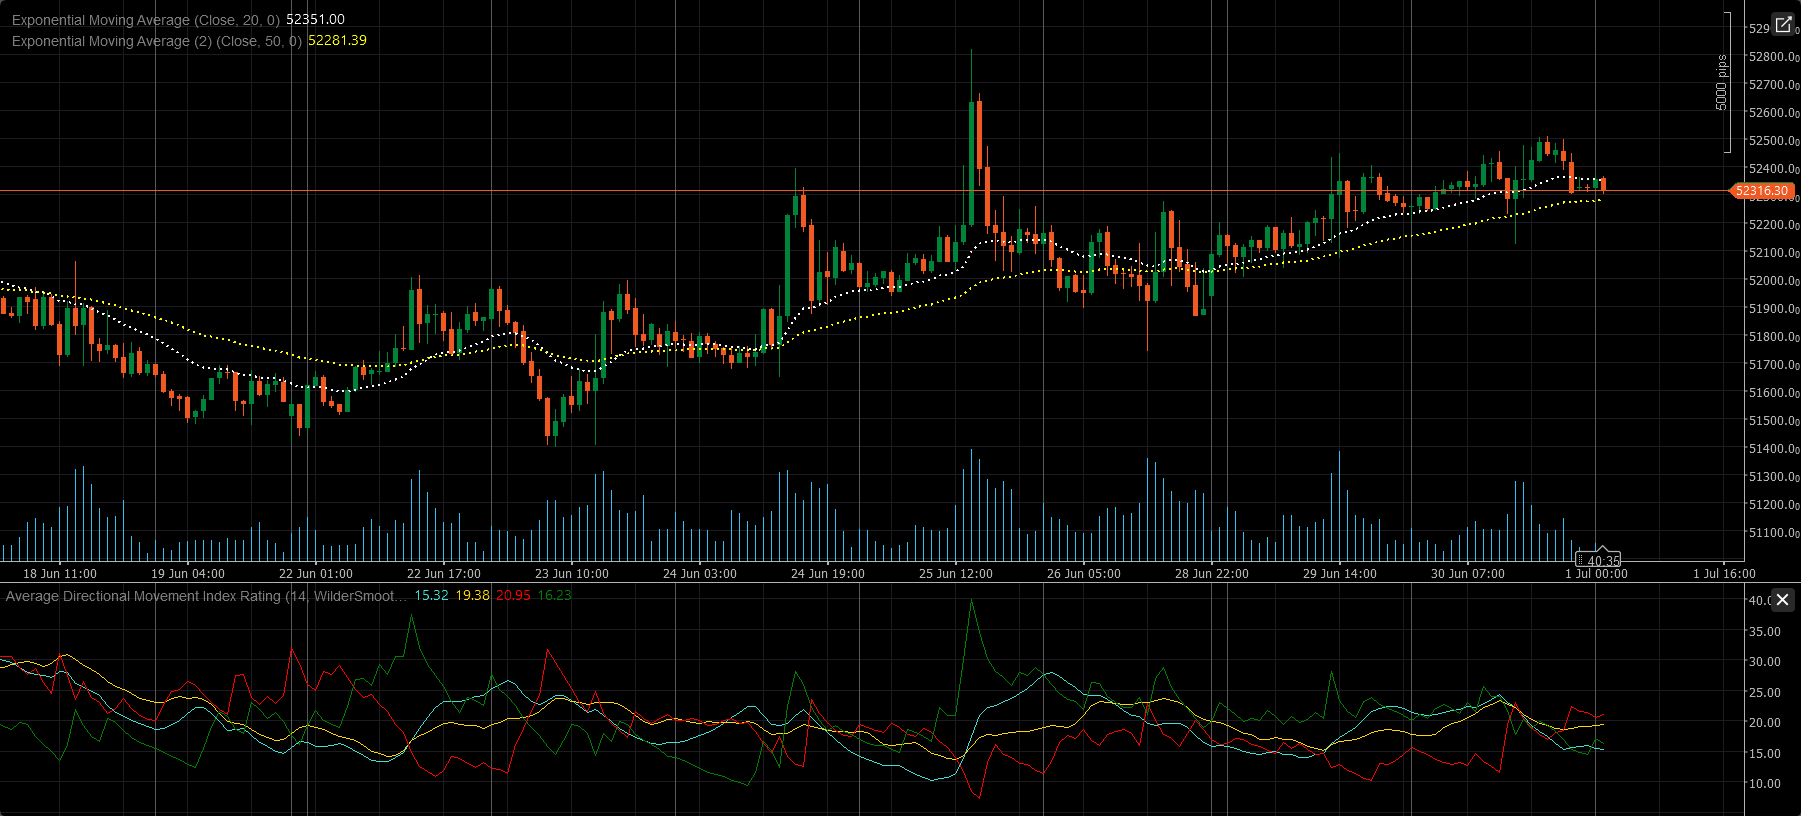
US30 H1 chart shows a market that is still constructive, even though short-term momentum has cooled. Price is trading around 52,316.30, slightly below the 20-period EMA at 52,351.00, but still above the 50-period EMA at 52,281.39. That keeps the broader hourly structure mildly bullish, while the latest candles point to consolidation rather than outright trend reversal.
From a price-structure perspective, the first support sits in the 52,280–52,300 zone, where the 50-period EMA is acting as the main short-term base. As long as price remains above that area, buyers still have room to reassert control. On the upside, the first recovery barrier is 52,350, followed by 52,480–52,500. A clean push above that zone would reopen the path toward 52,620. On the downside, a break below 52,280 would weaken the bullish structure and expose 52,150 next.
The indicator picture is supportive, but not aggressive. The 20-period EMA is still above the 50-period EMA, which confirms that the recent rally has not yet been fully invalidated. At the same time, the ADX reading is relatively soft, which suggests the market is in a weaker trend phase rather than a strong breakout phase. In practical terms, this is a bullish-leaning chart, but one that needs fresh upside follow-through above 52,350.
Fundamental Note
The broader Wall Street backdrop remains supportive for the Dow. Dow Jones closed at a record high for a second straight session on June 30, while the Dow posted a 13% quarterly gain, its biggest quarterly rise since 2022, as investors stayed positive on economic and earnings growth. Reuters also noted that the quarter ended with strong support from AI-linked optimism and easing Middle East tensions.
At the same time, the near-term risk calendar is important. Investors were focused on the coming U.S. labor-market data because stronger jobs numbers could raise the odds of a near-term Fed rate hike and add volatility to stocks. Reuters also reported that May job openings rose to 7.594 million, a two-year high, reinforcing the view that the labor market remains resilient even if hiring is softer.
That leaves the Dow in a constructive but sensitive position: the index is benefiting from record-high momentum and strong quarter-end performance, but fresh upside could become more selective if rate-hike expectations firm again.
Possible Market Effect
If US30 holds above 52,280 and reclaims 52,350, the market could extend toward 52,500 and 52,620. If price drops back below the 50-period EMA, the chart would likely shift from consolidation into a deeper hourly pullback.
Trading Signal
Signal: Buy on confirmed recovery
Entry: 52,360
Stop Loss: 52,240
Take Profit 1: 52,480
Take Profit 2: 52,620
This setup favors a controlled bullish trade because price is still above the 50-period EMA, the broader hourly structure remains constructive, and the Dow’s macro backdrop is still supported by recent record highs and strong quarter-end momentum. A break below 52,240 would invalidate the immediate bullish setup.
Comments