 English
 پارسی


CFTC COT Report July 2026: Euro Turns Bearish as Nasdaq and Grains Attract Buyers
The latest CFTC Commitments of Traders report reveals a significant rotation in speculative positioning across currencies, equity indices, metals, energy markets, and agricultural commodities.
The most important changes were a shift from net-long to net-short exposure in the euro, aggressive liquidation of crude-oil longs, substantial short covering in the Japanese yen, and a bullish positioning reversal in the Nasdaq 100.
Agricultural commodities attracted the strongest speculative demand. Net-long positions in both corn and soybeans increased by more than 36,000 contracts, making grains the clearest bullish theme in the latest report.
The overall picture is not one of broad risk appetite. Instead, speculative traders appear to be concentrating exposure in selected technology and agricultural markets while remaining cautious toward broader equities, European currencies, oil, and several commodity-linked currencies.
Important: CFTC positioning data is lagged and reflects positions held on the report’s reference date. Trading levels should therefore be confirmed against live prices before execution.
What Is the CFTC Commitments of Traders Report?
The Commitments of Traders, or COT, report is published weekly by the U.S. Commodity Futures Trading Commission.
It shows how different groups of futures-market participants are positioned. The speculative net-position figures used in this analysis represent the difference between speculative long and short contracts.
- A positive figure indicates a net-long position.
- A negative figure indicates a net-short position.
- An increase in a positive position normally signals additional buying.
- A more negative position normally indicates increased bearish exposure.
- A movement toward zero can represent position reduction or short covering.
COT data is particularly useful for identifying medium-term positioning trends, crowded trades, potential short squeezes, and divergences between price action and speculative exposure.
Key Findings From the Latest CFTC Report
The report produced five major cross-asset signals:
- The euro flipped from net long to net short, creating the clearest bearish shift among major currencies.
- Japanese yen shorts were reduced by 31.3K contracts, the largest positive weekly adjustment in the currency market.
- The Nasdaq 100 moved from net short to net long, while S&P 500 shorts increased.
- Crude-oil net longs fell by 34.8K contracts, showing a major loss of speculative confidence.
- Corn and soybean net longs increased by 36.8K and 36.2K contracts, respectively.
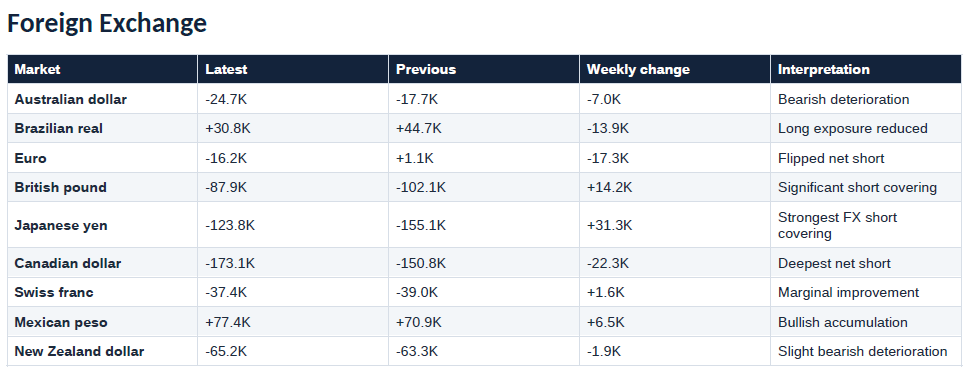
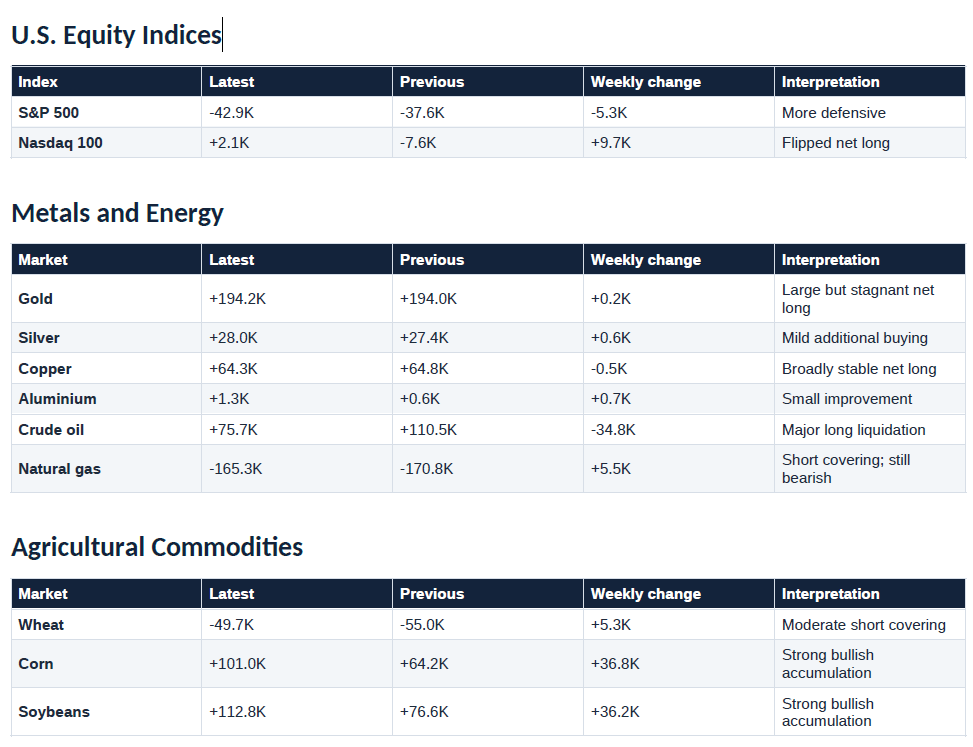
Complete CFTC Positioning Comparison
CFTC Forex Positioning Analysis
Euro Positioning Turns Decisively Bearish
The euro recorded the most important directional change among the major currencies.
Speculative positioning fell from +1.1K net long to -16.2K net short, representing a bearish weekly adjustment of 17.3K contracts.
This was not merely a reduction in bullish exposure. Speculators crossed from positive into negative territory, indicating that bearish euro positions now exceed bullish positions.
The shift suggests that traders are becoming more concerned about factors such as:
- Relative European and U.S. monetary-policy expectations
- Eurozone growth risks
- Interest-rate differentials
- Renewed demand for the U.S. dollar
- Political or fiscal uncertainty within Europe
Euro Market Outlook
The positioning change supports a bearish bias for EUR/USD. It may create an even stronger relative-value opportunity against currencies where shorts are being reduced, particularly the Japanese yen and British pound.
Positioning signal: Bearish
Preferred expression: Short EUR/JPY or EUR/USD
Japanese Yen Records the Strongest Short Covering
Japanese yen positioning improved by 31.3K contracts, moving from -155.1K to -123.8K.
This was the largest positive weekly change among the currencies included in the report.
However, the yen remains heavily net short. The data therefore indicates short covering, not yet a confirmed transition into a structurally bullish speculative position.
Short covering can still produce a powerful price reaction because traders who previously sold the yen may be forced to buy it back when market conditions change.
Potential catalysts for further yen recovery include:
- Rising Japanese inflation
- More restrictive Bank of Japan expectations
- Falling U.S. Treasury yields
- Risk-aversion flows
- Japanese government intervention concerns
Yen Market Outlook
The yen’s positioning trend is improving, but the remaining net-short exposure means volatility could remain high.
Positioning signal: Improving from deeply bearish
Preferred expression: Short EUR/JPY rather than buying JPY indiscriminately
British Pound Shorts Decline
British pound net shorts fell from -102.1K to -87.9K, an improvement of 14.2K contracts.
The pound remains substantially net short, but the weekly direction indicates that speculative traders are reducing bearish exposure.
This could reflect improving expectations concerning:
- Bank of England interest-rate policy
- UK economic growth
- Inflation persistence
- Political stability
- Sterling’s relative performance against the euro
British Pound Market Outlook
GBP positioning remains negative in absolute terms, but the short-covering trend is constructive.
Positioning signal: Cautiously improving
Preferred expression: GBP may outperform EUR if price action confirms the positioning divergence
Canadian Dollar Becomes the Most Heavily Shorted Currency
Canadian-dollar net shorts increased by 22.3K contracts, reaching -173.1K.
This is the largest net-short position among the currencies in the report.
The deterioration suggests that speculative traders remain concerned about:
- Canadian growth prospects
- Bank of Canada policy
- Canada-U.S. rate differentials
- Oil-market weakness
- Broader commodity-currency pressure
However, extremely negative positioning also increases the risk of a sharp CAD short squeeze.
A positive Canadian data surprise, oil-price recovery, or weaker U.S. dollar could force traders to reduce crowded Canadian-dollar shorts.
Canadian Dollar Market Outlook
The trend remains bearish, but the trade is increasingly crowded.
Positioning signal: Bearish but vulnerable to short covering
Trading implication: Avoid aggressively chasing CAD weakness after an extended move
Australian and New Zealand Dollars Remain Vulnerable
Australian-dollar positioning deteriorated from -17.7K to -24.7K, while New Zealand-dollar positioning slipped from -63.3K to -65.2K.
Both currencies remain exposed to:
- Chinese economic developments
- Global risk sentiment
- Commodity-market fluctuations
- U.S. dollar strength
- Domestic central-bank expectations
The Australian dollar recorded the clearer weekly deterioration, while the New Zealand dollar remains more heavily net short in absolute terms.
AUD positioning signal: Bearish
NZD positioning signal: Bearish
Mexican Peso Positioning Strengthens
Mexican-peso net longs increased from 70.9K to 77.4K, a bullish weekly change of 6.5K contracts.
The peso remains one of the few currencies with a substantial speculative net-long position.
This reflects relatively strong speculative confidence, although carry-trade positions may become vulnerable if global volatility rises sharply.
Positioning signal: Bullish
Primary risk: Broad risk-off conditions or sudden unwinding of carry trades
U.S. Equity-Index Positioning Analysis
Nasdaq 100 Flips to Net Long
Nasdaq 100 positioning improved from -7.6K net short to +2.1K net long, representing a bullish weekly shift of 9.7K contracts.
This is a meaningful change because positioning crossed from negative into positive territory.
The shift suggests that speculative traders are increasing exposure to:
- Technology shares
- Artificial-intelligence themes
- Semiconductor companies
- High-growth equities
- Large-cap technology leadership
Nasdaq 100 Market Outlook
The bullish COT transition supports buying controlled pullbacks rather than chasing extended rallies.
Positioning signal: Bullish
Preferred strategy: Buy pullbacks while major technical support remains intact
S&P 500 Shorts Increase
S&P 500 net shorts rose from -37.6K to -42.9K, a bearish change of 5.3K contracts.
This divergence between the Nasdaq 100 and S&P 500 is significant.
It indicates that speculative traders may be optimistic about selected technology shares while remaining cautious about the broader U.S. equity market.
Possible explanations include:
- Narrow market leadership
- Weakness in cyclical sectors
- Concerns about interest rates
- Valuation pressure outside leading technology companies
- Hedging against broader market exposure
S&P 500 Market Outlook
The COT report does not confirm broad-based equity optimism.
Positioning signal: Cautious to bearish
Relative preference: Nasdaq 100 exposure is stronger than broad S&P 500 exposure
Metals Positioning Analysis
Gold Remains Heavily Net Long
Gold speculative net longs increased only marginally from 194.0K to 194.2K.
The position remains large, but the weekly increase of only 0.2K contracts indicates that almost no new speculative buying entered the market.
This creates a potential positioning divergence when:
- Net-long exposure is already elevated
- Price momentum weakens
- Bond yields rise
- The U.S. dollar strengthens
- Safe-haven demand fails to produce fresh accumulation
Large existing long exposure can make gold vulnerable to liquidation if important technical support levels fail.
Gold Market Outlook
Gold retains strong structural support, but the latest COT report does not show renewed speculative conviction.
Positioning signal: Neutral to tactically bearish
Trading implication: Watch for rejection from resistance or a confirmed support breakdown
Silver and Copper Remain Moderately Supported
Silver net longs increased by 0.6K to 28.0K, while copper net longs declined slightly by 0.5K to 64.3K.
Neither market recorded a decisive weekly change.
Copper’s stable net-long position suggests that speculative traders have not adopted an aggressively bearish global-growth outlook. However, the absence of additional buying also limits bullish conviction.
Silver positioning signal: Mildly bullish
Copper positioning signal: Neutral to moderately bullish
Energy-Market Positioning Analysis
Crude-Oil Longs Fall Sharply
Crude-oil net longs declined from 110.5K to 75.7K, representing a substantial liquidation of 34.8K contracts.
This was one of the largest absolute changes in the report.
The decline indicates that speculative traders aggressively reduced bullish oil exposure.
Potential reasons include:
- Concerns about global oil demand
- Expectations of increased production
- Reduced confidence in sustained geopolitical risk premiums
- Weak technical price action
- Profit-taking after previous rallies
What Does Crude-Oil Long Liquidation Mean?
The reduction is bearish because it shows falling conviction among bullish traders.
However, the liquidation also means the market is less crowded on the long side. If oil prices break above important resistance because of a supply disruption, the resulting move could be amplified by renewed buying and short covering.
Crude-Oil Market Outlook
The trend remains bearish until price confirms a reversal.
Positioning signal: Bearish
Preferred strategy: Avoid immediate long exposure; consider buying only after a confirmed technical breakout
Natural Gas Shorts Are Reduced
Natural-gas positioning improved from -170.8K to -165.3K, indicating short covering of 5.5K contracts.
Nevertheless, the market remains extremely net short.
This creates potential short-squeeze conditions, but one week of moderate covering is not enough to confirm a bullish trend reversal.
A stronger natural-gas recovery would require support from:
- Weather-driven demand
- Storage data
- LNG export demand
- Production disruptions
- Confirmed technical breakouts
Positioning signal: Deeply bearish but vulnerable to short squeezes
Agricultural-Commodity Positioning Analysis
Corn Records the Strongest Bullish Signal
Corn net longs surged from 64.2K to 101.0K, an increase of 36.8K contracts.
This represents one of the strongest bullish positioning changes in the entire report.
The move indicates substantial speculative accumulation and suggests that traders are becoming more optimistic about the corn market.
Possible drivers include:
- Export-demand expectations
- Weather concerns
- Crop-development risks
- Lower production expectations
- Stronger physical-market demand
Corn Market Outlook
Corn offers one of the clearest cases where speculative positioning and bullish market expectations are aligned.
Positioning signal: Strongly bullish
Preferred strategy: Buy a technically confirmed pullback
Soybean Net Longs Rise by 36.2K Contracts
Soybean net longs increased from 76.6K to 112.8K, a bullish weekly change of 36.2K contracts.
The scale of accumulation was almost equal to that seen in corn.
This suggests strong speculative confidence in soybean prices, potentially supported by:
- Export purchases
- Chinese demand
- Weather risks
- Production uncertainty
- Changes in global oilseed supply
Soybean Market Outlook
Soybean positioning is bullish, but the rapid accumulation of longs could increase volatility if crop conditions improve unexpectedly.
Positioning signal: Strongly bullish
Primary risk: Adverse weather forecasts reversing or export demand weakening
Wheat Shorts Continue to Decline
Wheat net shorts fell from -55.0K to -49.7K, showing short covering of 5.3K contracts.
This is a constructive change, but speculative traders remain net short.
Wheat may be in an early positioning transition rather than an established bullish trend.
Positioning signal: Improving but still bearish
Relative preference: Corn and soybeans offer stronger bullish positioning signals
Cross-Asset Market Condition
The latest CFTC report points to a selective and fragmented market environment rather than a broad risk-on or risk-off regime.
Several important themes are visible:
- Technology positioning is improving, but broad equity positioning remains defensive.
- The euro is weakening while yen and sterling shorts are being reduced.
- Commodity currencies remain under pressure.
- Gold retains a large long position without significant fresh buying.
- Crude-oil optimism has deteriorated sharply.
- Agricultural commodities are attracting the strongest speculative inflows.
This environment favors relative-value and market-specific trades rather than broad directional exposure across an entire asset class.
CFTC-Based Trading Ideas and Signals
- Trading Signal 1: EUR/JPY Sell
Asset: EUR/JPY
Bias: Bearish
Positioning rationale: The euro flipped net short while the Japanese yen recorded the strongest FX short covering.
Entry Strategy
Primary entry: Sell a rejection from 185.20–185.60
Alternative breakdown entry: Sell after confirmed price acceptance below 184.35
Stop-loss: 186.10
Take-profit 1: 182.60
Take-profit 2: 180.80
Entry and Exit Status
Entry status: Pending. Avoid entering after a large opening gap below the proposed entry area.
Exit status: Take partial profit at 182.60 and retain the remaining position toward 180.80.
Scenario Violation
The bearish scenario is invalidated by a confirmed daily close above 186.10.
Signal confidence: High
Main risk: Unexpected euro strength or renewed yen weakness caused by changes in Japanese monetary-policy expectations.
- Trading Signal 2: Nasdaq 100 Buy
Asset: Nasdaq 100
Bias: Bullish
Positioning rationale: Speculators moved from -7.6K net short to +2.1K net long.
Entry Strategy
Entry zone: 29,500–29,650
Stop-loss: 29,140
Take-profit 1: 30,330
Take-profit 2: 30,850
Entry and Exit Status
Entry status: Pending a controlled pullback into support. Avoid chasing an extended move near resistance.
Exit status: Take partial profit near 30,330 and manage the remainder toward 30,850.
Scenario Violation
A confirmed daily close below 29,140 would invalidate the bullish setup and indicate that the positioning reversal failed to support price.
Signal confidence: Medium-high
Main risk: Higher inflation, rising Treasury yields, or weaker technology-sector earnings.
- Trading Signal 3: Gold Sell
Asset: Gold
Bias: Tactically bearish
Positioning rationale: Speculators remain heavily net long, but almost no additional exposure was added during the week.
Entry Strategy
Entry zone: $4,125–$4,145
Stop-loss: $4,196
Take-profit 1: $4,050
Take-profit 2: $3,985
Entry and Exit Status
Entry status: Pending a rebound into resistance followed by bearish rejection.
Exit status: Reduce exposure at $4,050 and trail the remaining position toward $3,985.
Scenario Violation
A daily close above $4,196 invalidates the bearish positioning-divergence scenario.
Signal confidence: Medium-high
Main risk: A sudden geopolitical escalation that generates strong safe-haven demand.
- Trading Signal 4: Corn Buy
Asset: Corn futures
Bias: Bullish
Positioning rationale: Net-long exposure increased by 36.8K contracts to 101.0K.
Entry Strategy
Entry zone: 430–435 cents per bushel
Stop-loss: 418 cents
Take-profit 1: 455 cents
Take-profit 2: 475 cents
Entry and Exit Status
Entry status: Pending a controlled pullback. Avoid aggressively chasing a vertical price increase.
Exit status: Take partial profit at 455 cents and hold the remaining position while price remains above the breakout structure.
Scenario Violation
A daily close below 418 cents would indicate that speculative accumulation failed to sustain the bullish structure.
Signal confidence: High
Main risk: Improved crop conditions, weaker exports, or unexpected supply revisions.
- Trading Signal 5: WTI Crude-Oil Breakout Buy
Asset: WTI crude oil
Bias: Neutral until bullish confirmation
Positioning rationale: Major long liquidation remains bearish, but it has reduced crowded bullish exposure and could support a sharp reversal after a confirmed breakout.
Entry Strategy
Entry trigger: Buy only after a confirmed four-hour close above $74.20
Stop-loss: $71.75
Take-profit 1: $76.80
Take-profit 2: $79.20
Entry and Exit Status
Entry status: No active trade while WTI remains below $74.20.
Exit status: Take partial profit at $76.80 and trail the remaining position below the latest four-hour higher low.
Scenario Violation
Cancel the setup if WTI falls below $70.80 before triggering the entry.
After activation, a confirmed close below $71.75 invalidates the bullish breakout scenario.
Signal confidence: Medium
Main risk: Improving supply conditions, weaker demand expectations, or reduced geopolitical disruption.
- Alternative EUR/USD Trading Signal
Traders unable to access EUR/JPY can express the bearish euro view through EUR/USD.
Bias: Bearish
Entry zone: 1.1430–1.1470
Stop-loss: 1.1540
Take-profit 1: 1.1320
Take-profit 2: 1.1220
Scenario violation: A daily close above 1.1540
EUR/USD and EUR/JPY should not both be traded at full position size because both setups depend heavily on the same bearish-euro thesis.
Best CFTC Trading Opportunities
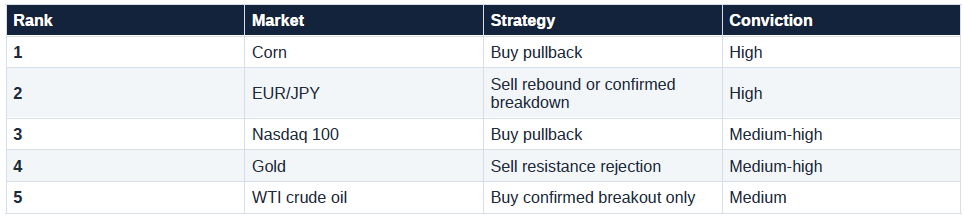
Corn offers the strongest alignment between positioning and bullish market structure.
EUR/JPY presents the clearest foreign-exchange relative-value setup because the euro became net short while Japanese-yen shorts were reduced aggressively.
Nasdaq 100 positioning is improving, but entries should focus on pullbacks rather than extended rallies.
Gold presents a tactical bearish divergence, while WTI remains a conditional breakout trade rather than an immediate long position.
Conclusion
The latest CFTC COT report shows that speculative traders are becoming more selective.
The euro and crude oil recorded the clearest bearish positioning changes, while the Japanese yen and British pound benefited from short covering. In equities, speculative demand shifted toward the Nasdaq 100, but increasing S&P 500 shorts indicate that confidence has not broadened across the entire U.S. stock market.
The strongest bullish positioning appeared in agriculture. Corn net longs increased by 36.8K contracts, while soybean net longs rose by 36.2K contracts.
Based on the combination of positioning and technical structure, the strongest opportunities are:
- Buying a controlled corn pullback
- Selling EUR/JPY after confirmation
- Buying a Nasdaq 100 pullback
- Selling a gold resistance rejection
- Buying WTI only after a confirmed breakout
COT data should not be used as a standalone entry indicator. It is most effective when combined with technical structure, current prices, macroeconomic catalysts, and disciplined risk management.
Frequently Asked Questions
What did the latest CFTC report show?
The report showed bearish shifts in euro, Canadian-dollar, Australian-dollar, S&P 500, and crude-oil positioning. It also showed short covering in the Japanese yen and British pound, a bullish positioning reversal in the Nasdaq 100, and strong accumulation in corn and soybeans.
Which currency had the most bearish CFTC position?
The Canadian dollar had the largest net-short position at -173.1K contracts. However, the crowded short position also increases the probability of a sharp Canadian-dollar recovery if market conditions improve.
Why is the euro positioning change important?
The euro moved from +1.1K net long to -16.2K net short. Crossing from positive to negative territory indicates that speculative traders have adopted a net-bearish euro position.
Is the Japanese yen now bullish?
Not yet on an absolute positioning basis. Yen shorts were reduced by 31.3K contracts, but speculators remain net short by 123.8K contracts. The data indicates strong short covering rather than established net-long accumulation.
What is the strongest forex trading idea from the report?
EUR/JPY offers the strongest relative-positioning setup because euro exposure deteriorated while Japanese-yen shorts were reduced substantially.
Is the Nasdaq 100 positioning bullish?
Yes. Nasdaq 100 positioning moved from -7.6K net short to +2.1K net long, representing a bullish reversal of 9.7K contracts.
Why does the S&P 500 positioning remain cautious?
Speculative net shorts increased to -42.9K. This suggests that traders remain cautious about the broad U.S. equity market despite improving technology-sector positioning.
Is gold positioning bullish or bearish?
Gold remains heavily net long at 194.2K contracts, but only 0.2K contracts were added during the week. The large but stagnant position creates tactical downside risk if price momentum weakens.
Why did the crude-oil outlook become bearish?
Crude-oil net longs declined by 34.8K contracts, indicating substantial liquidation of bullish positions. This suggests that speculative confidence in higher oil prices has weakened.
Which commodity has the strongest bullish CFTC signal?
Corn recorded the strongest bullish positioning increase, with net longs rising by 36.8K contracts to 101.0K. Soybeans were close behind, with an increase of 36.2K contracts.
Can CFTC data be used for day trading?
CFTC data is more suitable for identifying medium-term positioning trends than precise intraday entries. Day traders should combine it with live technical levels, market structure, volatility, and short-term catalysts.
How often is the CFTC COT report released?
The COT report is normally released weekly and reflects positions held earlier in the same week. Because of this delay, live prices and current market developments must be checked before executing a trade.
What invalidates a CFTC-based trading signal?
A positioning-based signal is invalidated when price action breaks the technical level supporting the thesis, when a major macroeconomic catalyst changes the market regime, or when later CFTC reports show a meaningful reversal in positioning.
-----------------------------------------------------------------
Source: U.S. Commodity Futures Trading Commission
Risk Disclaimer: This report is for informational and educational purposes only and does not constitute investment advice. Futures, forex, equity-index, and commodity trading involve substantial risk. Confirm live prices, contract specifications, and market conditions before opening any position.
Comments