 English
 پارسی


Market Condition: Sell / Intraday Bearish
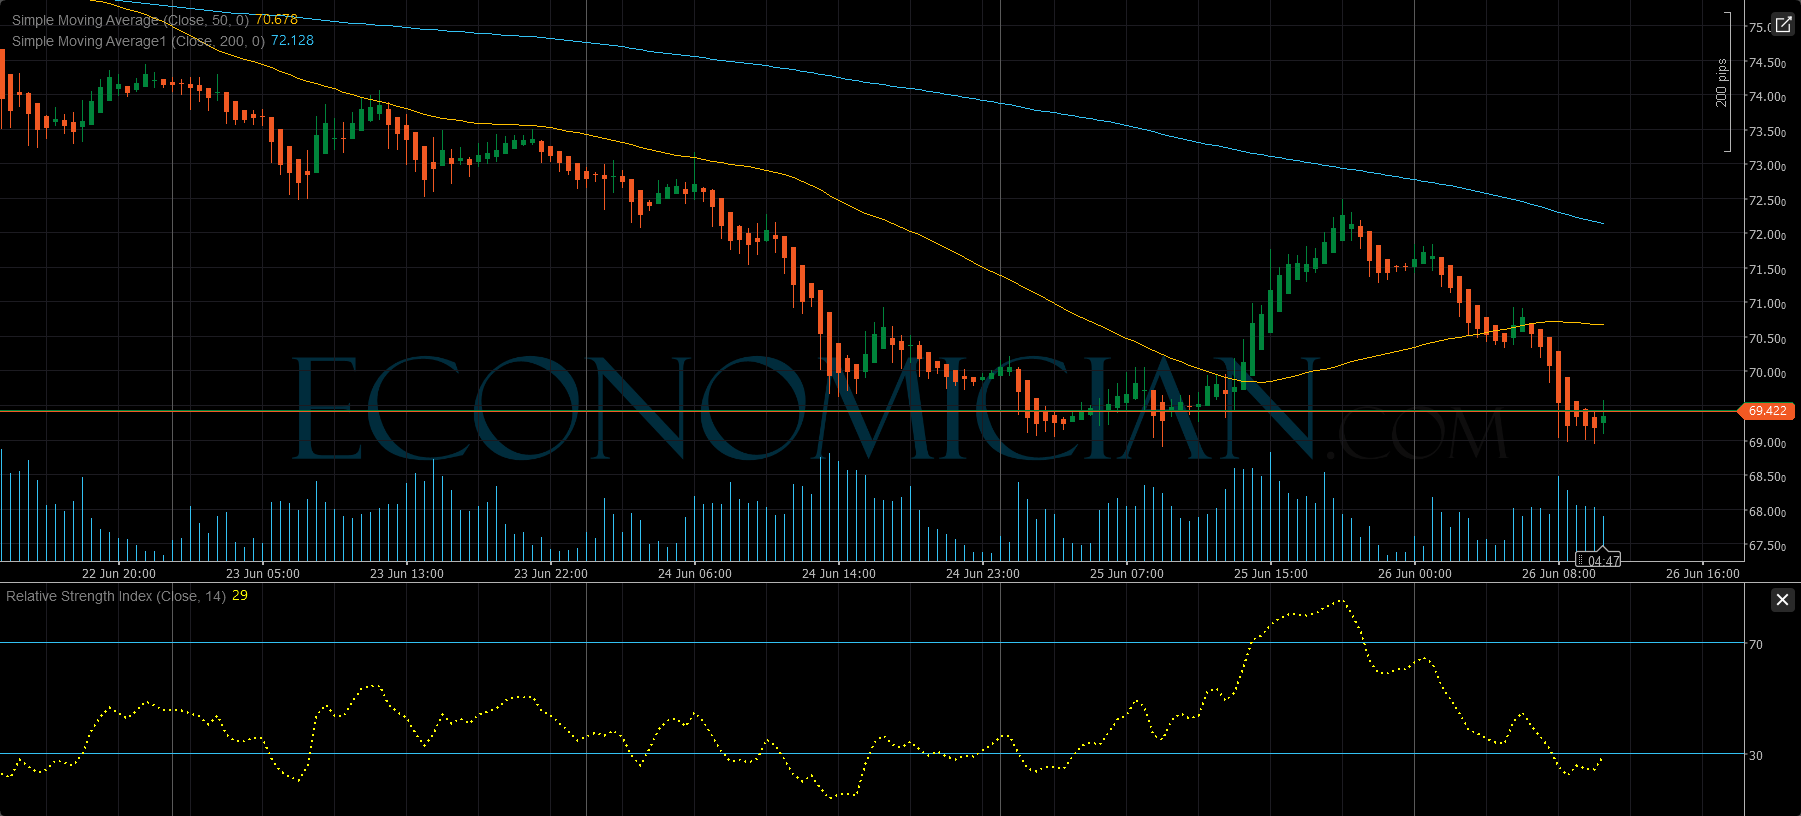
The WTI 30-minute chart remains weak. Price is trading near 69.422, while the 50-period SMA sits at 70.678 and the 200-period SMA stands at 72.128. With price holding below both moving averages, the short-term structure is still tilted to the downside.
Technically, the chart shows a clear bearish sequence of lower highs and lower lows after the late-session rebound failed under the 50 SMA. The first immediate support sits around 69.20–69.00. If that zone breaks, the next downside area comes in near 68.50. On the upside, the first resistance is 69.90–70.00, followed by the more important 50 SMA near 70.68. The broader intraday trend barrier remains the 200 SMA near 72.13.
The momentum picture is stretched, but not yet bullish. RSI is around 29, which signals oversold conditions. That raises the risk of a short bounce, but as long as price remains below 70.68, any rebound still looks corrective rather than trend-changing. In practical terms, this is a bearish intraday chart with oversold rebound risk.
Fundamental Note
The latest oil backdrop also supports a softer near-term tone. Reuters reported on June 26 that U.S. WTI fell 3.42% to $69.46 and was on track for a weekly loss of nearly 10%, as supply fears eased with more tankers leaving the Strait of Hormuz. Reuters also said Saudi Aramco resumed operations at Ras Tanura after a long halt and that weak demand from China was adding pressure to prices.
Reuters further reported on June 24 that the oil curve was starting to signal near-term oversupply as more vessels re-entered Hormuz routes, reinforcing the market’s view that the earlier war premium was fading.
Possible Market Effect
If WTI breaks below 69.00, the move could reinforce the broader correction in oil and reduce some immediate inflation pressure across FX and bond markets. If crude reclaims 70.68, the market could stabilize temporarily and squeeze back toward the 71.50–72.10 region.
Trading Signal
Signal: Sell on rebound
Entry: 69.90
Stop Loss: 70.80
Take Profit 1: 69.00
Take Profit 2: 68.50
This setup favors a controlled bearish trade because price remains below both the 50 SMA and 200 SMA, while the latest fundamental backdrop points to softer supply-risk pricing. A break and hold above 70.80 would weaken the bearish intraday setup materially.
Comments