 English
 پارسی


Technical Analysis
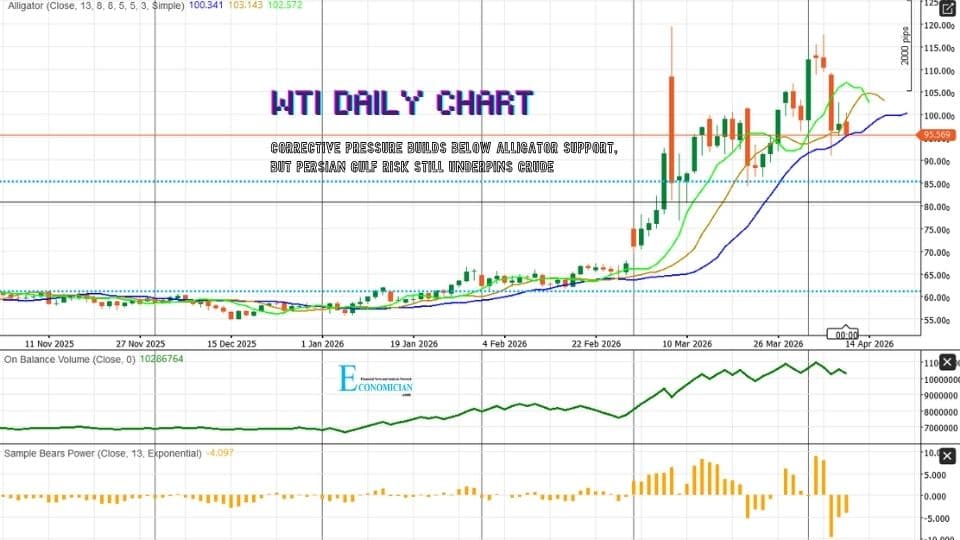
The daily WTI chart shows that crude remains in a broader elevated price regime, but the near-term structure has turned corrective. Price is trading around 95.569, well below the Alligator jaw at 100.341, teeth at 103.143, and lips at 102.572. That placement indicates that the recent rebound has lost momentum and that sellers are controlling the market below the main dynamic resistance cluster.
The chart also shows that the powerful rally from late February into late March has shifted into a pullback phase rather than immediate trend continuation. The market has failed to hold above the psychological 100.00 area and is now testing the mid-range support zone around 95.50. If this area breaks decisively, the next downside zone comes in near 90.00, followed by the stronger chart support around 85.38. On the upside, crude needs to reclaim 100.34 first and then the 102.57-103.14 cluster to neutralize the current corrective bias.
Momentum indicators still favor caution. On-Balance Volume remains historically elevated, which shows that the larger rally attracted strong participation, but the line has flattened and lost upside acceleration. At the same time, Bears Power is negative at -4.097, confirming that sellers still have short-term pressure. In practical terms, this is not yet a clean bearish reversal of the entire prior advance, but it is a clear loss of momentum that keeps downside risk active while price remains under the Alligator lines.
Fundamental Note
The latest oil backdrop is mixed, but it still supports a risk premium under crude prices. On April 10, WTI settled at $96.57, down 13.4% on the week, its largest weekly decline since April 2020, as traders focused on U.S.-Iran ceasefire talks. However, Reuters also said the flow of oil through the Strait of Hormuz remained heavily restricted, traffic was still less than 10% of normal volumes, and Saudi Arabia’s attacks-related disruptions cut production capacity by about 600,000 barrels per day and East-West Pipeline throughput by around 700,000 barrels per day.
That is why the downside in oil may remain limited rather than fully open-ended. The U.S. Energy Information Administration said this week that the closure of the Strait of Hormuz has lasted longer than previously assumed, that production shut-ins are expected to reach 9.1 million barrels per day in April, and that the market will likely retain a larger geopolitical risk premium even after flows begin to recover. The EIA also said it expects Brent to peak at $115 per barrel in 2Q26 before easing later, reflecting the view that supply disruption and shipping backlogs will not normalize quickly.
Trading Signal
Signal: Sell on a break below support
Entry: 95.40
Stop Loss: 100.60
Take Profit 1: 90.00
Take Profit 2: 85.50
This setup is based on price trading below all three Alligator lines, the failure to hold above 100, and still-negative Bears Power. A daily close back above 100.34 would weaken this bearish setup materially and shift the focus back toward 102.57-103.14.
Comments