 English
 پارسی


Technical Analysis
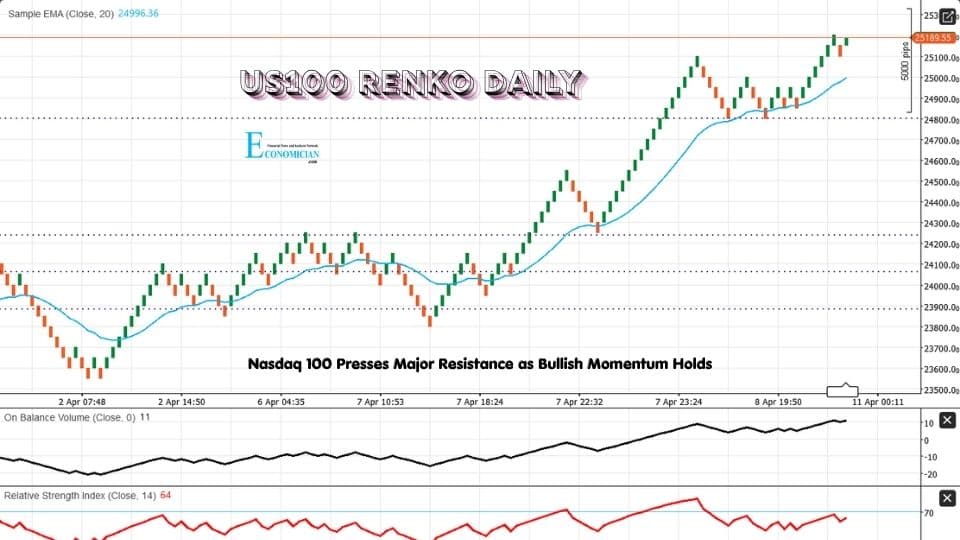
The US100 Renko 500 daily chart remains structurally bullish. Price is trading around 25,189.55, clearly above the 20-period EMA at 24,996.36, which confirms that the medium-term uptrend is still intact. The recent sequence of Renko bricks also shows persistent upward follow-through after the rebound from the early-April consolidation zone, with buyers continuing to defend dips rather than allowing a deeper retracement.
Momentum conditions are constructive, but the market is now testing a key barrier. The chart shows price pressing directly into the 25,190-25,200 resistance zone, while RSI at 64 remains firm but still below overbought territory. That suggests bullish momentum is still present, though the index is approaching a level where breakout confirmation matters. A clean move above 25,200 would strengthen the case for trend continuation, while failure at this zone could trigger a short-term pause back toward the 24,800 area first.
Volume confirmation is also supportive. On-Balance Volume has been trending higher, which indicates that accumulation has improved during the latest rally leg. As long as the price remains above the 20 EMA and above the breakout base around 24,800, the broader technical bias stays positive. Below that, the next important support area comes in around 24,300.
Fundamental Note
The latest macro and equity backdrop is still supportive for the Nasdaq-heavy US100, but it is not one-way. Reuters reported that the Nasdaq rose 0.35% on April 10, outperforming the Dow and S&P 500, while chipmakers led gains and the semiconductor index touched a record high; Reuters also noted that TSMC beat first-quarter revenue forecasts and that investors are heading into Q1 earnings season with expectations for strong profit growth. Separately, Reuters said first-quarter S&P 500 earnings are expected to rise about 14%, while the heavyweight technology sector is projected to deliver earnings growth of more than 40%, which helps explain continued resilience in growth-heavy indices such as the Nasdaq 100.
At the same time, the macro risk backdrop has not disappeared. Reuters reported that March U.S. CPI accelerated to 3.3% year-on-year, consumer prices posted their largest monthly jump in nearly four years, and investors remain focused on fragile Middle East negotiations after the U.S.-Iran ceasefire. That mix keeps the environment supportive for equities through easing immediate war fears and strong tech fundamentals, but it also means sticky inflation and renewed geopolitical stress could still cap upside momentum if headlines deteriorate.
Trading Signal
Signal: Buy on breakout
Entry: 25,220
Stop Loss: 24,780
Take Profit 1: 25,500
Take Profit 2: 25,900
This setup favors upside continuation because price is above the 20 EMA, OBV is rising, and RSI remains supportive without yet showing an extreme overbought reading. The key condition is confirmation above 25,200. Without that breakout, the chart could remain trapped in short-term resistance consolidation.
Comments