 English
 پارسی


Policy and rates narratives also re‑entered the weekly market driver set. Risk assets traded amid headlines around 2’s nomination of 3 to succeed 4 at the 5, a development that market commentary framed as potentially more hawkish on inflation while still supportive of rate reductions over time. 6
Reporting progress and aggregate surprise statistics
S&P 500 “scoreboard” (best documented in public sources)
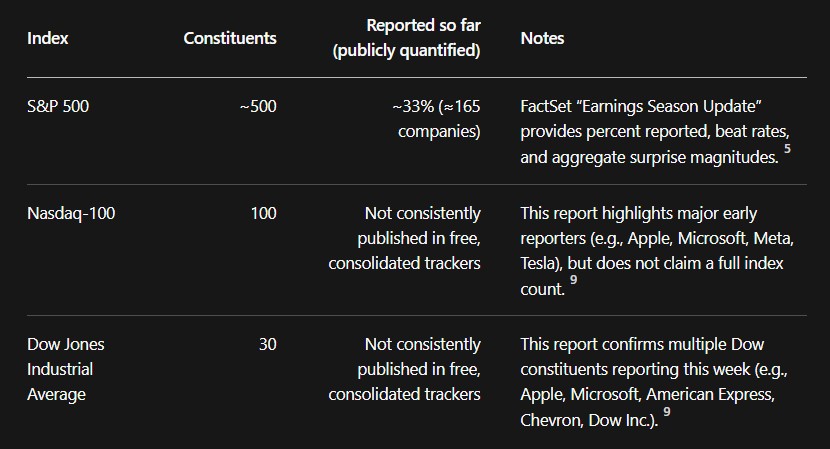
Public, index‑level tracking is most complete for the 7. As of January 30, about 33% of constituents had reported Q4 2025 results. Of those reporters, 75% beat EPS estimates (below the 5‑year average of 78%), while the magnitude of earnings surprises was strong: aggregate earnings ran 9.1% above estimates. Revenues were also positive in aggregate, with 65% of reporters beating top‑line estimates and total revenues coming in ~1.2% above consensus. 5
A second public tracker using 4 I/B/E/S data cited a similar “one‑third complete” picture, noting roughly 166 S&P 500 constituents reported by that point.
Index reporting counts
A key limitation for public (“free web”) data is that comparable, consolidated to‑date reporting counts for the 8 and the 2 are not consistently disclosed in accessible primary trackers (without paid terminals). For transparency, the table below separates (a) the well‑sourced S&P 500 count from (b) a minimum confirmed set of constituents discussed in this report that have released earnings.
Sector scorecard
FactSet’s sector‑level scorecard shows a reporting season that is uneven across sectors, but with a clear pattern: earnings growth is being driven by Information Technology and Industrials, while Health Care and Energy have been modest drags on year‑over‑year profit growth (even as some Energy majors beat EPS expectations). 10
Sector performance table (S&P 500, Q4 2025; as of Jan 30, 2026)
Numbers below are transcribed from FactSet’s sector charts (beat rates and YoY growth rates). 11
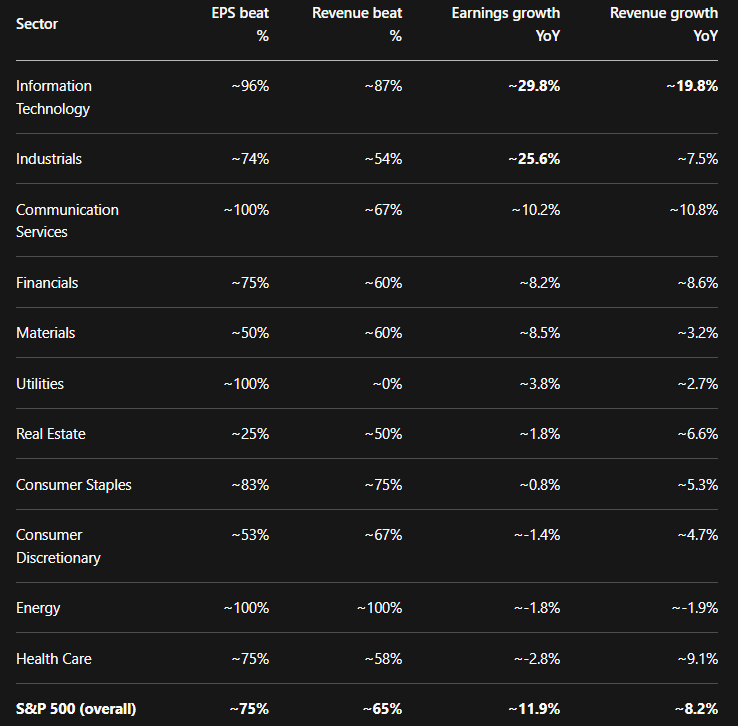
The charts below visualize (a) where earnings growth is concentrated and (b) how “beat rates” are clustering—useful context when interpreting single‑company beats/misses in high‑expectation groups like IT and Communication Services. 10
Energy and materials results
- Energy: beats on EPS, mixed on revenues, and a focus on capital return
12 reported adjusted EPS of $1.71 for Q4 2025 and described quarterly earnings (excluding identified items) of $7.3B, with operating cash flow of $12.7B and free cash flow of $5.6B. 13 In market‑consensus framing, Reuters noted the company beat EPS expectations (analysts around $1.68) as higher production from the Permian and Guyana supported results despite lower crude prices. 8 Revenue was $82.31B, which some consensus measures described as slightly under expectations. 2
Management messaging emphasized (1) advantaged volume growth (Guyana, Permian), (2) refining margin tailwinds, and (3) ongoing shareholder returns (dividends plus repurchases). Reuters also highlighted Exxon’s planned $20B repurchase program through 2026 and an output target of ~4.9 million boepd in 2026, reinforcing a “volume + buybacks” playbook. 8
9 posted adjusted earnings of $1.52 per share for Q4 2025 (adjusted earnings $3.0B), and raised its quarterly dividend 4% to $1.78/share. 7 Third‑party consensus summaries characterized the quarter as an EPS beat versus expectations (~$1.44) but a revenue miss (reported around $46.9B versus a higher consensus). 4
Sector read‑through: Energy’s 100% EPS beat rate in FactSet’s early sample looks impressive, but the sector’s negative YoY earnings/revenue growth underscores that “beat rates” can coexist with a weaker fundamental base when the estimate bar is already reset lower (e.g., lower oil prices year‑over‑year). 11
- Materials/Chemicals: restructuring and demand sensitivity
14 reported Q4 2025 net sales of $9.46B and a GAAP net loss of $1.48B, with results pressured by price declines and lower operating rates. 15 Public reporting around the release also highlighted a major restructuring plan (“Transform to Outperform”), including ~4,500 job cuts, positioning chemicals as one of the more cyclically exposed areas of the early season. 16
Financials and communication services results
- American Express and the state of high‑income consumption
2 printed Q4 2025 EPS of $3.53, essentially in line but fractionally below consensus in several reports (about a one‑cent miss), while revenue rose ~10% to $18.98B, beating expectations. 17
Management guidance was constructive: American Express projected 2026 EPS of $17.30–$17.90 and revenue growth of 9–10%, pointing to continued spend resiliency among premium cohorts even with elevated engagement costs. 12
- Verizon: volumes improve, and guidance frames a “turnaround year.”
17 reported Q4 2025 adjusted EPS of $1.09 on $36.4B in revenue and highlighted its best postpaid phone net adds since 2019 (616k). 3 The company tied momentum to strategy changes and the closing of the 17 transaction, which management said expanded fiber access to 30+ million locations. 3
Guidance was unusually explicit and upbeat for a mature telecom: for 2026, Verizon forecast 750k–1.0M retail postpaid phone net adds, 2–3% mobility and broadband service revenue growth, adjusted EPS of $4.90–$4.95, capex $16.0–$16.5B, and free cash flow of $21.5B+. 3
Implication: In a market that is increasingly “guidance‑driven,” Verizon’s combination of beats plus raised/clear targets helps explain why telecom could see sharply positive price reactions even while other “beat” stories struggled.
Guidance themes and market implications
The dominant cross‑sector theme:
- Spending on the AI infrastructure must translate into visible payoffs
Among mega‑cap tech and communications names, management commentary repeatedly returned to AI—either as a revenue accelerator (ad optimization, cloud workloads) or as a cost/capex burden that investors are now demanding be justified.
- 14 reported Q4 2025 revenue of $59.89B (+24% YoY) and EPS of $8.88, beating Wall Street expectations, while also flagging sharply higher cost intensity (costs up 40% YoY). 18 It guided Q1 revenue to $53.5B–$56.5B (above consensus in several reports) and discussed materially higher 2026 expense levels, consistent with ongoing AI infrastructure and talent spending. 19
- 3 posted quarterly revenue of $81.3B (+17% YoY) and GAAP EPS of $5.16 (+60% YoY). 20 Yet investor reaction turned on the perception that AI investment is pressuring cloud profitability and that monetization is still being debated—illustrating the market’s widening gap between “reported strength” and “narrative confidence.” 14
- 4 delivered a record quarter with revenue of $143.8B (+16% YoY) and EPS of $2.84 (+19% YoY), with iPhone and Services at all‑time highs; management characterized results as “well above expectations.” 9
Energy’s guidance: capital discipline plus shareholder returns remains core
Energy management teams leaned into capital return frameworks and advantaged production growth, even as the sector’s aggregate YoY growth remained slightly negative. Exxon’s emphasis on structural cost savings, output growth, and a multi‑year buyback program is representative of the broader “lower‑cost barrel + capital return” narrative. 8
Markets are increasingly “grading guidance,” not just results
A recurring pattern in market commentary is that headline beats are receiving weaker stock reactions than in prior cycles if forward guidance is absent or if spending ramps are perceived as dilutive. Bloomberg Intelligence‑style tracking summarized this as an environment where “sell the fact” can dominate when guidance is not clearly supportive. 21
This dynamic is visible in weekly positioning:
- The S&P 500’s move to record territory suggests investors still believe the earnings engine is intact, particularly around AI‑adjacent growth. 1
- At the same time, Reuters’ “week ahead” framing emphasized that with high valuations and AI‑linked expectations, upcoming prints (Alphabet, Amazon, AMD, Disney, and others) are likely to act as a gating function for whether optimism can broaden beyond a narrow set of winners. 22
VDFDGSSSSF
Comments