 English
 پارسی


For the Nasdaq-100, Nasdaq Global Indexes reported that 63 constituents (72% by index weight) had reported by Feb 11; on an index‑weighted basis, 84% exceeded earnings expectations, and by count 49/63 beat EPS while 53/63 beat revenue, with average surprises of +5.3% EPS and +1.7% revenue.
The Dow Jones Industrial Average is near the end of the cycle by mid‑February: using Home Depot’s scheduled Feb 24 earnings date as the key laggard, ~29/30 components appear to have reported by Feb 15 (see methodology/limitations).
Coverage and reporting progress
Index reporting counts and “beat” statistics so far
Data cut‑off note: Sector scorecards below are anchored to Feb 11–13 (the latest public aggregator updates used). Company examples include several reports released Feb 18–19 (e.g., eBay, Moody’s, Walmart, Booking).
- S&P 500:
So far, roughly ~370 of 500 constituents have reported (implied), meaning about 74% of the index is in. The EPS beat rate is 74% (above estimates), and the revenue beat rate is 73% (above estimates). The average surprise is +7.2% (EPS) and +1.6% (revenue). Primary source used: FactSet Research Systems “Earnings Season Update” (Feb 13).
- Nasdaq-100:
A total of 63 of 100 constituents have reported, representing about 72% (by weight) of the index. The EPS beat rate is 84% beat (weighted), and 49/63 beat on a simple count basis. On revenue, 53/63 beat estimates (count). The average surprise is +5.3% (EPS) and +1.7% (revenue). Primary source used: Nasdaq Global Indexes earnings update (data as of Feb 11).
- Dow 30:
Approximately ~29 of 30 companies have reported (estimated), implying about ~97% completion. EPS beat rate, revenue beat rate, and average surprise are not compiled here (see limitations). This row is based on an inference from the remaining reporter (The Home Depot) and the relevant timing window.
Interpretation:
The season’s headline beat rates remain above long‑term norms, but the “earnings surprise → stock pop” linkage is weaker in expensive segments because guidance quality, capex intensity, and buyback capacity are now front‑and‑center—particularly for AI hyperscalers and adjacent software.
Sector scorecard across the U.S. large‑cap economy
S&P 500 sector-by-sector performance
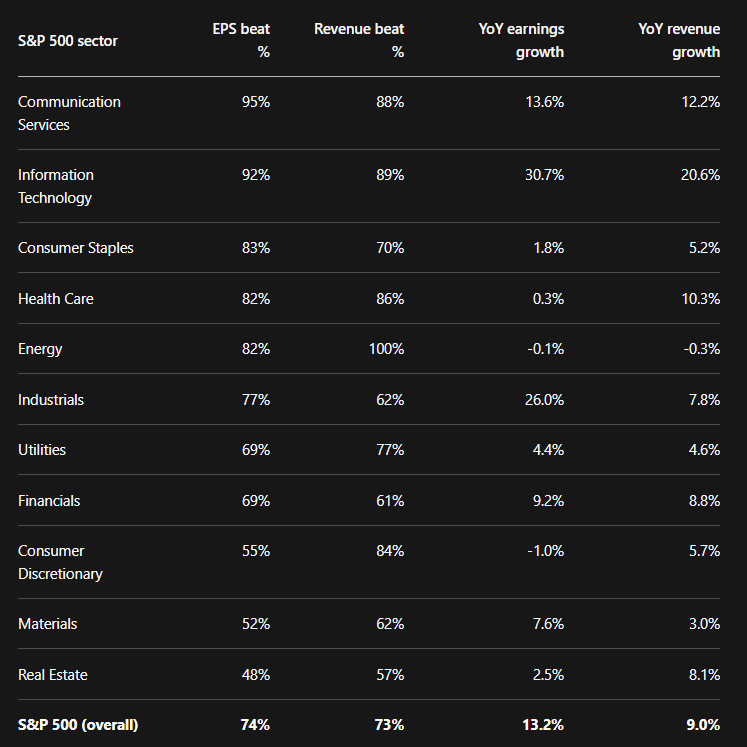
The following reflects FactSet sector scorecards as of Feb 13, 2026, for Q4 2025: EPS/revenue “beat rates” are shares of reporting companies in each sector above consensus; growth rates are blended YoY growth (actual + estimates).
What the sector table implies
The split that matters most is growth vs. cyclicality vs. guidance credibility:
- Information Technology and Industrials show the fastest YoY earnings expansion (30.7% and 26.0%), consistent with AI‑infrastructure demand, backlog conversion, and operating leverage—but also facing capex scrutiny (esp. hyperscalers).
- Energy shows a perfect revenue beat rate but flat-to-negative growth, consistent with lower realized prices vs. the prior year, even as production volumes are solid.
- Consumer Discretionary is the weakest on EPS beat % (55%) while still strong on revenue beat % (84%), a classic pattern when discounting/promo, wage and shipping friction, and mix effects compress margins.
Key company results and cross-sector examples
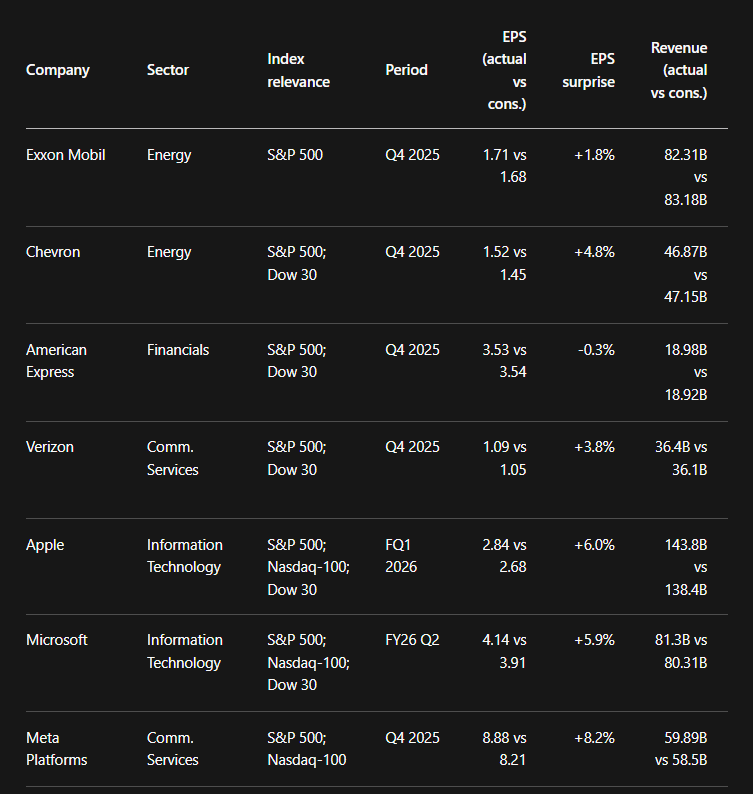
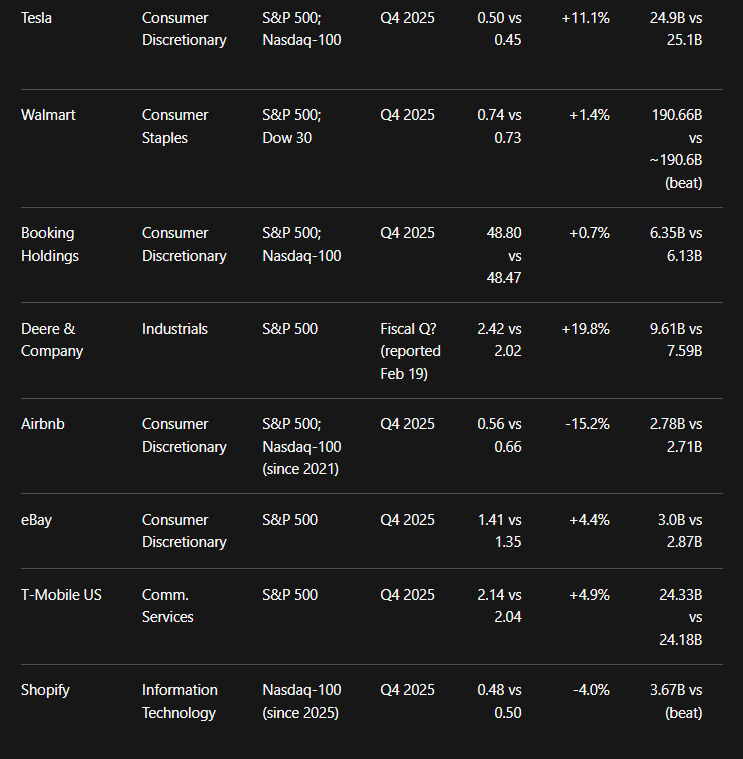
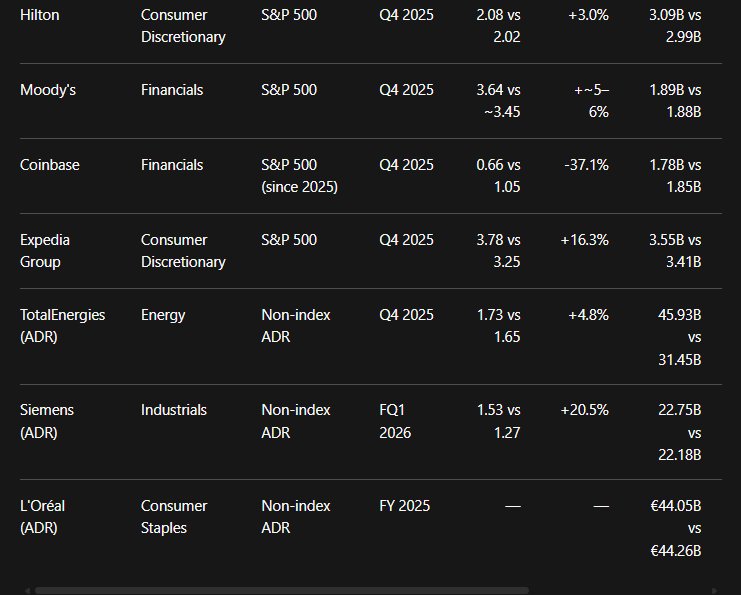
Key company scorecard with exact EPS, revenue, and surprise %
Notes:
- “EPS” below uses the most commonly cited earnings metric in the linked sources (often adjusted/non‑GAAP for comparability).
- “Consensus” differs by provider (FactSet, Reuters/LSEG, Zacks, etc.); the table cites the source used for the estimate.
Company-level storylines that mattered most
Energy: disciplined capital returns, but pricing cycle still visible.
Exxon and Chevron both leaned on production strength and capital return narratives, but Exxon missed revenue expectations, and the sector’s YoY growth is roughly flat in aggregate.
Payments and telecom: “operational beats” were more important than EPS pennies.
American Express was essentially in line on EPS, but guidance was supportive (midpoint above Street). Verizon’s upside surprise was driven by subscriber adds, churn, and buyback framing, leading to an outsized equity reaction.
Mega-cap tech: beats were common; capex and AI competitive optics drove multiples.
Microsoft exceeded expectations, yet investor anxiety about AI buildout and cloud growth durability has been a recurring theme. Meta’s advertising engine beat continued, but the market is balancing that against the scale of its 2026 AI capex plan and related cost actions.
Consumer and travel: demand is bifurcating (premium resilient; value/budget uneven).
Booking cited steady international demand while noting softness in parts of the U.S. travel wallet. Walmart posted solid comps and online growth, yet issued a conservative outlook & emphasized pressure among lower‑income consumers.
Guidance, management themes, and sector risks
The recurring guidance pattern
A consistent theme across transcripts and management commentary is “strong results, cautious framing”, especially when the market is paying more for clarity on 2026 profitability paths than for Q4 upside surprises.
Key themes by sector
AI capex scale and return-on-invested-capital skepticism (Tech/Comm Services).
- Microsoft and peers are perceived as shifting further into an “asset‑heavy” capex phase; investor sensitivity to the magnitude and duration of AI spending has increased.
- Meta’s own capex range (and cost actions like trimming equity awards) underscores the intensity of this phase, with investors increasingly modeling FCF compression and reduced buyback flexibility.
Consumer bifurcation and “high bar” guidance (Staples/Discretionary).
- Walmart’s commentary highlights that growth is being supported by e‑commerce and higher‑income demand patterns, while pressure persists for lower‑income cohorts; advertising/membership mix is a structural margin of support.
- Hilton’s 2026 RevPAR outlook below expectations fits a broader travel message: premium demand holds up, but budget travelers remain more sensitive.
Energy prices and geopolitical/fiscal uncertainty (Energy).
- Integrated oils continue to highlight production and efficiency, but earnings remain exposed to the commodity price path.
Credit and spread dynamics (Financials/ratings).
- Moody’s beat and its EPS range guidance reinforce that structured issuance and macro conditions can be supportive, but forward credit-cycle risk remains a watch point if growth or liquidity deteriorates.
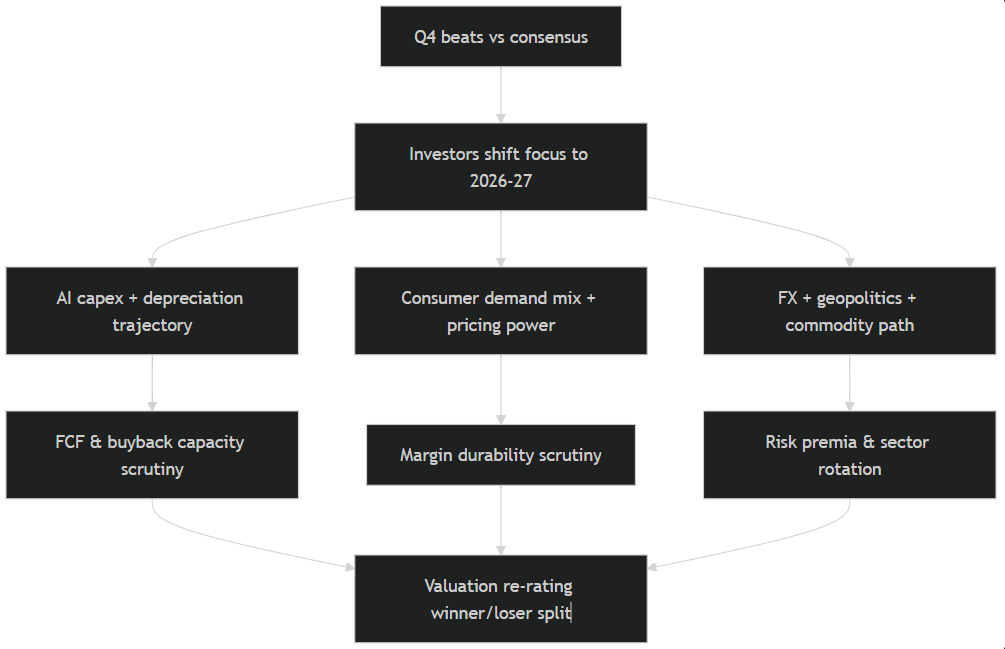
A compact flow diagram of what’s driving guidance sensitivity
Market sentiment, investor reaction, and forward expectations
“Beat rates” stayed strong, but the market’s reward function changed
While aggregate beat rates are healthy, the market reaction has increasingly reflected (1) valuation starting point, (2) capex duration, (3) guidance conservatism vs Street expectations.
- Mega-cap tech has seen valuation pressure tied to concerns over AI returns and spending scale; Reuters highlighted material market‑cap losses tied to investor unease about the profitability of heavy AI investment.
- Conversely, sectors like Energy have periodically led on days when macro narratives favored cash‑flow durability, and single‑name reactions (e.g., Verizon) show that operational KPIs + capital return frameworks can still generate sharp positive moves.
How is this reshaping forward expectations
Base case implied by the season:
- Earnings growth remains solid (S&P 500 blended earnings growth ~13% YoY), and Nasdaq‑100 net income is tracking mid‑teens growth, but the market is demanding a clearer bridge from AI spend → monetization.
- In the consumer market, the likely market “winners” are those with structural margin levers (ads, memberships, logistics, higher‑frequency categories) and resilient value propositions, even if guidance is conservative.
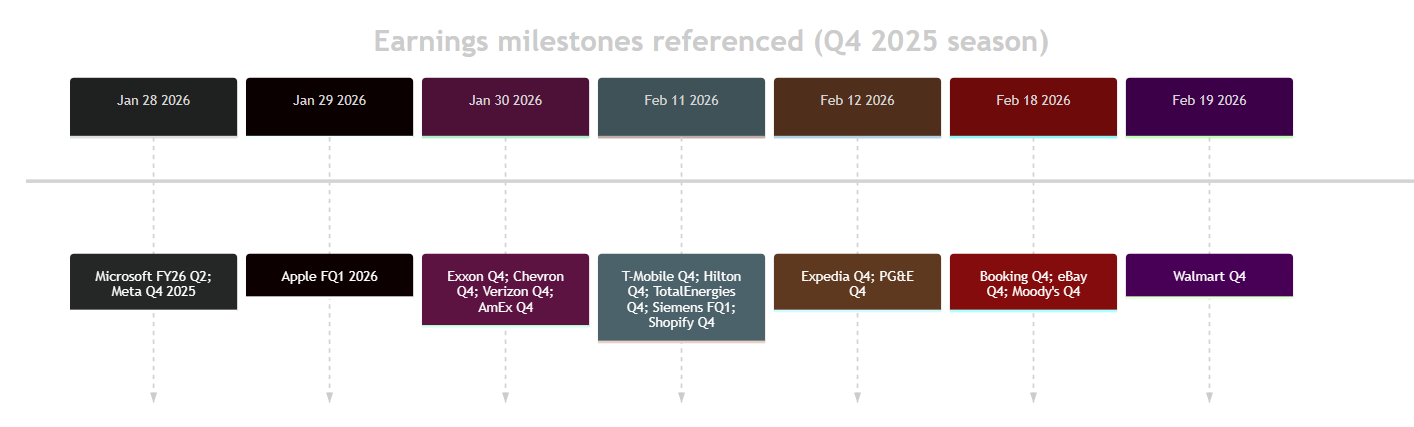
A quick timeline of major reports cited
Methodology and limitations
This report uses a two‑layer approach:
- Top‑down aggregates: S&P 500 sector beat rates and growth come from FactSet’s weekly earnings update as of Feb 13, 2026; Nasdaq‑100 aggregates come from Nasdaq Global Indexes’s earnings update (data as of Feb 11, 2026).
- Bottom‑up examples: Company‑level “actual vs consensus” figures are taken from combinations of issuer press releases, major-wire recaps (frequently Reuters/FactSet or Reuters/LSEG), and reputable earnings recaps where consensus is explicitly stated. Each row includes a citation trail.
Dow 30 limitations:
A free, comprehensive, Dow‑only “beat/miss” scoreboard with consistent consensus sourcing was not available in the public sources used. Therefore, the Dow table provides reporting progress only, inferred from the remaining late reporter (Home Depot scheduled Feb 24), rather than a full beat/miss computation across all Dow constituents.
Consensus-provider inconsistency:
Consensus estimates vary across providers (FactSet, LSEG, Zacks, etc.) and between GAAP vs non‑GAAP definitions. Where multiple definitions exist (notably software/commerce firms), the table anchors to the estimate explicitly cited in the linked source and flags the measure as adjusted/non‑GAAP when relevant.
Comments