 English
 پارسی



Speculators Rotate Into Corn, Wheat, CAD and AUD as Nasdaq Turns Net Short
The latest CFTC speculative net-positioning report shows a decisive shift in market sentiment across currencies, equity futures, metals, energy and agricultural commodities. The strongest flows were concentrated in corn, wheat, CAD and AUD, while the largest reductions appeared in soybeans, Nasdaq-100 futures, GBP, JPY and EUR.
The Commodity Futures Trading Commission’s Commitments of Traders report is designed to show how futures and options open interest is distributed across trader categories. The CFTC says the report provides a breakdown of each Tuesday’s open interest in futures and options markets where enough reportable traders meet the threshold, and the report is generally released on Friday using Tuesday’s data.
This matters because speculative positioning does not simply show where prices are today. It shows where leveraged traders are building conviction, reducing risk, taking profit or preparing for a possible directional move. In this report, the signal is clear: traders are becoming more constructive on grains and commodity-linked currencies, less comfortable with tech-heavy equity exposure, and still cautious on several major currencies against the U.S. dollar.
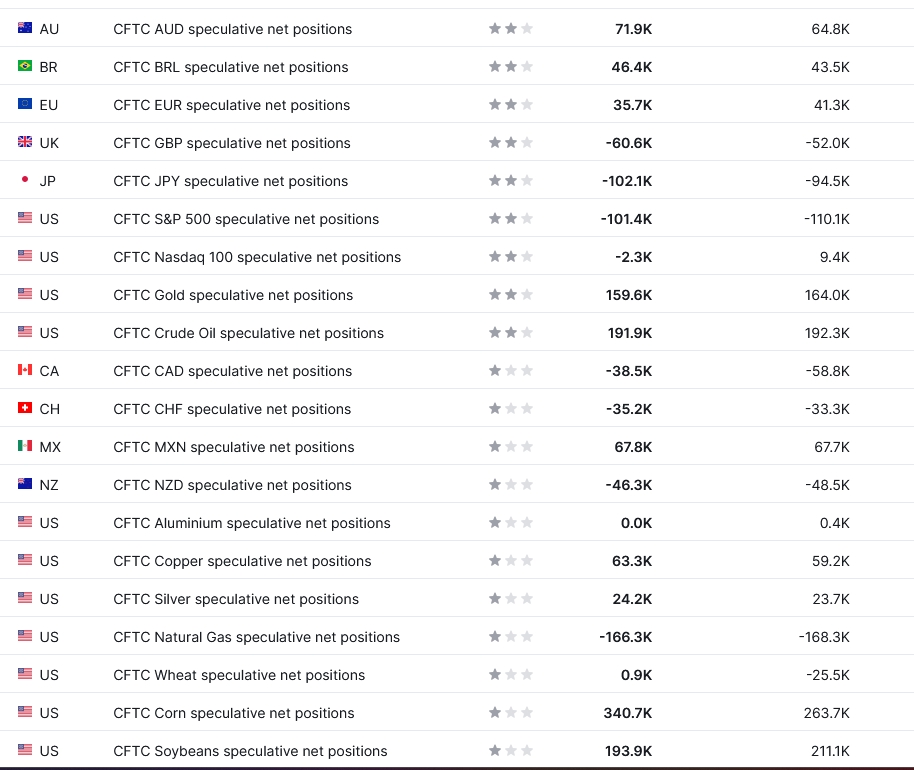
Biggest Positioning Changes in the Latest CFTC Report
The largest positive change came from corn, where speculative net positions rose to 340.7K from 263.7K, a weekly increase of about 77K contracts. This was the strongest change across the full report and shows aggressive long accumulation. Corn was already trading near 467.26 USd/BU on May 1, 2026, up 0.54% on the day, with the latest market narrative supported by higher input costs, strong export demand and weather risk across parts of the U.S. corn belt.
The second most important shift was in wheat, where speculative positioning moved from a net-short of -25.5K to a slight net-long of 0.9K, a positive weekly change of about 26.4K contracts. This is not just a reduction in bearish exposure; it is a full sentiment flip from net-short to net-long. Wheat was trading near 626.75 USd/Bu on May 1, 2026, up 0.48%, with the broader backdrop shaped by weak winter wheat conditions, drought exposure and slower spring wheat planting.
The Canadian dollar also saw a major improvement. CAD speculative net positioning moved to -38.5K from -58.8K, meaning traders cut bearish CAD exposure by about 20.3K contracts. The position remains net-short, but the direction of change is constructive. USD/CAD was around 1.3581 on May 1, 2026, and the Canadian dollar had strengthened 2.43% over the previous month.
The biggest negative change came from soybeans, where net longs fell to 193.9K from 211.1K, a decline of about 17.2K contracts. Speculators remain heavily net-long soybeans, but the reduction signals profit-taking or lower conviction. Soybeans were still elevated near 1,187 USd/Bu on May 1, 2026, supported by biofuel demand, Argentine harvest delays and weather uncertainty, but the positioning data shows traders were less willing to expand long exposure at these levels.
The Nasdaq-100 also delivered an important risk signal. Speculative positioning moved from +9.4K net-long to -2.3K net-short, a negative shift of about 11.7K contracts. This means traders flipped from mild long exposure to mild short exposure, despite the Nasdaq-100 closing at 27,710.36 on May 1, 2026, up 0.94% on the day.
Currencies: Commodity FX Improves, Europe and Japan Weaken
The Australian dollar strengthened as a positioning story. AUD speculative net longs rose to 71.9K from 64.8K, a positive change of around 7.1K contracts. AUD/USD was near 0.7183 on May 1, 2026, while the broader AUD cross table showed AUD/USD around 0.7198 on the same date. This positioning supports the view that traders are using the Australian dollar as a commodity and China-sensitive expression, especially while industrial metals and risk appetite remain supported.
The Brazilian real remained in positive territory. BRL speculative net positions rose to 46.4K from 43.5K, a weekly increase of about 2.9K contracts. USD/BRL was near 4.9563 on May 1, 2026, and the Brazilian real had strengthened 3.91% over the previous month. The CFTC positioning shows that traders remain constructive on BRL, although the weekly change was smaller than the moves in CAD, AUD, corn and wheat.
The euro weakened as a positioning signal. EUR speculative net longs fell to 35.7K from 41.3K, a decline of about 5.6K contracts. EUR/USD traded near 1.1717 on May 1, 2026, down 0.09% on the session. The euro remains net-long in the CFTC data, but the loss of long exposure shows that traders are becoming more cautious on the currency after its previous strength.
The British pound showed a clear deterioration. GBP speculative net positions moved deeper into negative territory, falling to -60.6K from -52.0K, a bearish weekly change of about 8.6K contracts. GBP/USD was near 1.3568 on May 1, 2026, down 0.15% on the day. The CFTC data suggests that speculative traders are still treating sterling as vulnerable, likely because of concerns around growth, policy uncertainty and the relative appeal of the U.S. dollar.
The Japanese yen remained one of the clearest bearish FX positions. JPY speculative net positions fell to -102.1K from -94.5K, a negative weekly change of about 7.6K contracts. USD/JPY was near 156.8810 on May 1, 2026, after the yen had recently traded near politically sensitive levels. The position is deeply net-short, which confirms that speculative traders still see the yen under pressure, although the risk of Japanese intervention makes this one of the more dangerous consensus trades.
The Swiss franc also stayed under pressure. CHF speculative net positioning moved to -35.2K from -33.3K, a negative change of about 1.9K contracts. USD/CHF was near 0.7815 on May 1, 2026. The CFTC data shows that traders modestly increased bearish CHF exposure, keeping the franc in the same weak-positioning group as JPY and GBP.
The Mexican peso remained one of the strongest speculative long positions, but the weekly change was almost flat. MXN speculative net positions were 67.8K, barely above the previous 67.7K, a change of only 0.1K contracts. USD/MXN was around 17.4482 on May 1, 2026, and the peso had strengthened 2.40% over the previous month. The message is that traders are still bullish MXN, but fresh long accumulation has slowed.
The New Zealand dollar improved slightly but remained net-short. NZD speculative net positions moved to -46.3K from -48.5K, a positive weekly change of about 2.2K contracts. NZD/USD was near 0.5889 on May 1, 2026, down 0.33% on the session. The kiwi is still structurally weaker than AUD in positioning terms, which supports relative-value strategies that favor AUD over NZD.
Equity Futures: S&P Shorts Trimmed, Nasdaq Turns Net Short
The S&P 500 position improved but remained net-short. Speculative net positions moved to -101.4K from -110.1K, a positive weekly change of around 8.7K contracts. This means traders reduced bearish exposure, but they did not move into net-long territory. The S&P 500 closed at 7,230.12 on May 1, 2026, with FRED showing that level as the daily close.
The Nasdaq-100 was more concerning from a positioning perspective. Net positions moved to -2.3K from +9.4K, a negative shift of about 11.7K contracts. The index closed at 27,710.36 on May 1, 2026, with the same data showing an open of 27,508.57, a high of 27,787.12, a low of 27,501.43 and a daily gain of 0.94%. The positioning flip suggests that traders are not necessarily bearish on all U.S. equities, but they are becoming more cautious on tech-heavy exposure.
This creates an important market divergence. The S&P 500 is still net-short but improving, while Nasdaq-100 futures have moved from net-long to slightly net-short. For traders, this supports the idea of a broad equity exposure with a technology hedge rather than an outright all-in long equity position.
Metals: Gold Longs Trimmed, Copper and Silver Improve
Gold speculative net positions fell to 159.6K from 164.0K, a decline of about 4.4K contracts. This is not a bearish reversal, because the market remains heavily net-long, but it does show profit-taking. Gold traded around 4,612.50 USD/t.oz on May 1, 2026, down 0.22% on the day, while still up 42.39% from a year earlier.
Silver speculative net positions rose slightly to 24.2K from 23.7K, a positive change of about 0.5K contracts. Silver traded around 75.16 USD/t.oz on May 1, 2026, up 1.98% on the day and 134.84% year over year. The combination of modestly higher speculative length and a strong price trend keeps silver in a constructive but volatile category.
Copper speculative net positions increased to 63.3K from 59.2K, a positive change of about 4.1K contracts. Copper traded around 5.91 USD/lb on May 1, 2026, down 0.20% on the day but up 6.31% over the previous month. The positioning increase suggests that traders continue to see copper as a structural industrial-demand and electrification trade, even though elevated prices may limit near-term upside.
Aluminium speculative net positions moved to 0.0K from 0.4K, a small decline of about 0.4K contracts. The position is essentially neutral. Aluminium traded around 3,518.40 USD/T on May 1, 2026, up 1.00% on the day and 44.17% year over year. The price backdrop remains supported by supply-chain concerns and higher energy costs, but speculative positioning is not yet showing strong conviction.
Energy: Oil Longs Stay High, Natural Gas Shorts Remain Extreme
Crude oil speculative net positions were almost unchanged at 191.9K, compared with 192.3K in the previous report, a small decline of about 0.4K contracts. The market remains heavily net-long crude oil. WTI crude traded around 102.50 USD/bbl on May 1, 2026, down 2.45% on the day, while the broader price board showed crude around 101.94 and Brent near 108.17 on the same date.
The crude oil positioning is important because the market is not showing major long liquidation despite price volatility. Speculators still appear to see oil as supported by geopolitical risk and supply disruption, but the lack of new long accumulation also suggests that the trade is already crowded.
Natural gas speculative net positions improved slightly to -166.3K from -168.3K, a positive change of about 2.0K contracts. Even after that improvement, the position remains extremely net-short. Natural gas traded around 2.79 USD/MMBtu on May 1, 2026, up 0.80% on the day, while still down 23.17% year over year.
This is one of the more interesting contrarian setups in the report. The market remains fundamentally challenged by supply and inventory dynamics, but extreme net-short positioning means any weather shock, production disruption or LNG-demand surprise could force short covering.
Agriculture: Corn and Wheat Lead, Soybeans Lose Momentum
Agriculture was the most important theme in the report. Corn, wheat and soybeans all remained major speculative markets, but the direction of flow was very different.
Corn was the clear leader, with net positions rising to 340.7K from 263.7K, an increase of about 77K contracts. That is a major bullish flow and the largest change in the entire report. Corn traded near 467.26 USd/BU on May 1, 2026, supported by energy costs, fertilizer costs, export demand and weather uncertainty.
Wheat also improved sharply, moving from -25.5K net-short to 0.9K net-long, a positive change of about 26.4K contracts. Wheat traded near 626.75 USd/Bu on May 1, 2026, with market attention focused on drought, crop ratings and planting progress.
Soybeans remained heavily net-long but lost momentum. Net positions fell to 193.9K from 211.1K, a negative change of about 17.2K contracts. Soybeans traded around 1,187 USd/Bu on May 1, 2026. The key message is that speculative traders are not abandoning soybeans, but they are reducing exposure while rotating more aggressively into corn and wheat.
What the CFTC Positioning Says About Market Sentiment
The first message is that commodity inflation risk is still alive. Strong increases in corn and wheat positions show that speculators are preparing for tighter agricultural supply or stronger price momentum. This is important for macro investors because food and energy prices can directly affect inflation expectations, central-bank decisions and consumer purchasing power.
The second message is that commodity-linked currencies are gaining support. AUD net longs increased, CAD shorts were reduced sharply, BRL longs rose and MXN longs stayed high. This positioning profile is consistent with an environment where traders still see value in currencies linked to commodities, carry or resilient external balances.
The third message is that the U.S. dollar is still favored against weak funding or low-growth currencies. JPY shorts increased, GBP shorts increased, CHF shorts increased and EUR longs were cut. That does not mean the dollar will rise in a straight line, but it shows that traders are still expressing relative confidence in the dollar versus yen, sterling, Swiss franc and, to a lesser extent, euro.
The fourth message is that U.S. equities are not uniformly bearish, but tech positioning has weakened. S&P 500 shorts were reduced, but Nasdaq-100 positioning flipped from net-long to slightly net-short. This is a rotation signal: traders are not necessarily exiting the U.S. equity market, but they are becoming more selective.
The fifth message is that precious metals remain structurally supported, but gold saw profit-taking. Gold longs fell modestly but stayed high, while silver longs rose slightly. This suggests that investors still value metals as inflation and geopolitical hedges, but gold may need fresh catalysts after its large rally.
Trading and Investing Ideas Based on the CFTC Report
1. Long AUD/USD or Short USD/CAD as a Commodity-Currency Trade
The CFTC data supports a constructive view on commodity currencies. AUD net longs rose to 71.9K from 64.8K, while CAD net shorts narrowed to -38.5K from -58.8K. AUD/USD was near 0.7183 on May 1, 2026, while USD/CAD was around 1.3581.
A practical strategy is to stay selectively long AUD/USD or short USD/CAD while commodities remain firm. AUD benefits from industrial metals and China-sensitive risk appetite, while CAD benefits from oil. The main risk is a sudden drop in oil or copper, a broad risk-off move, or a renewed rise in U.S. yields that lifts the dollar.
2. Long Corn With Protective Stops
Corn delivered the strongest positioning change in the report, with net speculative longs rising by about 77K contracts to 340.7K. That makes corn the cleanest momentum signal in the data. Corn was trading near 467.26 USd/BU on May 1, 2026.
A long corn position can be expressed through futures, options or agriculture ETFs, depending on risk tolerance. The key bullish drivers are strong speculative accumulation, higher input costs, export demand and weather uncertainty. The main risk is that the position is already becoming crowded. A favorable crop update or weaker demand could trigger a sharp correction.
3. Long Wheat After the Short-to-Long Flip
Wheat moved from -25.5K net-short to 0.9K net-long, a positive shift of 26.4K contracts. This is one of the most meaningful changes because the market crossed from bearish positioning into positive territory. Wheat was trading around 626.75 USd/Bu on May 1, 2026.
The trade idea is to buy wheat on pullbacks while crop conditions remain fragile. The risk is that the new net-long position is still small, so momentum needs follow-through. If weather improves or supply concerns ease, the bullish case weakens quickly.
4. Pair Trade: Long Wheat vs. Short Soybeans
The relative positioning between wheat and soybeans is important. Wheat improved by 26.4K contracts, while soybean longs fell by 17.2K contracts. Soybeans remain heavily net-long at 193.9K, but the direction of travel is negative. Soybeans were trading around 1,187 USd/Bu on May 1, 2026.
A relative-value trade could be long wheat and short soybeans. The idea is not simply that wheat must rise and soybeans must fall. The cleaner argument is that wheat may outperform soybeans if traders continue rotating into wheat while reducing soybean exposure. The main risk is that a broad agricultural supply shock lifts all grains together.
5. Stay Long Broad U.S. Equities but Hedge Nasdaq Risk
The S&P 500 position improved from -110.1K to -101.4K, while the Nasdaq-100 flipped from +9.4K to -2.3K. The S&P 500 closed at 7,230.12 on May 1, 2026, while Nasdaq-100 closed at 27,710.36.
This setup favors a barbell equity approach. Investors who want U.S. equity exposure can hold broad S&P 500 exposure while hedging part of the position with Nasdaq-100 puts or a partial short in tech-heavy exposure. The idea is to participate in broad-market strength while protecting against a valuation or earnings-driven correction in technology.
6. Short EUR/USD and GBP/USD on Positioning Deterioration
EUR net longs fell to 35.7K from 41.3K, while GBP shorts deepened to -60.6K from -52.0K. EUR/USD traded near 1.1717 and GBP/USD near 1.3568 on May 1, 2026.
The trade idea is to sell EUR/USD toward a retest of 1.15 and GBP/USD toward 1.33, using recent highs as risk-management levels. This is a dollar-strength trade, but the risk is clear: a dovish Federal Reserve shift, stronger European or U.K. data, or aggressive Japanese FX intervention could weaken the dollar and invalidate the setup.
7. Watch USD/JPY Carefully: Bearish Yen Positioning Is Crowded
JPY speculative net positioning fell further to -102.1K from -94.5K, and USD/JPY traded near 156.8810 on May 1, 2026.
The direction of positioning supports USD/JPY upside, but the trade is crowded and politically sensitive. Long USD/JPY may still work if U.S.–Japan rate differentials remain wide, but the risk of official intervention makes this a position that requires tight stops, reduced size or option-defined risk.
8. Buy Gold and Silver on Dips, Not Breakouts
Gold net longs declined to 159.6K from 164.0K, while silver net longs rose slightly to 24.2K from 23.7K. Gold traded near 4,612.50 USD/t.oz, and silver traded near 75.16 USD/t.oz on May 1, 2026.
The positioning data does not argue for abandoning precious metals. It argues for patience. Gold is still heavily owned, so buying breakouts may carry poor risk-reward. Buying dips in gold or silver remains more attractive for investors looking for inflation protection, geopolitical hedging and portfolio diversification.
9. Natural Gas as a Contrarian Short-Covering Trade
Natural gas remains one of the most extreme net-short positions in the report at -166.3K, only slightly better than the previous -168.3K. Natural gas traded near 2.79 USD/MMBtu on May 1, 2026.
This is not a clean fundamental bull market yet, but it is a possible short-covering setup. A hot weather forecast, production cut, LNG export surprise or storage shift could force speculative shorts to cover. This is a higher-risk tactical trade, not a core investment idea.
Risk Management and How to Use the CFTC Data
CFTC positioning is powerful, but it is not a timing tool by itself. The report reflects data from Tuesday and is usually released Friday, which means the market may already have moved by the time traders react. The CFTC also states that it publishes the data based on information received from reporting entities and does not analyze it or make recommendations.
The best use of this report is to combine positioning with price action, macro catalysts and risk management. A strong positioning signal is more useful when it confirms price momentum, valuation, central-bank expectations or commodity fundamentals. A crowded position becomes dangerous when price stops confirming the positioning story.
For this report, the strongest actionable themes are long corn, long wheat, commodity-currency strength, selective dollar strength against GBP and EUR, cautious equity exposure with Nasdaq hedges, and watching natural gas for a short-covering rally.
FAQ
What was the biggest change in the latest CFTC report?
The biggest change was in corn, where speculative net positions rose to 340.7K from 263.7K, a weekly increase of about 77K contracts. This was the strongest positioning move across the full report.
Did wheat positioning turn bullish?
Yes. Wheat moved from -25.5K net-short to 0.9K net-long, a positive shift of about 26.4K contracts. This was a full change from bearish to slightly bullish speculative positioning.
What happened to Nasdaq-100 positioning?
Nasdaq-100 speculative positioning flipped from +9.4K net-long to -2.3K net-short, a negative change of about 11.7K contracts. This suggests traders became more cautious on tech-heavy equity exposure.
Are traders still bullish on gold?
Yes, but less aggressively than before. Gold speculative net positions fell to 159.6K from 164.0K, showing profit-taking, while the market still remains heavily net-long.
Which currencies look strongest in the CFTC report?
The strongest currency signals are in AUD, CAD, BRL and MXN. AUD longs increased, CAD shorts were reduced sharply, BRL longs rose, and MXN longs remained high and stable.
Which currencies look weakest?
The weakest positioning signals are in JPY, GBP and CHF. JPY net shorts increased to -102.1K, GBP shorts deepened to -60.6K, and CHF shorts widened to -35.2K.
What is the best trade idea from the report?
The cleanest positioning idea is long corn, because corn had the largest positive change in the report. The second strongest is long wheat, because wheat shifted from net-short to slightly net-long. For FX, the strongest setup is selective commodity-currency strength through AUD/USD upside or USD/CAD downside.
Is this report investment advice?
No. The analysis is for market research and education. CFTC positioning can help identify sentiment and crowded trades, but all trading and investing decisions require independent risk management, position sizing and consideration of personal financial objectives.
Comments