 English
 پارسی



Executive Summary
The latest CFTC Commitments of Traders (COT) data (as of Mar 13, 2026) show notably extreme speculative positioning across multiple asset classes. Speculators are heavily net long crude oil (228.0K contracts) and U.S. corn (257.8K) while also holding sizable net longs in gold (163.1K) and soybeans (230.3K). Major currencies display mixed bets: for example, AUD, BRL, EUR, and CAD are net long, whereas GBP, JPY, CHF, and NZD are net short. In equities, large speculators are net short the S&P 500 (–134.5K) but recently became mildly net long the Nasdaq (24.9K). These positions are in many cases at or near multiyear extremes, suggesting potential contrarian signals. We analyze each market’s positioning, recent shifts, fundamental drivers, and risk factors, then propose a prioritized set of trading ideas (with entries, stops, targets, and risk management) reflecting both the COT-derived sentiment and price/macro context.
Tabulated COT Net Positions
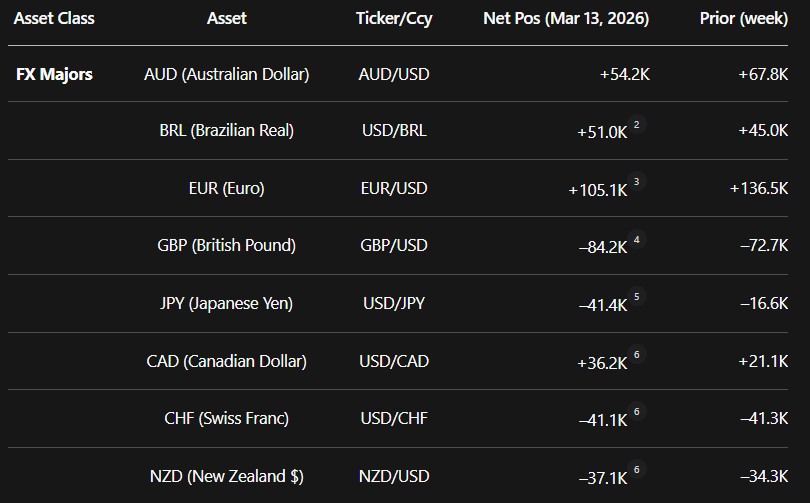
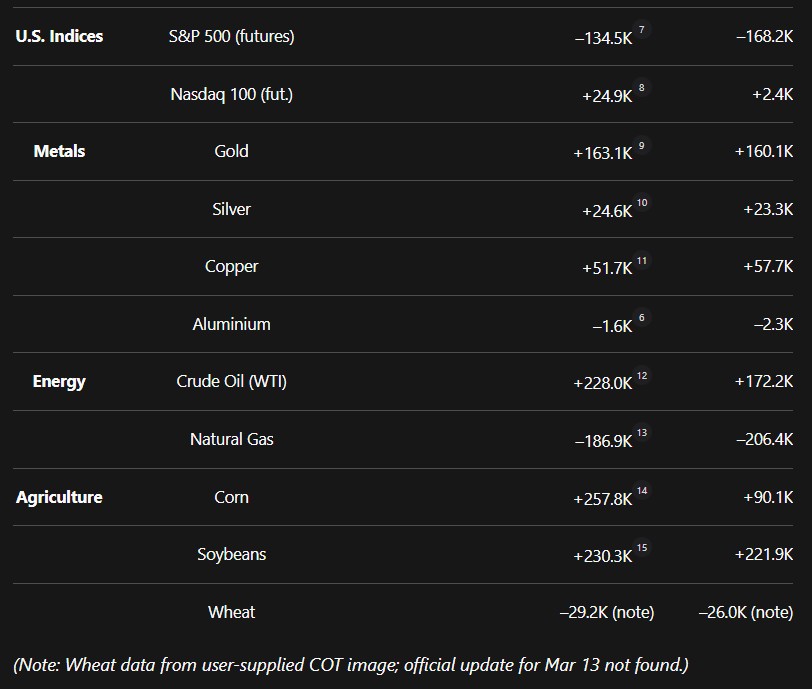
The table below extracts the net speculator positions (current vs. prior week).
Analysis by Asset Class
Major Currencies (AUD, BRL, EUR, GBP, JPY, CAD, CHF, NZD)
- AUD (USD/AUD): Speculators are net long 54.2K contracts, down from 67.8K last week. While long positions remain significant, the decline suggests some profit-taking or caution. The Aussie recently traded near three-year highs (~0.71 USD) on expectations that the RBA will raise rates to combat inflation. COT longs are high historically, indicating bullish sentiment but also vulnerability to a pullback.
Interpretation: Large net long AUD is generally a bullish signal for AUD/USD, but extreme long positioning can act as a contrarian warning.
Risks: A sudden global risk-off move (e.g., escalated geopolitical tensions) could send AUD plunging. RBA or Fed policy surprises could also reverse momentum.
- BRL (USD/BRL): Net long 51.0K versus 45.0K prior. Speculators have added to bullish Brazilian Real bets. Rising commodity prices (e.g., oil, metals) tend to support Brazil’s export-driven economy. Recent Copom (Brazil Fed) minutes and fiscal developments could influence BRL. A strong BRL rally might be vulnerable to profit-taking, since BRL often spikes on commodity booms.
Interpretation: Continued net long BRL aligns with a commodity-driven uptrend, but any pullback in commodities or risk appetite could hurt BRL.
- EUR (EUR/USD): Net long 105.1K, down from 136.5K. EUR longs remain sizable but have moderated. The euro is near multi-month highs amid hopes of European rate hikes and USD weakness. Still, U.S. rate relief expectations limit EUR strength.
Interpretation: Heavy EUR longs signal bullish sentiment (confirming trend), yet any sign of Fed hesitancy to cut or renewed risk-off could force unwinding.
- GBP (GBP/USD): Net short 84.2K, up in magnitude from –72.7K. Speculators have flipped more negative on sterling. The pound has recently weakened on slowing UK growth and a dovish BoE outlook, even as UK inflation nears the target.
Interpretation: The large net short suggests market bias for further GBP weakness (in line with the trend). Contrarian traders might view it as a potential setup if Brexit or UK political news turns hawkish. Key drivers include UK inflation prints, BoE guidance, and Brexit headlines.
- JPY (USD/JPY): Net short 41.4K (more bearish on JPY) vs –16.6K prior, meaning speculators significantly bought USD/JPY. The yen has weakened on widening rate differentials and safe-haven flows (recent Middle East tensions ironically broke Yen support).
Interpretation: Extreme net short JPY (net long USD/JPY) signals risk of reversal if something spooks markets (yen often benefits from safe-haven demand). However, sustained U.S. hawkishness and the BoJ’s ultra-easy policy keep USD/JPY elevated.
Risks: Any unexpected BoJ tightening or a sudden global panic could rally JPY sharply.
- CAD (USD/CAD): Net long 36.2K, from 21.1K. Speculators are modestly bullish CAD (short USD/CAD) on higher oil prices and expectations of a Bank of Canada rate hike.
Interpretation: CAD longs likely confirm the commodity-led uptrend. A further oil rally or BoC surprises could strengthen CAD; conversely, weak commodities or dovish BoC minutes could trigger a setback.
- CHF (USD/CHF): Net short 41.1K, essentially unchanged. Heavy CHF longs reflect safe-haven demand (traders buying CHF) amid global uncertainty. The Swiss franc has strengthened due to global risk aversion.
Interpretation: Large CHF long positions are typical in unsettled times, confirming its safe-haven role. A sudden easing of tensions or European stability could unwind CHF longs.
- NZD (NZD/USD): Net short 37.1K vs –34.3K prior. Speculators remain bearish NZD (fundamentals: RBNZ possibly nearing peak rates, global growth slowdown).
Interpretation: Modest net short NZD suggests expectation of further NZD weakness. However, NZD is also commodity-linked (dairy, metals), so a commodity rally could lift it.
Summary FX: The overall picture is mixed. Commodity currencies (AUD, BRL, CAD) are net long, reflecting strong commodities and hawkish home central banks. Safe-havens (CHF, JPY) are net long by speculators (i.e., net short USD), consistent with global uncertainties. EUR remains net long but has eased, and GBP is notably net short. In general, extreme net positions (especially AUD and USD/JPY) warrant caution, even though they confirm recent trends. Key macro risks include central bank decisions (RBA, Fed, BoE, BoC), commodity price swings, and geopolitical shocks.
U.S. Equity Indices (S&P 500, Nasdaq 100)
- S&P 500: Net short 134.5K, reduced from –168.2K. Speculators remain heavily bearish on S&P futures despite the index hovering near record highs (around 6630 on Mar 13). This large net-short is at multiyear extremes, implying caution. The recent reduction in shorts suggests some buy-the-dip behavior.
Interpretation: According to sentiment theory, such extreme net shorts could signal a contrarian bullish setup if fundamental news is favorable. However, given stretched valuations and rising bond yields, speculators may be positioned for a correction. Key drivers include Fed policy path, corporate earnings, and inflation data.
- Nasdaq 100: Net long 24.9K, up sharply from just 2.4K. Large speculators have turned net bullish on tech after recent pullbacks. This relatively small net long implies milder positioning than for the S&P.
Interpretation: The shift from flat to net long suggests renewed tech optimism (perhaps on AI/earnings hopes), but positioning is not yet extreme. Tech remains vulnerable to higher real yields and any risk-off that could hurt growth stocks.
Precious and Industrial Metals
- Gold: Net long 163.1K, roughly flat from 160.1K. This is a large long position historically (COT extremes), reflecting strong bullish sentiment. Gold traded around $5,060 on Mar 13. The bull case is underpinned by a weakening U.S. dollar and stabilizing yields, as well as unprecedented central bank accumulation. In fact, China and other central banks have been buying gold for reserves (16 straight months in China).
Interpretation: The massive net long suggests consensus bullishness. A contrarian might note that any sudden dollar rally or Fed hawkish surprise could be painful. For now, fundamentals (dovish Fed expectations, safe-haven demand, and central bank buying) support further gains.
- Silver: Net long 24.6K, slightly up from 23.3K. Silver’s net position is modest relative to gold. Silver has a dual role as an industrial and precious metal. Recently, it surged ~5% on USD weakness.
Interpretation: Silver’s smaller net long suggests less extreme sentiment. However, as [91] notes, silver’s outperformance vs gold can signal broader commodity/industrial demand. If the real economy recovers, silver’s bulls have a case.
- Copper: Net long 51.7K, down from 57.7K. Copper has positive fundamentals (electrification demand, infrastructure) and was near $5.75/lb. The pullback in longs is modest.
Interpretation: Moderate bullish stance; copper’s price is sensitive to China's demand and the US infrastructure.
- Aluminium: Net short 1.6K, slightly smaller short from –2.3K. Positioning is neutral/slightly bearish. Aluminium prices have been weak (glutted market).
Summary Metals: Precious metals (especially gold) show extremely bullish positioning consistent with macro drivers of a weak USD and strategic buying. Commodities like copper remain modestly long, while aluminium is neutral. A contrarian note: if commodity/cycle fears intensify, gold remains the crowd’s liquidity asset (as noted by forced ETF selling during the oil shock, [91]). Weighed against bullish fundamentals, it is more a confirmation of the trend than a contrarian sell signal at present.
Energies (Crude Oil, Natural Gas)
- Crude Oil (WTI): Net long 228.0K, up sharply from 172.2K. This is an extremely large long position (near historical highs), reflecting the recent oil price surge. Oil has spiked 30–40% on the Iran conflict and supply fears.
Interpretation: Heavy net longs confirm the bullish rally, but contrarian caution is warranted. Reuters notes traders expect any supply disruption to be short-lived (“market is anticipating a swift end”). If the Strait of Hormuz reopens or OPEC adjusts, oil could retreat. Still, for now bulls control the narrative.
- Natural Gas: Net short 186.9K, slightly reduced from 206.4K. Speculators are heavily short natural gas, though shorts have edged lower. NG prices were around $3.13/mmbtu (United States) on Mar 13. Winter-to-spring seasonal factors and U.S. storage levels tend to pressure gas prices.
Interpretation: The large short suggests bearish sentiment (in line with declining winter demand). A contrarian might look for a bounce if the weather turns colder. Geopolitics in Europe (e.g., gas flows from Russia) could also drive volatility.
Summary Energies: Speculators are extremely bullish on oil and bearish on gas. Oil’s price action (peaking on crisis news) matches the COT longs, but market opinion (as Reuters reports) cautions that this may be a short-term shock. Natural gas positioning reflects seasonal weakness. Macro risks include war developments (for oil) and weather/policy (for gas).
Agriculture (Corn, Soybeans, Wheat)
- Corn: Net long 257.8K, up massively from 90.1K. This is an exceptionally high long position. Corn futures recently jumped after strong U.S. export sales and a parallel rally in oil (impacting ethanol demand). May corn was trading at ~$4.50.
Interpretation: Strong bullish positioning and fundamentals (record export demand, rising energy prices) support higher corn. This is confirmatory of the rally. However, it also means a pullback could be sharp if forecasts turn overly bearish.
- Soybeans: Net long 230.3K, slightly higher than 221.9K. Soybean futures (~$12.25) have also rallied on oil and global food demand. Exports are weaker than corn, but domestic demand for biofuels and livestock feed is steady.
Interpretation: The large long suggests bullish sentiment and fits the oil-driven rally. Risks include South American harvest prospects and China's demand.
- Wheat: Net short 29.2K (vs –26.0K). Speculators are modestly bearish on wheat. U.S. wheat futures are near $5.75; prices have lagged corn/soy due to ample stocks. Weekly wheat export sales have been disappointing.
Interpretation: Modest net short aligns with oversupply concerns (as sold in the Brock Report). A contrarian might note that any crop issues or export shocks (e.g., Black Sea tensions) could quickly turn this view.
Summary Agriculture: Corn and soy show heavy bullish bets (supported by exports and oil prices), while wheat positioning is mildly bearish, reflecting ample supply. The fundamentals (high demand vs supply, weather outlook) largely confirm the positioning. However, agricultural markets are sensitive to weather and policy (ethanol mandates, crop reports).
Trade Ideas
Based on the above sentiment and price/macro context, we propose the following actionable trades (ranked by confidence):
- Short Gold Futures / ETF (e.g. GLD) – Rationale: Despite strong fundamentals, gold is at overbought levels (~$5,100) with speculators extremely long. A contrarian approach warns that further Fed rate-hike talk or USD strength could trigger a pullback. Entry: Around $5,100 (spot) with a tight stop just above $5,180 (recent high). Target: $4,800–$4,900 (psychological/support area). Risk: 1–2% account (per contract/position). Horizon: 2–4 weeks. Triggers: Watch U.S. data (CPI, PMI) and Fed minutes; any surprise hawkish tilt or USD bounce can fuel this short. Scenario: Bull case (gold rises) – break above $5,300 on escalation news; Bear case (gold falls) – if Fed signals delay in cuts, or a risk-on rally flushes out speculative longs.
- Long WTI Crude Oil Futures – Rationale: COT longs are extreme (228K) and risk is that prices correct, but technical momentum and OPEC cuts continue to support $100+ oil. Geopolitical tensions (Middle East) may outlast expectations. Entry: Near $98–$100 per barrel. Stop: $90 (below prior swing lows). Target: $115–$120 (recent highs and psychological level). Risk: 1–2%. Horizon: 1–2 months. Triggers: OPEC meetings, inventory reports, Iran tensions. Scenario: Bull – continued Middle East disruptions, tight inventories; Bear – quick diplomatic resolution or recession fears weaken demand (Reuters warns markets are pricing a short-term surge).
- Short Corn Futures/ETF (e.g., CORN) – Rationale: Corn positioning is extremely long (257.8K), suggesting crowd bullishness amid high prices (~$4.50). The rapid run-up may overextend. A cooling of ethanol demand or better crop weather could reverse recent gains. Entry: Around $4.50 per bushel. Stop: $4.65 (above resistance noted at $4.53–4.55). Target: $4.20–$4.30 (earlier support). Risk: 1%. Horizon: 2–4 weeks. Triggers: U.S. acreage reports, USDA supply updates, oil price drops (since corn tracks ethanol). Scenario: Bull – continued export demand and ethanol mandates keep prices high; Bear – normalization of oil or bumper crops shrinks demand, forcing longs to cover.
- Long USD/JPY (Short JPY) – Rationale: Speculators are net short JPY (net long USD/JPY) in large measure, yet fundamentals (ultra-loose BOJ vs Fed pause) still favor USD/JPY uptrend. We view current pullbacks (if any) as buying opportunities. Entry: ~135.50, on dips toward the 20-day moving average. Stop: below 134.00. Target: 138.00 (prior highs). Risk: 1% per position. Horizon: 1–3 months. Triggers: BoJ statements, Fed outlook, risk sentiment. Scenario: Bull – U.S. yields rise, or Japan intervenes less, sending JPY lower; Bear – any surprise BoJ hint of rate change or global panic (pushing JPY up), stop is hit.
- Long Silver Futures (or Silver ETF) – Rationale: Silver has room to run if tech/industrial demand stays robust. Its net-long position is still moderate, and silver just broke out of range with gold. With silver at ~$81 and high volatility, momentum is building. Entry: $82, on confirmation above the recent high. Stop: $78. Target: $90 (resistance). Risk: 1%. Horizon: 1–2 months. Triggers: Continued commodity/tech rally, solar/EV demand news. Scenario: Bull – macro stability returns, industrial cycle picks up; Bear – if Fed hikes more, demand slows, or if it simply catches a deeper pullback with gold.
- Short GBP/USD (Long USD) – Rationale: GBP is heavily net short, reflecting weak UK fundamentals. If U.S. data remains strong and the Fed stays ahead of the BoE, GBP could fall further. Entry: ~1.20 GBP/USD. Stop: 1.23. Target: 1.15. Risk: 1%. Horizon: 1–2 months. Triggers: UK CPI/recent inflation (if it drops faster, BoE cuts sooner), US labor/inflation data, UK political news. Scenario: Bull (GBP): UK data surprises hawkishly, or USD sells off, invalidating trade; Bear (GBP): BoE pivots to cuts or US continues to shine.
(Additional ideas could include long SPX (contrarian to spec shorts) or long CAD vs. USD, but we prioritize the above six.)
Risk Management & Scenarios
For each trade, a strict stop-loss (as noted) should be used to limit risk. Position sizing of ~1–2% of the account per trade is recommended. Traders should monitor key economic events (Fed meetings, employment reports, OPEC announcements, weather developments, etc.) that could trigger price moves.
- Bull Case / Bear Case (per trade): In each idea above, we outlined the scenarios. For example, the gold short assumes a return of USD strength or dovish Fed pause; if instead the Fed signals imminent cuts, gold’s bull case is triggered, and stops should clamp losses. Similarly, the oil long is predicated on supply tightness persisting – a sudden diplomatic resolution to the Iran conflict would fulfill the bear scenario (usable stop-loss).
- Portfolio Risk: No more than ~3–4 trades simultaneously to avoid overexposure. Trades are assumed to be uncorrelated (a gold short versus a crude long, etc.), but some may correlate (USD/JPY and USD trades). Diversification and adherence to individual stop levels help manage total drawdown.
Visual Aids
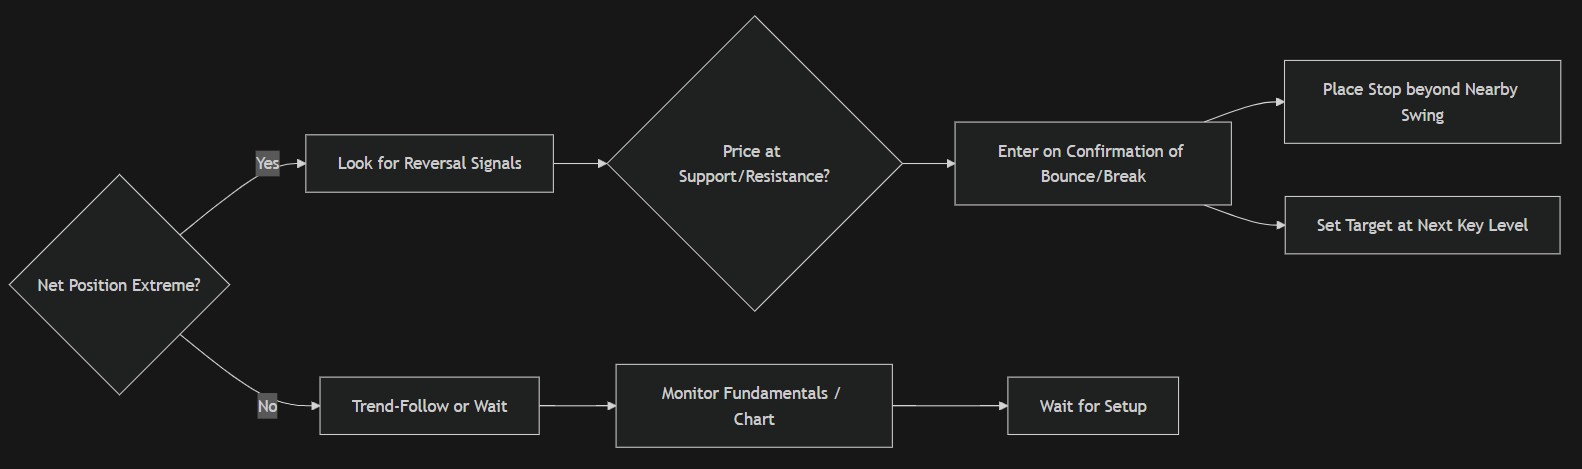
The above flowchart depicts a decision framework using COT data: if positioning is extreme, we look for contrarian setups (enter on price reversals); otherwise, we either follow the prevailing trend or stay patient. Key entries, stops, and targets are derived from chart levels and fundamental trigger points.
Sources: Official CFTC speculative net positions from Investing.com (see table citations). Sentiment interpretation and contrarian usage from NinjaTrader (Jan 2026). Fundamental context from recent market commentary and data: AUD/RBA, gold and metals, and oil/Iran conflict. All data and examples are as of mid-March 2026.
Comments