 English
 پارسی


Executive summary
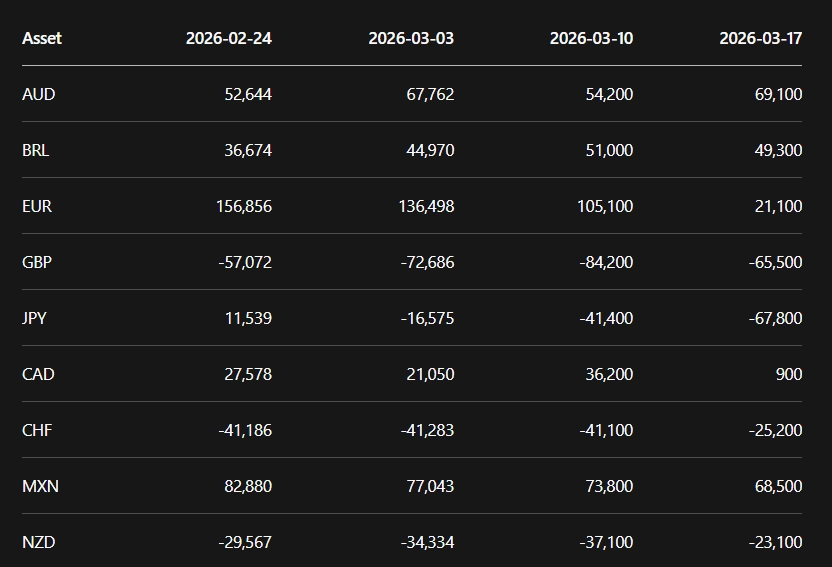
Positioning is strongly “risk/carry” in parts of FX, but with violent de-risking in EUR. AUD and MXN remain meaningfully net long, consistent with carry/risk-on preferences. By contrast, EUR speculative longs collapsed over the last four reporting weeks (from ~157k net long on Feb-24 to ~21k on Mar-17), a scale of unwind that often reflects deleveraging and/or a regime shift in relative-rate expectations.
JPY flipped from net long to deeply net short within three weeks. JPY went from modest net long (Feb-24) to large net short (Mar-17). That kind of directional reversal tends to increase “headline-beta” and squeeze risk (especially around risk-off events or a surprise from the Bank of Japan).
US equity index positioning is asymmetric: S&P 500 still net short, Nasdaq net long. The S&P 500 (E-mini) remains materially net short, even though bearishness has been reduced versus late February. Nasdaq-100 (Nasdaq mini) is modestly net long and stable week-over-week, implying a more supportive/speculative stance in growth/tech than in broad beta.
Commodities show crowded longs in oil and grains, and an extreme net short in natural gas. WTI crude oil is very large net long and still crowded. Corn and soybeans are also extremely net long on an absolute contract basis. The standout contrarian setup is natural gas: one of the largest net shorts in this snapshot, which historically can sharpen upside volatility when catalysts hit.
Data and methodology
CFTC “Futures Only” COT tables that report positions as of Tuesday and are typically released on Friday afternoon (ET).
Across all markets here, speculative net position is interpreted as:
This matches the CFTC tables (example: COMEX gold net ≈ 215,961 − 56,092 = 159,869 ≈ 159.9k).
Important comparability caveat: contracts are not comparable across assets (different contract sizes, notionals, volatilities). Cross-asset comparisons should be interpreted mainly by sign, direction, and trend, not magnitude alone.
Data in more detail
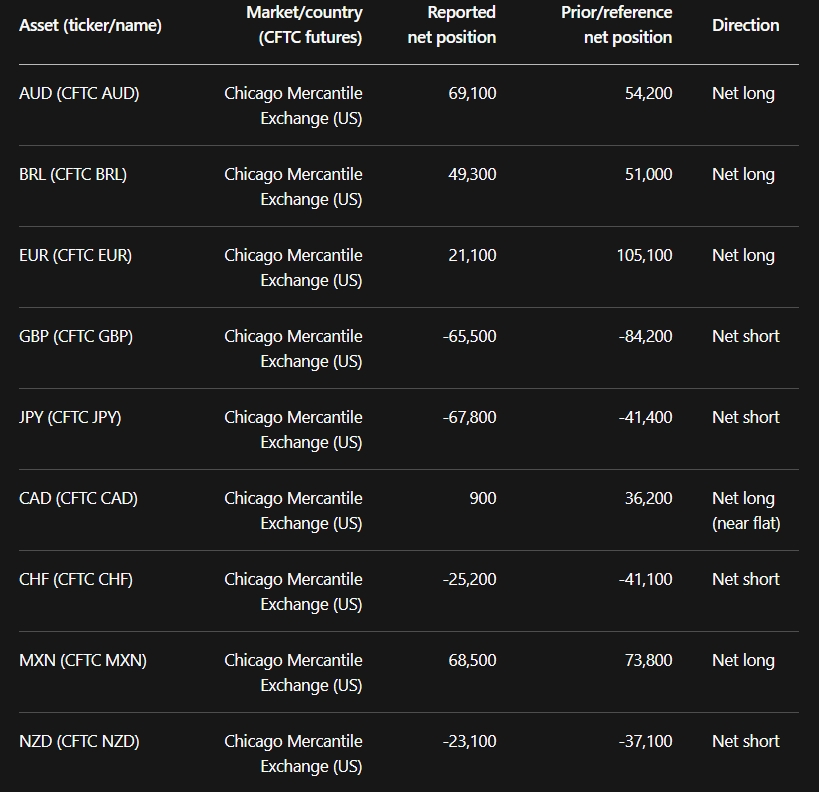
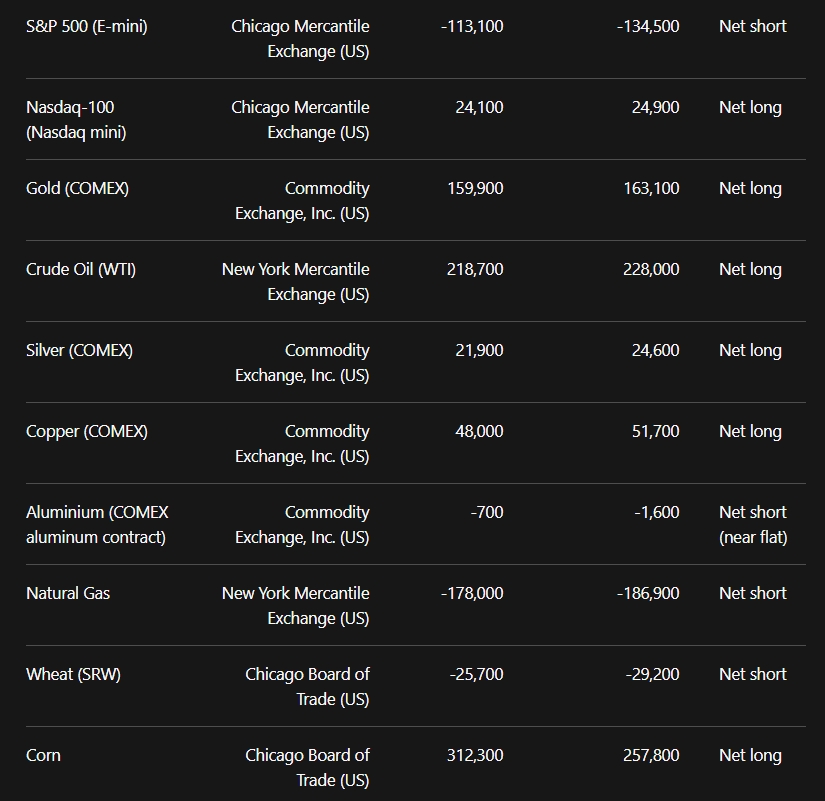
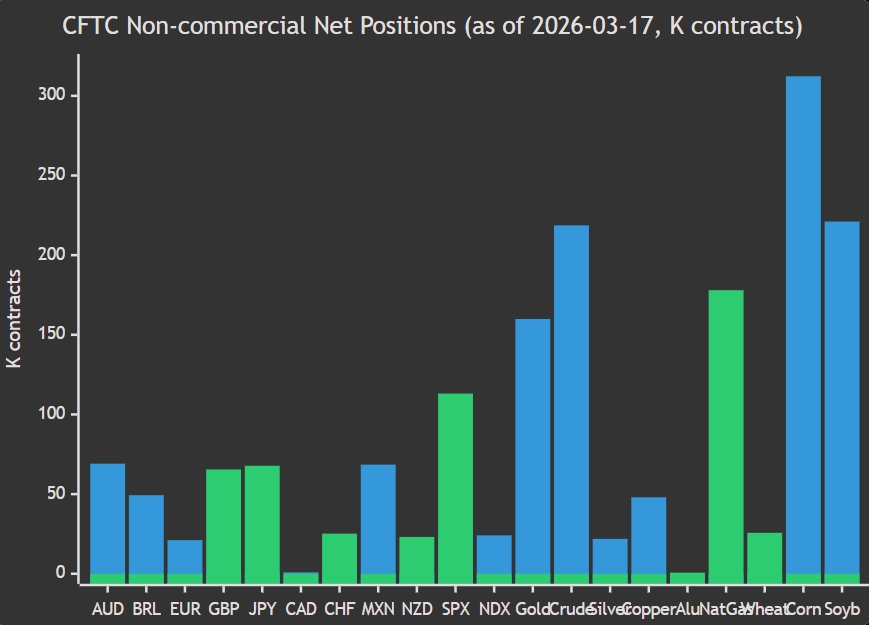
Comparative bar chart of current net positions
The chart below splits current positions into net-long contracts vs net-short contracts (absolute) for comparability with a single axis.
Positioning context, extremes, and market implications
Major FX positioning over the last four CFTC reports
For FX and US indices, the CFTC March 03, 2026 long report provides both the “All” positions for Mar-03 and the “Changes in Commitments from: Feb-24,” enabling reconstruction of the last four report dates: Feb-24 → Mar-03 → Mar-10 → Mar-17.
Last four reported net positions (contracts):
Interpretation by currency cluster:
AUD: net longs rebuilt and are rising again.
- The return to ~69k net long after a dip suggests persistent pro-carry sentiment. A practical implication is that AUD often becomes a “risk proxy”: if a macro shock hits, long-AUD positioning can unwind quickly.
BRL and MXN: still net long, but easing at the margin.
- Both remain clearly net long (carry/EM beta), but both have slipped versus late February. In practice, this reduces (but does not remove) vulnerability to a carry unwind.
EUR: positioning collapse is the dominant FX event.
- EUR went from a very large net long (~157k) to a small net long (~21k) in three weeks. This magnitude of liquidation often coincides with (a) a relative-rate repricing, (b) an “everything risk” de-leveraging, or (c) a sharp change in growth/inflation expectations. It also means EUR is less “crowded long” now, so downside continuation becomes more fundamentals-driven rather than purely positioning-driven.
JPY: sharp swing to net short increases squeeze sensitivity.
- JPY’s pivot from net long (Feb-24) to deeply net short (Mar-17) is a classic warning that the market is leaning in. In such regimes, any risk-off move or policy surprise can trigger fast short covering.
GBP and CHF: short covering is visible in the latest week.
- GBP net shorts became less negative (from -84k to -66k), and CHF net shorts also eased (from -41k to -25k). That pattern often aligns with a reduction in USD-demand hedges or a rise in safe-haven preferences.
CAD: a dramatic unwind to “flat.”
- CAD went from a meaningful net long to effectively neutral in one week. This typically implies uncertainty: CAD’s direction may be delegated to oil, domestic data, and relative rates rather than leveraged speculative flow.
US indices positioning over the last four CFTC reports
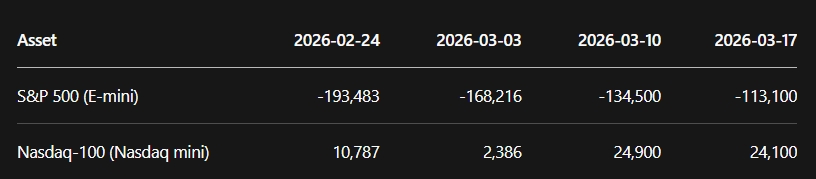
The S&P 500 remains meaningfully net short but has steadily reduced bearishness since late February. This is a classic setup where rallies can be mechanically reinforced by short covering, but also where downside catalysts (e.g., oil shocks) can reactivate hedging demand.
A contemporaneous macro risk cited by Reuters is that a severe oil supply disruption could pressure equities materially (illustrated via a Goldman Sachs scenario for the S&P 500). In positioning terms, an energy-driven risk-off shock can simultaneously (a) support crude longs, (b) stress broad equities, and (c) promote USD funding/safe-havens—exactly where the FX positioning is already skewed short JPY.
Nasdaq net long positioning is positive and stable week-over-week, implying that leveraged traders are more constructive on growth/tech exposure than on broad equity beta.
Commodities and agriculture
For commodities and agriculture, the current report is as of 03/17/26, and the screenshot includes the immediately prior week (03/10/26).
Key “extreme-like” readings in this cross-section:
WTI crude oil net long is very large (~219k contracts). When combined with an already-high price environment (WTI around $98.23/bbl), this suggests a market where bullish consensus is strong and performance is increasingly catalyst-driven.
Natural gas net short is very large (~178k). With natural gas around ~3.095 (NG futures proxy), this is a classic setup where upside spikes can be amplified by positioning if weather/storage headlines hit.
Gold net long remains high (~160k) and only slightly reduced. With gold futures around ~4,574.90, bullion still appears structurally supported, but heavy longs imply sensitivity to real-rate spikes or USD rallies.
Corn and soybeans are very large net longs (312k and 221k), while wheat is net short. That dispersion often indicates “relative-value” thinking within grains (corn/beans bullish narrative, wheat bearish narrative). It also raises the risk of crowded long liquidation in corn/beans if USDA/weather fundamentals disappoint.
Market-price correlations and likely implications
Price references below are taken from widely used public market-data pages (primarily Stooq and Investing.com) around the same period as the latest COT snapshot.
- EURUSD vs EUR positioning:
EURUSD is around ~1.157, while EUR net longs collapsed. This combination often looks like a distribution: price not collapsing immediately, but leveraged exposure being reduced. Market implication: if EURUSD breaks support after positioning has already been cut, follow-through can be faster because “dip buyers” are less crowded; conversely, if fundamentals improve, EUR has less “overhang” from extreme net longs.
- USDJPY vs JPY positioning:
USDJPY is around ~159.226, and JPY has become deeply net short. Market implication: trend-following may stay intact, but the market becomes vulnerable to sharp counter-moves (policy headline, risk-off equity drawdown, or sudden yield compression).
- S&P 500 vs net shorts:
S&P 500 is around ~6,506, while speculators are still net short. Market implication: upside can be mechanically strengthened by short covering, but visible oil-driven downside scenarios remain material (and explicitly flagged by Reuters coverage of an oil shock scenario).
- WTI crude vs net longs:
WTI (proxy) is near $98.23, and net longs remain heavy. Market implication: trend can persist under supply-risk headlines, but convex downside appears if geopolitical risk eases or supply expectations shift—crowded longs can unwind quickly.
- Natural gas vs net shorts:
NG (proxy) is ~3.095 with heavy net shorts. Market implication: asymmetric upside tail—any bullish catalyst can produce a short squeeze.
Trading and investing ideas tied to positioning
All ideas below are positioning-led setups, not personalized investment advice. Reference prices are from public quotes near the snapshot date (see citations in the prior section). Position sizing is expressed as a risk budget rule:
[ \text{Position size} \approx \frac{\text{Risk $ per trade}}{|\text{Entry} - \text{Stop}|} ]
A common disciplined range is 0.25%–0.75% of portfolio value at risk per trade (lower for highly volatile commodities). This is a risk method, not a guarantee.
Short-term trade ideas (days to weeks)
AUDUSD
- Trade idea: Buy pullback/momentum
- Entry: 0.7000
- Stop-loss: 0.6930
- Target: 0.7100
- Position sizing guidance: Risk 0.5%; size to stop distance
- Positioning rationale: AUD net long rebuilt to ~69k; supportive carry tone 1
- Key risk catalysts: China growth risk; RBA surprise; risk-off shock
USDBRL
- Trade idea: Sell USD/BRL (long BRL)
- Entry: 5.30
- Stop-loss: 5.38
- Target: 5.10
- Position sizing guidance: Risk 0.4%; EMFX vol higher
- Positioning rationale: BRL still net long; modest trimming suggests trend intact, but watch crowding 1
- Key risk catalysts: Commodity shock; Brazil fiscal headlines; global risk-off
EURUSD
- Trade idea: Sell rallies / breakdown-follow
- Entry: 1.1580–1.1620
- Stop-loss: 1.1700
- Target: 1.1400
- Position sizing guidance: Risk 0.5%; use staged entries
- Positioning rationale: EUR net long collapsed (deleveraging); momentum risk lower for “crowded long” reversal 1
- Key risk catalysts: ECB repricing; US data surprise; geopolitical risk
GBPUSD
- Trade idea: Tactical long (short-cover risk)
- Entry: 1.3400 (breakout)
- Stop-loss: 1.3250
- Target: 1.3700
- Position sizing guidance: Risk 0.5%; tighter if volatile
- Positioning rationale: GBP net short reduced sharply last week → short-cover tail 1
- Key risk catalysts: BoE messaging; UK inflation; risk-off
USDJPY
- Trade idea: Trend-follow long USDJPY
- Entry: 158.0–159.3
- Stop-loss: 156.5
- Target: 162.5
- Position sizing guidance: Risk 0.5%; stops wide
- Positioning rationale: JPY flipped to heavy net short; trend may persist until a catalyst 1
- Key risk catalysts: BoJ surprise; equity drawdown prompting JPY squeeze
USDCAD
- Trade idea: Sell USD/CAD on weakness
- Entry: 1.3680
- Stop-loss: 1.3820
- Target: 1.3400
- Position sizing guidance: Risk 0.4%; oil-beta
- Positioning rationale: CAD positioning unwound to flat → room to rebuild with oil strength 1
- Key risk catalysts: Oil reversal; BoC; US growth shocks
USDCHF
- Trade idea: Short USDCHF (CHF rebound)
- Entry: 0.788
- Stop-loss: 0.805
- Target: 0.760
- Position sizing guidance: Risk 0.4%
- Positioning rationale: CHF net shorts reduced meaningfully → less bearish CHF pressure 1
- Key risk catalysts: SNB surprise; global risk events
USDMXN
- Trade idea: Sell USD/MXN (carry)
- Entry: 17.83
- Stop-loss: 18.30
- Target: 17.10
- Position sizing guidance: Risk 0.35%
- Positioning rationale: MXN remains net long, though easing; carry still favored 1
- Key risk catalysts: Banxico; US rates spike; risk-off
NZDUSD
- Trade idea: Buy rebound (shorts reduced)
- Entry: 0.5900
- Stop-loss: 0.5740
- Target: 0.6100
- Position sizing guidance: Risk 0.5%
- Positioning rationale: NZD net shorts reduced a lot in the latest week 1
- Key risk catalysts: RBNZ; global growth; China linkage
S&P 500
- Trade idea: Tactical long (short-cover)
- Entry: 6,550 (breakout)
- Stop-loss: 6,400
- Target: 6,850
- Position sizing guidance: Risk 0.35% (index gap risk)
- Positioning rationale: Still net short but shorts decreasing → upside squeeze risk 1
- Key risk catalysts: Oil-supply shock scenario; earnings; Fed risks 7
Nasdaq-100
- Trade idea: Buy dips in an uptrend
- Entry: 23,900
- Stop-loss: 23,200
- Target: 25,000
- Position sizing guidance: Risk 0.35%
- Positioning rationale: Net long stable; relative strength vs SPX positioning 2
- Key risk catalysts: Rates shock; tech regulation; earnings
Gold
- Trade idea: Buy dip (structural long)
- Entry: 4,550
- Stop-loss: 4,450
- Target: 4,750
- Position sizing guidance: Risk 0.3% (high vol)
- Positioning rationale: Large net long persists, only small trim 6
- Key risk catalysts: Real yields spike; USD rally; liquidation risk
WTI crude
- Trade idea: Breakout buy (but watch crowding)
- Entry: 100.0
- Stop-loss: 96.0
- Target: 112.0
- Position sizing guidance: Risk 0.25% (gap risk)
- Positioning rationale: Very large net long; trend can persist under supply risk 3
- Key risk catalysts: De-escalation; surprise supply; demand shock
Silver
- Trade idea: Buy volatility with tight risk
- Entry: 70.0
- Stop-loss: 66.0
- Target: 78.0
- Position sizing guidance: Risk 0.25%
- Positioning rationale: Net long modest; can follow gold beta 6
- Key risk catalysts: Gold reversal; liquidity shocks
Copper
- Trade idea: Buy continuation
- Entry: 5.40
- Stop-loss: 5.10
- Target: 6.00
- Position sizing guidance: Risk 0.25%
- Positioning rationale: Net long moderate; growth/infra beta 6
- Key risk catalysts: China demand; recession fears
Aluminium
- Trade idea: Range trade (low conviction)
- Entry: 3,050
- Stop-loss: 2,950
- Target: 3,300
- Position sizing guidance: Risk 0.2%
- Positioning rationale: Positioning near flat; follow price/fundamentals 6
- Key risk catalysts: Energy costs; industrial cycle
Natural Gas
- Trade idea: Contrarian long (squeeze setup)
- Entry: 3.10
- Stop-loss: 2.85
- Target: 3.65
- Position sizing guidance: Risk 0.2%
- Positioning rationale: Very large net short supports squeeze risk 3
- Key risk catalysts: Weather; storage, LNG headlines
Wheat (SRW)
- Trade idea: Sell rallies / trend-follow short
- Entry: 600
- Stop-loss: 620
- Target: 540
- Position sizing guidance: Risk 0.25%
- Positioning rationale: Net short; bearish bias persists 4
- Key risk catalysts: Weather, USDA, geopolitics
Corn
- Trade idea: Buy pullback (crowded long risk)
- Entry: 460
- Stop-loss: 440
- Target: 510
- Position sizing guidance: Risk 0.2%
- Positioning rationale: Very large net long; trend strong but crowded 4
- Key risk catalysts: USDA WASDE; planting/weather
Soybeans
- Trade idea: Buy pullback
- Entry: 1,160
- Stop-loss: 1,110
- Target: 1,250
- Position sizing guidance: Risk 0.2%
- Positioning rationale: Large net long; supportive but liquidations possible 4
- Key risk catalysts: South America supply; China demand
Medium/long-term ideas (weeks to months)
These are higher-level “positioning + macro regime” ideas intended to be refined with your preferred technical/fundamental overlay.
EURUSD
- Medium-term idea: Structural bearish bias until EUR longs rebuild
- Entry approach: Sell rallies if the EUR net stays low
- Stop: 1.185
- Target zone: 1.10–1.13
- Why it fits positioning: EUR long liquidation suggests regime change 1
- What to monitor: ECB–Fed spread; EU growth data
USDJPY
- Medium-term idea: Long USDJPY but reduce size as shorts crowd
- Entry approach: Buy dips; trail stop
- Stop: 154.5
- Target zone: 165–170
- Why it fits positioning: JPY net short suggests trend, but squeeze risk grows 1
- What to monitor: BoJ policy, global risk sentiment
S&P 500
- Medium-term idea: Position for a “short-covering rally” but hedge oil risk
- Entry approach: Long with downside hedge
- Stop: 6,250
- Target zone: 6,900–7,100
- Why it fits positioning: Net shorts still sizable; can fuel rallies 2
- What to monitor: Oil supply risk, earnings, Fed
WTI crude
- Medium-term idea: Hold long only if the catalyst regime persists
- Entry approach: Use a trailing stop under swing lows
- Stop: 92
- Target zone: 115–125
- Why it fits positioning: Net longs large: trend can run, but exit must be disciplined 3
- What to monitor: Middle East headlines; inventories
Natural gas
- Medium-term idea: “Short-squeeze optionality” long
- Entry approach: Scale in small; add on breakouts
- Stop: 2.70
- Target zone: 4.0–4.5
- Why it fits positioning: Very large net short supports convex upside 3
- What to monitor: Weather, storage, LNG/export flow
Corn/Soybeans
- Medium-term idea: Bullish but manage crowded-risk
- Entry approach: Smaller core + add-on confirmation
- Stop: Corn 430 / Soy 1,060
- Target zone: Corn 540–580 / Soy 1,300–1,400
- Why it fits positioning: Very large net longs can persist in genuine supply-tight regimes 4
- What to monitor: USDA reports, crop conditions
Comments