 English
 پارسی



CFTC Speculative Net Positions Report: FX, Equities, Gold, Oil and Grains Reveal a Split Market
The latest CFTC speculative net positions snapshot shows a market that is still broadly willing to hold risk in U.S. equity index futures, gold, corn and soybeans, but much more selective across FX, energy, metals and soft commodities.
The main message is not simply that some markets are crowded long or crowded short. The more important signal is where speculative positioning confirms price action and where it clearly diverges from price action.
The strongest bullish confirmations appear in S&P 500 futures, corn, and to a lesser extent CAD and GBP, where speculative positioning became less bearish or more bullish while price also improved. The clearest bearish confirmation is JPY, where speculative shorts deepened and yen futures also fell over the week.
At the same time, several markets show divergence rather than confirmation. EUR, MXN, gold, natural gas and copper saw positioning improve while prices failed to follow through. Nasdaq 100, crude oil and wheat moved strongly in price but not in line with speculative flow. That divergence is important because it often creates the best tactical setups: either price catches up with positioning, or the market rejects the positioning signal and forces a reversal.
The COT report should always be read with timing discipline. CFTC positioning data reflects a weekly snapshot, normally based on Tuesday positioning and released on Friday. That means the data is not real-time order flow. It is best used as a positioning filter, not as a standalone entry trigger.
How to Read This CFTC Report
The logic is simple:
- When positioning improves and price rises, the market shows bullish confirmation.
- When positioning weakens and price falls, the market shows bearish confirmation.
- When positioning improves but price falls, the market shows bullish divergence.
- When price rises but positioning weakens, the market shows bearish divergence.
This structure helps identify which breakouts deserve trust and which moves may be vulnerable to reversal.
Full CFTC Data Table
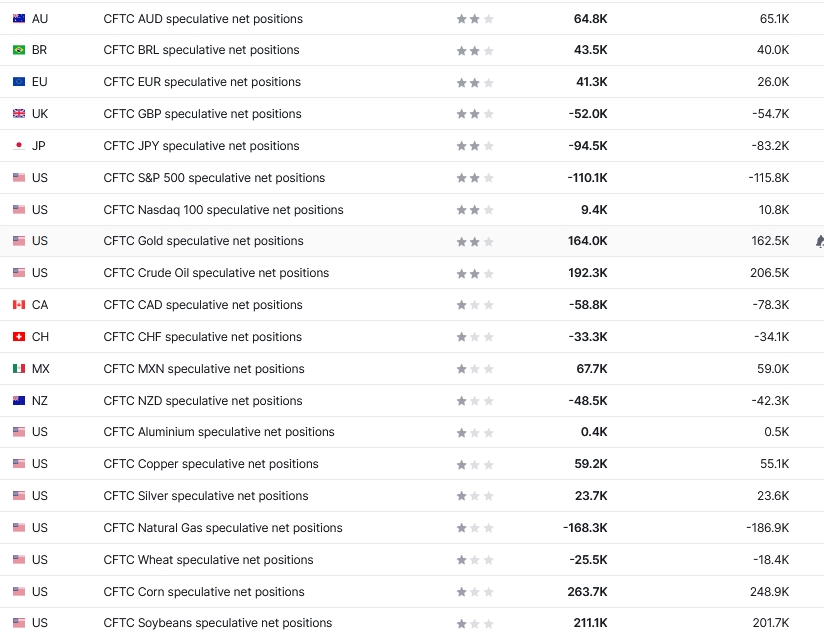
Cleanest Confirmation Signals
The strongest confirmation signals deserve special attention because they show alignment between speculative flow and price action.
- Japanese Yen: Strongest Bearish Confirmation
JPY futures show the clearest bearish confirmation in the full table. Speculative net shorts increased from -83.2K to -94.5K, a weekly deterioration of -11.3K. At the same time, Japanese yen futures fell 0.56% over the one-week proxy period.
That combination means speculative traders added to yen shorts while price action also moved in the same direction. In spot FX terms, this supports a long USD/JPY bias, assuming the dollar side does not weaken materially.
- S&P 500: Bullish Short-Covering Signal
S&P 500 futures remain net short at -110.1K, but that short position improved from -115.8K, a weekly change of +5.7K. Meanwhile, S&P 500 E-mini futures rose 1.30% over the week.
This is not a fully bullish positioning structure because the market is still net short. However, the short base is being reduced while price rises. That suggests bearish pressure is easing, and it supports a buy-the-dip approach rather than an aggressive short setup.
- Corn: Best Agricultural Confirmation
Corn has one of the strongest outright speculative long positions in the report. Net longs increased from 248.9K to 263.7K, a weekly gain of 14.8K. Corn futures also rose 1.51% over the week.
Among the grain contracts, corn shows the cleanest alignment between positioning and price. Speculators are already long, they added to that exposure, and price confirmed the move.
Important Bullish Divergence Signals
Bullish divergence does not mean a market should be bought automatically. It means positioning improved while price failed to follow. If price later stabilizes or breaks resistance, the market can create a catch-up move.
- EUR: Large Positioning Improvement, Weak Price Follow-Through
EUR futures saw one of the largest weekly positioning improvements in the table. Net longs rose from 26.0K to 41.3K, a jump of 15.3K. Despite that, Euro FX futures slipped 0.36% over the one-week proxy period.
This is a classic bullish divergence. Speculators increased long exposure, but price has not yet confirmed. If EUR futures can reclaim resistance and hold support, the setup favors a catch-up rally.
- MXN: Positive Sponsorship Despite Price Weakness
MXN futures remained net long and improved further. Net positions rose from 59.0K to 67.7K, a weekly increase of 8.7K. However, Mexican peso futures slipped 0.30% over the week.
That creates another bullish divergence. Speculative sponsorship remains positive, but price has softened. In spot FX terms, the equivalent view would be short USD/MXN on peso strength.
- Gold: Heavy Long Positioning Meets Price Pressure
Gold remains heavily net long at 164.0K, up slightly from 162.5K, a weekly increase of 1.5K. However, gold futures fell 1.47% over the week.
This is a more complicated signal. On one hand, gold still has strong speculative sponsorship. On the other hand, price declined despite additional long exposure. That can mean either dip-buying by committed bulls or early evidence that the market is vulnerable to long liquidation if support fails.
- Natural Gas: Short-Covering While Price Keeps Falling
Natural gas remains deeply net short at -168.3K, but the position improved sharply from -186.9K, a weekly change of +18.6K. At the same time, natural gas futures dropped 6.14%.
This is one of the most interesting mean-reversion setups in the report. Shorts are being covered aggressively, but price is still falling. That does not create an immediate buy signal, but it does suggest downside crowding is becoming more fragile.
Important Bearish Divergence Signals
Bearish divergence appears when price rises but speculative positioning weakens, or when price strength is not supported by new speculative accumulation.
- Nasdaq 100: Rally Without Positioning Support
Nasdaq 100 futures rose 3.14% over the week, the strongest equity index price move in the table. However, speculative net longs declined from 10.8K to 9.4K, a weekly change of -1.4K.
This does not automatically mean Nasdaq should be shorted aggressively. Momentum is still strong. But the rally is not being confirmed by speculative flow, which makes the market more vulnerable to a tactical pullback if tech momentum fades.
- Crude Oil: Price Surge Despite Long Reduction
WTI crude oil futures rose 7.09% over the week, one of the strongest price moves in the entire report. But speculative net longs fell from 206.5K to 192.3K, a weekly decline of -14.2K.
That divergence matters. Price jumped sharply, but speculators reduced long exposure. This suggests the rally may have been driven more by macro headlines, supply risk or short-term price chasing than by fresh speculative accumulation.
- Wheat: Bearish Flow Against Positive Price Action
Wheat futures rose 1.94% over the week, but speculative net shorts expanded from -18.4K to -25.5K, a weekly deterioration of -7.1K.
This is a classic bearish divergence. Price rose, but speculative traders became more bearish. If the rally loses momentum, wheat may become vulnerable to a downside reversal.
Trading Ideas Based on CFTC Positioning and Live Prices
The trade setups below are short- to medium-term ideas, broadly suitable for a one-day to three-month horizon. The entry levels are framed around the futures prices in the live snapshot. Position sizing refers to percentage of total capital at risk, not notional exposure.
These are trading ideas, not guaranteed outcomes. COT positioning should be used with technical confirmation, macro context, liquidity conditions and risk management.
1. Short JPY Futures / Long USDJPY
The short JPY trade is the cleanest confirmation setup. Speculators increased yen shorts by 11.3K, taking the net position to -94.5K, while price also declined. This is not a divergence trade; it is a trend-confirmation trade.
The setup favors short JPY futures around 0.00630, with a stop near 0.00639 and a target near 0.00608. In spot FX terms, the same idea translates into a bullish USDJPY bias.
2. Long EUR Futures on Dips
EUR has one of the strongest bullish divergence signals. Net longs increased by 15.3K, rising from 26.0K to 41.3K, while price still slipped 0.36%.
That means speculative flow improved before price confirmed. The preferred strategy is not to chase EUR at any price, but to buy dips around 1.1710, with a stop near 1.1580 and a target near 1.2000.
3. Long S&P 500 E-mini on Pullback
The S&P 500 is still net short at -110.1K, but shorts were reduced by 5.7K while price rose 1.30%. That creates a constructive short-covering signal.
The better strategy is buying pullbacks rather than chasing strength. The setup favors long S&P 500 E-mini futures around 7,140, with a stop near 7,000 and a target around 7,480.
4. Short Nasdaq 100 E-mini Tactically
Nasdaq 100 price action was strong, with futures rising 3.14%, but speculative net longs fell from 10.8K to 9.4K. That shows price momentum without positioning confirmation.
This is not a structural bearish call on technology stocks. It is a tactical fade idea if price stalls. The setup favors short Nasdaq 100 E-mini around 27,350, with a stop near 27,900 and a target near 26,050.
5. Short Gold Futures
Gold is still heavily net long at 164.0K, and speculative longs increased by 1.5K. But price fell 1.47% over the week. That creates a warning sign.
If gold fails to recover quickly, the market may be exposed to long liquidation. The trade idea favors short gold futures around 4,725, with a stop near 4,835 and a target near 4,505.
6. Short WTI Crude on Failed Retest
WTI crude is the clearest energy divergence. Price surged 7.09%, but speculative net longs fell by 14.2K, from 206.5K to 192.3K.
That suggests the rally may not have been supported by fresh speculative accumulation. The setup favors short WTI only if the market fails to reclaim recent highs. Entry is around 94.0, with a stop near 98.5 and a target near 84.5.
7. Long Corn Futures
Corn has the best agricultural confirmation. Net longs rose by 14.8K, from 248.9K to 263.7K, while price gained 1.51%.
This is a clean flow-and-price alignment. The setup favors long corn futures around 452'0, with a stop near 436'0 and a target near 490'0.
8. Short Wheat Futures
Wheat offers the opposite setup. Price rose 1.94%, but speculative net shorts expanded by 7.1K, from -18.4K to -25.5K.
That makes wheat vulnerable if the rally loses momentum. The trade idea favors short wheat futures around 614'0, with a stop near 636'0 and a target near 570'0.
Market-by-Market Review
FX Positioning
FX positioning is split. AUD remains net long at 64.8K, but positioning slipped slightly by -0.3K while price rose 0.49%, creating bearish divergence. BRL improved by 3.5K to 43.5K, but price fell 0.40%, creating bullish divergence.
EUR is one of the most important FX signals, with net longs rising 15.3K to 41.3K even as price fell 0.36%. GBP remains net short at -52.0K, but positioning improved by 2.7K and price rose 0.37%, creating bullish confirmation.
JPY is the clearest bearish FX signal, with net shorts deepening by -11.3K to -94.5K, while price fell 0.56%. CAD improved sharply by 19.5K, moving from -78.3K to -58.8K, while price rose 0.16%, creating bullish confirmation.
CHF remains net short at -33.3K, but positioning improved by 0.8K while price fell 0.41%, creating bullish divergence. MXN remained net long and improved by 8.7K to 67.7K, despite a 0.30% weekly price decline. NZD weakened from -42.3K to -48.5K, a deterioration of -6.2K, even as price rose 0.39%, creating bearish divergence.
Equity Index Positioning
Equity positioning is more nuanced than price action alone suggests. S&P 500 futures remain net short at -110.1K, but the position improved from -115.8K, with a weekly change of +5.7K. Price also rose 1.30%, producing bullish confirmation.
Nasdaq 100 futures remain net long at 9.4K, but positioning declined from 10.8K, a change of -1.4K. Price rose strongly by 3.14%, creating bearish divergence. The implication is that the Nasdaq rally may be more vulnerable to a tactical correction than the S&P 500.
Metals Positioning
Gold remains heavily net long at 164.0K, up from 162.5K, but the price fell 1.47%. This is a key warning sign because price weakness occurred despite positive positioning.
Copper net longs increased from 55.1K to 59.2K, a rise of 4.1K, while price slipped 0.07%. Silver net longs were almost unchanged, rising from 23.6K to 23.7K, while price dropped 4.77%. Aluminium remained barely net long at 0.4K, down from 0.5K, while price rose 0.11%.
Overall, metals show several divergence signals, but gold remains the most tradable because positioning is heavy and price is already under pressure.
Energy Positioning
WTI crude remains net long at 192.3K, but positioning fell sharply from 206.5K, a weekly drop of 14.2K. Price, however, rose 7.09%. That is one of the strongest bearish divergences in the report.
Natural gas remains deeply net short at -168.3K, but shorts were covered aggressively from -186.9K, a weekly change of +18.6K. Price still fell 6.14%. This creates a potential mean-reversion watchlist setup, but the price trend has not yet confirmed a long trade.
Agricultural Positioning
Corn and soybeans remain strongly net long. Corn net longs rose from 248.9K to 263.7K, up 14.8K, while price rose 1.51%. Soybean net longs rose from 201.7K to 211.1K, up 9.4K, while price slipped slightly by 0.04%.
Wheat remains net short and became more bearish. Net shorts widened from -18.4K to -25.5K, a change of -7.1K, while price rose 1.94%. That creates bearish divergence and supports fading wheat strength if momentum weakens.
Final Takeaway
The latest CFTC speculative net positions report should not be read as a simple list of crowded longs and shorts. Its real value is in showing where speculative flow and price action agree, and where they diverge.
The cleanest agreement trades are short JPY futures, long S&P 500 E-mini on pullback, and long corn futures. The most important bullish divergence setups are EUR, MXN, gold, and natural gas, although EUR and MXN look more immediately actionable than gold or natural gas. The clearest bearish divergence setups are Nasdaq 100, WTI crude, and wheat.
From a trading perspective, the most attractive ideas are not necessarily the most crowded positions. They are the markets where the COT data creates an asymmetric setup: either price confirms the positioning trend, or the market becomes vulnerable because price has moved without speculative support.
In this report, that points to short JPY futures, long EUR futures on dips, long MXN futures on weakness, long S&P 500 E-mini on pullbacks, tactical short Nasdaq 100, short gold if it fails to recover, short WTI crude on failed retests, long corn, and short wheat.
FAQ
What is the CFTC COT report?
The CFTC Commitment of Traders report shows how different groups of traders are positioned in futures markets. This analysis focuses on speculative net positions, which track whether non-commercial traders are net long or net short.
Why does CFTC positioning matter for traders?
CFTC positioning helps traders understand market crowding, speculative conviction and potential reversal risk. It is especially useful when combined with price action, macro context and technical levels.
What is the strongest signal in this CFTC report?
The strongest bearish confirmation is in JPY, where speculative shorts deepened by 11.3K and yen futures fell 0.56%. The strongest agricultural bullish confirmation is corn, where net longs rose by 14.8K and price gained 1.51%.
What is the best bullish divergence in the report?
EUR is one of the best bullish divergence signals. Net longs increased by 15.3K, from 26.0K to 41.3K, while Euro FX futures fell 0.36%. That suggests positioning improved before price confirmed.
Why is crude oil showing bearish divergence?
WTI crude futures rose 7.09%, but speculative net longs fell by 14.2K, from 206.5K to 192.3K. Price rose strongly, but speculative exposure declined, which means the rally may lack fresh speculative support.
Is gold bullish or bearish based on this report?
Gold remains heavily net long at 164.0K, but price fell 1.47% despite a small increase in long positioning. That makes gold vulnerable if support fails, because crowded long positioning can turn into liquidation pressure.
Why is Nasdaq 100 a tactical short idea?
Nasdaq 100 futures rose 3.14%, but speculative net longs declined from 10.8K to 9.4K. That means price momentum was strong, but COT positioning did not confirm the rally.
What is the best equity index setup?
The better equity setup is long S&P 500 E-mini on pullback rather than chasing Nasdaq. S&P 500 net shorts improved by 5.7K while price rose 1.30%, creating bullish confirmation.
Which grain market has the strongest bullish setup?
Corn has the strongest bullish grain setup. Net longs rose from 248.9K to 263.7K, a weekly increase of 14.8K, while price gained 1.51%.
Should COT data be used alone for trading?
No. COT data should be used as a positioning filter. It works best when combined with live price action, technical levels, macro catalysts, liquidity conditions and strict risk management.
Comments