 English
 پارسی


Overview of the Commitment of Traders report
The U.S. Commodity Futures Trading Commission (CFTC) publishes the Commitments of Traders (COT) report each Friday. The report divides market participants into commercial (hedgers) and non‑commercial or “managed money” (speculators). The net speculative position is the difference between speculators’ long and short contracts for a futures contract. Analysts follow this data because it offers a window into market sentiment: a net long position suggests speculators expect prices to rise, whereas a net short indicates bearish expectations. Changes in net positions from the prior week can signal a trend; a larger net long than the week before implies that traders are becoming more bullish, while a deeper net short signals more bearishness. With speculators representing 70–90 % of total market volume, their positioning often precedes price moves.
Net speculative positions (thousands of contracts)
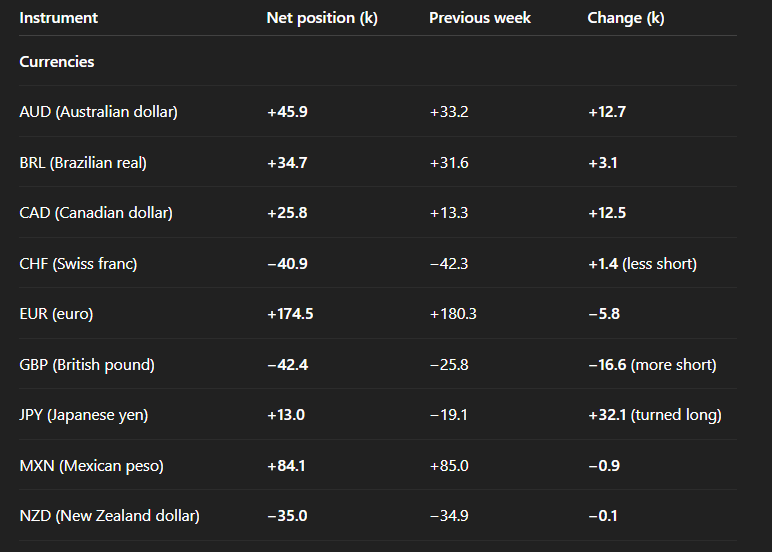
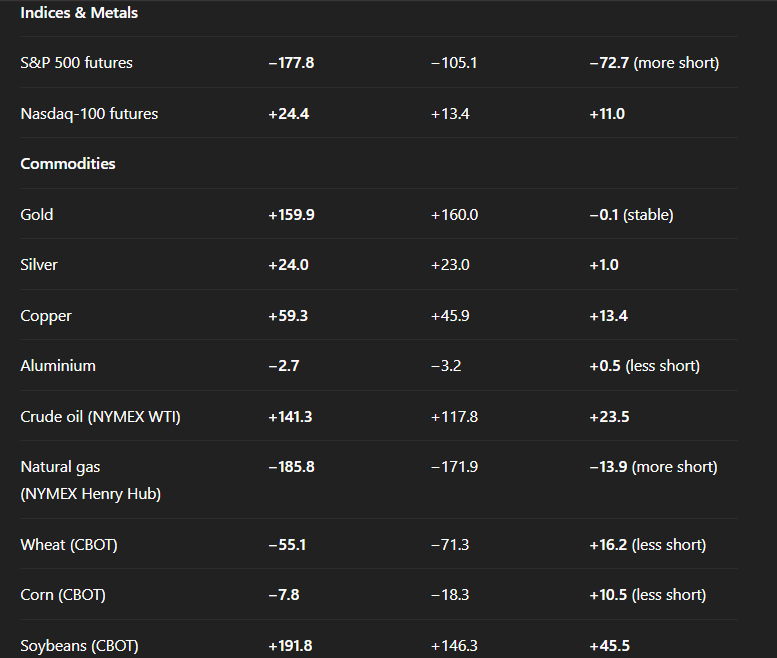
The table below summarises net speculative positions from the 16 February 2026 CFTC report (contracts in thousands) with the change versus the previous report. Positive numbers mean speculators are net long; negative numbers mean net short.
Interpretations and market conditions
Currencies
Australian dollar (AUD)
The RBA surprised markets by raising its policy rate to 3.85 % in February 2026 and signalled that further hikes may be needed because employment remains robust and core inflation is above the 2 % target. A hawkish RBA contrasts with other major central banks that are pausing or cutting rates, boosting yields on Australian assets and making the AUD attractive. The CFTC data show speculators increased net long positions to 45.9 k contracts, a 12.7 k increase, indicating growing bullishness.
- Trading idea: stay long AUD/USD or AUD/JPY, with stops below recent support. Higher interest-rate differentials and China’s stabilising demand for commodities support the AUD. However, monitor for RBA dovish turns or a sharp drop in iron‑ore prices; a reversal of rate expectations could trigger profit‑taking.
Euro (EUR)
Eurozone inflation fell to 1.7 %, and a Reuters poll suggests the ECB will keep its deposit rate at 2 % through 2026. With growth sluggish, the ECB is expected to remain on hold until at least 2027. Speculators’ net long euro position slipped slightly to 174.5 k contracts. The small reduction may reflect profit‑taking after the euro’s rally.
- Trading idea: maintain a cautiously bullish stance on EUR/USD but expect range‑bound trading. Enter long positions on dips toward 1.07–1.08 with stops below 1.05; target 1.10–1.12. A surprise ECB rate cut or deterioration in euro‑area growth would warrant closing longs.
British pound (GBP)
The Bank of England voted 5–4 to keep the Bank Rate at 3.75 % in February but noted that inflation is likely to fall back to around 2 % by April and signalled further rate cuts later in 2026. The dovish tone has driven speculators to increase net short positions to −42.4 k, a significant jump from −25.8 k.
- Trading idea: bias remains bearish on GBP/USD. Short rallies towards 1.28–1.30 with stops above 1.31; target 1.25 or lower. If U.K. inflation proves sticky or the BoE delays rate cuts, a short squeeze could occur, so keep position sizes moderate.
Japanese yen (JPY)
The Bank of Japan ended its negative‑rate policy in December 2025 and raised rates to 0.75 %. Persistent inflation above target and a weak yen have prompted speculation of further hikes; a Mizuho executive said the BoJ could raise rates again as soon as March and possibly up to three times in 2026. Speculative positioning switched from a net short of −19.1 k to a net long of +13.0 k contracts, reflecting expectations for yen appreciation.
- Trading idea: consider long JPY crosses (short USD/JPY or EUR/JPY). The potential for additional BoJ hikes and lower U.S. yields, if the Fed begins cutting rates, could push USD/JPY toward 145–140. However, if global risk appetite weakens and the yen’s safe‑haven bid strengthens sharply, take profits on longs.
Canadian dollar (CAD)
Speculators turned more bullish on the CAD, raising net longs to 25.8 k contracts. Canada’s economy is supported by strong oil exports and stable growth. The Bank of Canada has paused at 4.5 % but is not expected to cut rates until later in 2026.
- Trading idea: long CAD against USD or GBP (e.g., sell GBP/CAD). The oil price oversupply could cap CAD gains; hedge by pairing with weaker currencies like GBP.
Swiss franc (CHF) and New Zealand dollar (NZD)
Speculators remain net short CHF (−40.9 k) and NZD (−35.0 k), though positions have barely changed. Switzerland faces negative yields and deflationary pressures, while the Reserve Bank of New Zealand has signalled that rates are at or near their peak.
- Trading idea: continue short positions in CHF/JPY or CHF/USD as long as interest‑rate differentials remain wide. For NZD, the bearish bias suggests selling rallies versus USD or AUD; target 0.60 with stops above 0.63.
Mexican peso (MXN) and Brazilian real (BRL)
Mexico and Brazil offer some of the highest interest rates among major economies. Speculators hold large net longs in MXN (84.1 k) and BRL (34.7 k), but positions were little changed.
- Trading idea: maintain carry trades long MXN/JPY and BRL/JPY, but reduce size as valuations look stretched. Any indication of rate cuts or political instability could prompt profit‑taking.
Equity indices
S&P 500 futures
Speculators increased their net short position in S&P 500 futures to −177.8 k contracts, a sizeable jump from −105.1 k. The bearish stance may reflect caution after a strong 2025 rally. Analysts forecast the S&P 500 to rise to around 7,490 by end‑2026 (roughly 12 % from current levels) but warn that valuations are stretched and corrections are possible.
- Trading idea: adopt a two‑pronged strategy: (1) hold core long positions in tech and AI leaders but hedge with short S&P futures or protective puts in case of a correction; (2) rotate some capital into small caps, financials, and healthcare as analysts expect these sectors to benefit from rate cuts. Consider buying the dip if a sell‑off occurs, since long‑term fundamentals remain constructive.
Nasdaq‑100 futures
The Nasdaq‑100 net long position rose to 24.4 k contracts. Investors remain bullish on technology and AI themes. However, high valuations make the index sensitive to earnings disappointments and interest‑rate moves.
- Trading idea: Stay selectively long high‑quality tech stocks but avoid excessive leverage. Use trailing stops to protect gains and consider selling covered calls to generate income while markets consolidate.
Commodities
- Crude oil (WTI)
Speculators increased net long positions in WTI to 141.3 k contracts. However, fundamentals remain bearish: analysts expect Brent to average ≈$61/bbl and WTI ≈$58/bbl in 2026 as supply exceeds demand by 0.5–3.5 million barrels per day. The International Energy Agency (IEA) forecasts a global oil surplus of 4.25 mb/d in Q1 2026 and 3.69 mb/d for the year, noting supply growth from OPEC+ and the U.S. will outpace consumption. Geopolitical risks (U.S.–Iran tensions, sanctions) could cause short‑term spikes, but the overall oversupply suggests upside is limited.
Trading idea: View current net longs as frothy. Fade rallies above $65/bbl by entering short WTI or buying put options. Target the $55–57 range. Tighten stops if geopolitical events disrupt supply or if OPEC+ unexpectedly cuts production.
- Natural gas
Speculators deepened their net short to −185.8 k contracts. A wave of LNG supply from the United States and Qatar is expected to raise global capacity to 475 million tons in 2026, up 10 % from 2025, and experts see oversupply depressing prices; Kpler predicts Asian spot LNG will average $10/mmBtu in 2026 and could drop below $8/mmBtu if supply hits the market. Industry executives note that supply could rise more than 50 % by 2030, exerting sustained pressure on prices.
Trading idea: maintain short positions in Henry Hub gas futures. Consider spreads, such as buying winter 2026 contracts and selling summer 2026, to capture seasonal tightness. A sharp cold snap or delays in new liquefaction projects are downside risks.
- Gold
Net longs in gold were steady at 159.9 k contracts. Even after a strong 2025 rally, major banks forecast gold to reach $5,500/oz in 2026 as central bank buying continues and the Fed is expected to cut rates twice. Lower real rates and geopolitical uncertainty support gold.
Trading idea: hold long gold positions via futures or ETFs. Add on dips toward $4,200/oz, targeting new highs above $4,500/oz. Use trailing stops; profit‑taking may occur if real yields rise or the U.S. dollar strengthens materially.
- Silver
Speculators modestly increased net longs to +24.0 k contracts. The Silver Institute expects retail investment demand to surge 20 % in 2026 to 227 million ounces, offsetting a 2 % decline in industrial demand and 9 % drop in jewellery consumption; the market is set for a sixth straight structural deficit of 67 million oz. Prices have rallied to about $81/oz after hitting a record $121.60 in January 2026.
Trading idea: remain long silver but be prepared for volatility. With a structural deficit and rising investment demand, pullbacks toward $70–75/oz may offer buying opportunities. Consider ratio trades (long silver/short gold) if gold outperforms.
- Copper and aluminium
Copper net longs rose to 59.3 k contracts, reflecting optimism about supply disruptions. A Reuters poll in late 2025 found analysts expect copper to average $10,500/ton in 2026, up 7 % from earlier forecasts, because mine disruptions in Indonesia, Congo, and Chile are flipping the market to a deficit of ~150k tons. Aluminium positions remain slightly short (−2.7 k) but improved versus the prior week. Analysts project aluminium prices averaging $2,679/ton in 2026 as Chinese production caps and demand from renewable energy narrow the surplus.
Trading idea: go long copper on dips, targeting $4.90–5.00/lb ($10,800–11,000/ton). Hedge with short aluminium if Chinese supply picks up; otherwise, pair with long aluminium if renewable demand continues. Use stop‑losses below key support at $4.50/lb ($9,920/ton).
Agricultural commodities
- Soybeans
Speculators aggressively increased net longs to 191.8 k contracts (+45.5 k). The USDA projects U.S. farmers will plant 85 million acres of soybeans in 2026 (up from 81.2 million) because soy prices are supported by strong demand for renewable fuels. The soybean harvest is expected at 4.450 billion bushels with end‑stocks of 355 million bushels. Demand remains robust.
Trading idea: maintain long soybean positions, targeting a move above $14.50/bushel. Use bull‑call spreads to limit risk; weather risks or Chinese import decisions could trigger volatility.
- Corn
Corn net shorts narrowed to −7.8 k. Farmers plan to reduce corn plantings to 94 million acres, down sharply from 98.8 million in 2025, due to low prices and a global glut. The USDA forecasts a 2026 corn harvest of 15.755 billion bushels and end‑stocks of 1.837 billion bushels, with exports falling. Low prices and oversupply have hurt U.S. farm income.
Trading idea: shift from outright shorts to a more neutral stance. Consider long corn/short wheat spreads, as corn may benefit from reduced plantings while wheat remains burdened by an abundant global supply. A weather shock could quickly tighten supplies.
- Wheat
Wheat net short positions decreased to −55.1 k contracts, but the market remains bearish. U.S. wheat prices languish around $5/bushel because of an abundant global supply; many farmers have abandoned wheat fields or switched to other crops. Global stocks‑to‑use ratios among exporters have been revised higher to around 15.89 %, reducing fears of tightness, though poor harvests in Ukraine or Russia could tighten supply later.
Trading idea: remain short wheat on rallies toward $6/bushel; fundamentals suggest limited upside. Tighten stops in case of a weather‑induced supply shock in the Black Sea region.
Conclusion
In summary, the report explains the CFTC Commitment of Traders data and shows how net speculative positions help gauge market sentiment. It lays out the latest readings for currencies, indices, and
commodities, highlighting where speculators are bullish or bearish. For example, AUD and JPY have seen sizable increases in net longs due to hawkish central-bank policies, while the pound has attracted more shorts as the Bank of England signals rate cuts. Conversely, speculators maintain large shorts in crude oil and natural gas despite recent price rallies because global supply is expected to outstrip demand.
The report pairs these positioning insights with macro fundamentals to outline actionable trading ideas. It recommends leaning long on currencies backed by tightening monetary policy (AUD, JPY), hedging S&P 500 exposure with puts while rotating into small caps, and maintaining bullish stances on gold, silver, and copper where structural deficits support higher prices. For over-supplied markets like oil, natural gas, and wheat, it suggests fading rallies and using spreads to manage risk. Altogether, the document provides a comprehensive, evidence-based framework for interpreting COT data and translating it into diversified trading strategies.
Comments