 English
 پارسی


Forecast overview
- Global oil prices.
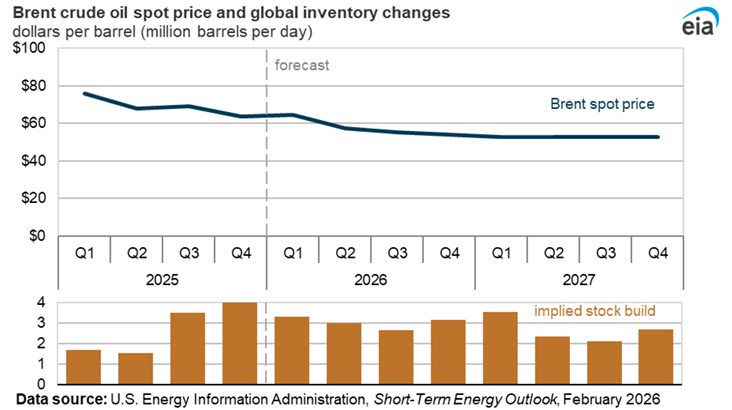
The Brent crude oil price averaged $67 per barrel (b) in January, the highest since September 2025, as weather-related events disrupted the global crude oil supply and escalating tensions with Iran put upward pressure on prices. Despite these short-term events, we expect oil prices will decline in 2026, as global oil production exceeds global oil demand, causing oil inventories to rise. Global inventories continue increasing into 2027. We forecast the Brent crude oil price will average $58 per barrel (b) in 2026 and $53/b in 2027.
- Natural gas prices.
Natural gas prices rose sharply in January. The Henry Hub spot price averaged $7.72 per million British thermal units (MMBtu), up 81% from December, in response to increased heating demand, reduced production, and large inventory withdrawals as Winter Storm Fern blanketed a large portion of the United States. We now expect that the United States will finish the withdrawal season at the end of March with less than 1.9 trillion cubic feet of natural gas in storage, 8% less than previously forecast. As a result, we raised our Henry Hub spot price forecast in February and March by an average of almost 40% from the January STEO. We expect the price increases will moderate as drilling activity drives increases in natural gas production later in the forecast period. Our forecast now assumes the Henry Hub spot price will average about $4.30/MMBtu this year and almost $4.40/MMBtu in 2027.
- Natural gas production.
Frigid weather conditions across the United States led to a 3% drop in U.S. natural gas production from December to January. We expect the production drop was temporary, with almost all of the production back online in February. By the second half of 2026 (2H26), we expect production to ramp up as new pipeline capacity comes online in the Permian and producers increase drilling activity in response to higher prices in 1H26. Overall, U.S. dry natural gas production in our forecast grows by 2% in 2026 and by 1% in 2027.
- Coal consumption.
We raised our forecast of total U.S. coal consumption as the U.S. coal fleet increased generation to meet peak demand during recent cold weather. In January, power plants in the United States used 43 million short tons of coal, 10% more than estimated in our January STEO. We expect higher coal use to persist through 1H26 as result of higher natural gas prices over that period in this month’s forecast. Although we raised our forecast for coal consumption, we still expect the U.S. electric power sector will use about 7% less coal this year than it did in 2025.
- Electricity.
Higher electricity demand in our forecast is driven by both increasing economic activity and data center growth concentrated in Texas and the mid-Atlantic regions. However, increases in electricity use in our forecast are becoming more geographically broad. This month we increased our outlook for electricity consumption in both the Central and Midwest regions because of raised expectations for data center expansion in those areas. We expect that the growing electricity demand will be met mainly through increased solar electricity generation. We expect a 17% increase in solar generation in 2026 and an additional 23% increase in 2027, and wind generation increases by 6% and 7%, respectively, over those years.
NOTE:
We lowered our forecast for the Mont Belvieu propane spot price, which we now expect will average 58 cents per gallon (gal) this year and 64 cents/gal in 2027. Those forecast prices are down by 10 cents/gal and 13 cents/gal, respectively from last month’s outlook. The lower price forecast reflects our higher natural gas production forecast, which results in more propane production as well. With higher propane production we expect that propane stocks will be higher throughout the forecast period.
We completed STEO modeling and analysis for this report on February 5, 2026, and therefore this month’s STEO report does not include the most recent updates to Petroleum Supply Monthly and Natural Gas Monthly that were published on February 6, 2026.
Global Oil Markets
Global oil prices
The Brent crude oil spot price averaged $67 per barrel (b) in January, $4/b higher than the average in December. Daily Brent crude oil prices increased from an average of $62/b on January 2 to $72/b on January 30. Crude oil prices rose in response to disruptions to crude oil production in the United States and Kazakhstan. Despite the near-term increase in prices and short-term disruptions to oil supply, we forecast that strong growth in global oil production will result in high global oil inventory builds over the forecast, causing crude oil prices to fall. We forecast that Brent spot prices will average $58/b in 2026 and $53/b in 2027, down from an average of $69/b in 2025.
Markets also responded to questions over recent U.S. policy action toward Iran, with oil prices recently trading higher and with greater volatility. Crude oil production in Iran has remained stable so far. We assume it will remain stable over our forecast, but acknowledge that actions targeting oil infrastructure or a conflict that affects flows through Strait of Hormuz could obviously reduce Middle East oil production and exports.
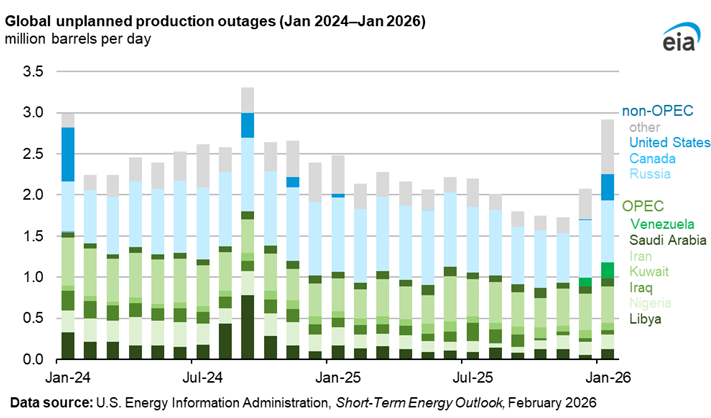
Unplanned disruptions to crude oil production in the United States and Kazakhstan tightened near-term oil supplies in January and caused crude oil prices to rise. Disruptions to crude oil production in the United States were driven by cold weather, which we estimate reduced output by 320,000 barrels per day (b/d) in January. In Kazakhstan, power outages at the major Tengiz oilfield, along with a drone attack and severe weather at the producer’s primary export terminal in Novorossiyk, Russia, together reduced oil production by more than 400,000 b/d in January. Total unplanned disruptions increased for the second consecutive month in January, approaching 3.0 million b/d, which is the most since September 2024. Additionally, cold weather across the northern hemisphere in January increased oil demand at the same time these production disruptions occurred, adding to upward oil price pressures.
Despite near-term tightness from disruptions, we assess that strong global oil production growth will continue to outpace oil consumption over our forecast, driving our assessment that global oil inventories will increase. We expect this trend to continue in both 2026 and 2027. We forecast that global oil inventory builds will average 3.1 million b/d in 2026, compared with an average build of 2.7 million b/d in 2025, before decreasing to average of 2.7 million b/d in 2027. Although we expect prices to fall in 2026 and remain under $60/b in 2027, we assess that both OPEC+ policy and China’s continued strategic inventory builds will limit declines. A large portion of oil inventory builds last year were in strategic stockpiles in China, which limited downward price pressures because these builds acted as a source of demand. We assume that China will continue building strategic stockpiles at nearly the same rate of about 1.0 million b/d in 2026, before reducing strategic builds in 2027.
On February 1, OPEC+ reaffirmed plans to keep production flat in the first quarter of 2026 (1Q26). Despite no plans to announce 2027 targets until 4Q26, we do not expect OPEC+ will increase production next year given our expectation of large inventory builds over the forecast period. Of the nine OPEC members subject to production targets (a group that excludes Iran, Libya, and Venezuela), we expect production will track closely with stated targets during 2026.
Lastly, the evolving situation in Venezuela remains a key uncertainty in our forecast. The oil blockade and the interception of sanctioned oil tankers near Venezuela halted a large portion of Venezuela’s oil exports in December, shutting in production. Reports show that exports recovered in January after licenses were granted to trading companies Vitol and Trafigura to transport Venezuela’s oil. Much of the oil transported by the companies, previously bound for China, went to storage terminals around the Caribbean. The ultimate destination is likely refineries on the U.S. Gulf Coast.
More recently, the U.S. Department of the Treasury’s Office of Foreign Assets Control (OFAC) expanded the general license to allow for more companies to transport and sell Venezuela’s crude oil while the sanctions remain in place. As a result, we now estimate that these new shipments will alleviate production shut-ins and will allow Venezuela’s oil production to return to pre-blockade activity by 2Q26. Any further ease of sanctions or changes to U.S. government policy related to Venezuela could result in more oil production than we assumed in this forecast and put additional downward pressure on oil prices.
Global oil consumption and production
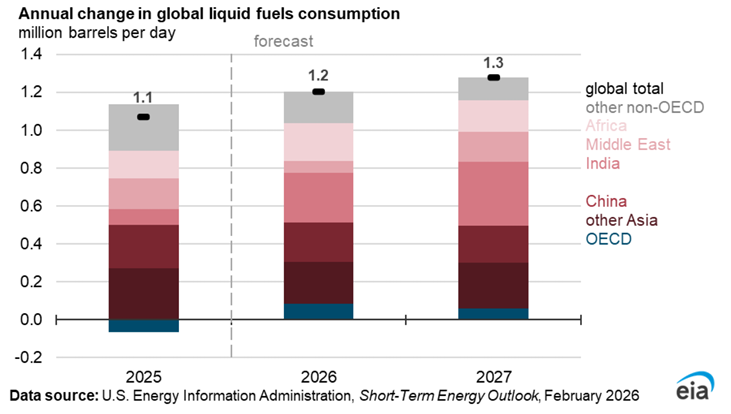
Global liquid fuels consumption increased by an estimated 1.1 million b/d in 2025, and we forecast it will increase by 1.2 million b/d this year and by 1.3 million b/d in 2027. Global liquid fuels consumption growth is driven almost entirely by non-OECD countries, which together grow by 1.1 million b/d in 2026 and 1.2 million b/d in 2027. We expect OECD consumption to grow slightly through 2027.
Most non-OECD growth is concentrated in Asia. We forecast total liquid fuels consumption in China increases by 0.2 million b/d in both 2026 and 2027. We expect India will increase its liquid fuels consumption by 0.3 million b/d in both forecast years.
Global liquid fuels production growth increased by an estimated 3.0 million b/d in 2025, and we expect that growth will slow to an average of 1.6 million b/d in 2026 and 0.9 million b/d in 2027. Global liquid fuels production growth in 2026 is driven by strong growth outside of OPEC+, primarily from countries in South America, along with higher crude oil production from OPEC+ members. Global liquid fuels production growth is driven mostly by countries outside of OPEC+ in 2027 as we assume OPEC+ targets will remain at 2026 levels and the group’s production will increase only slightly next year.
U.S. Petroleum Products
U.S. petroleum products consumption
We forecast U.S. consumption of distillate fuel oil and jet fuel will increase in 2026 and 2027, and U.S. motor gasoline consumption will decrease over the same period. These forecasts are driven by assumptions of increased manufacturing and trucking activity for distillate fuel oil, increased air travel for jet fuel, and a more fuel-efficient vehicle fleet for motor gasoline.
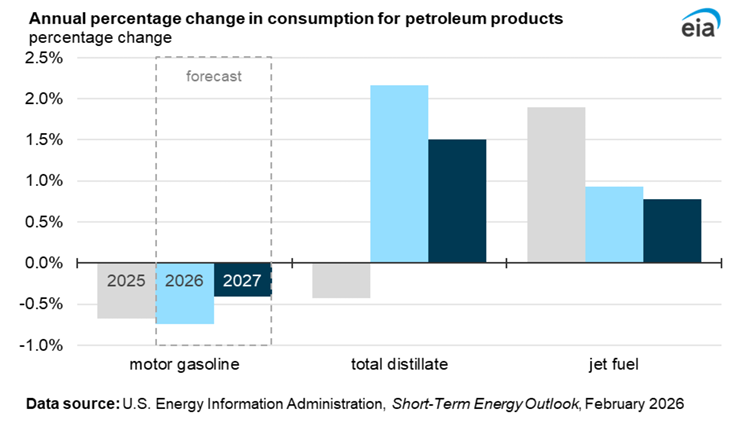
We forecast U.S. consumption of total distillate fuel oil—often marketed as diesel, which includes petroleum-based distillate fuel oil, renewable diesel, and biodiesel—to increase by around 2% in both 2026 and 2027, reaching record highs in 2027. Our forecast increase in U.S. distillate consumption is driven by our outlook for growing GDP and industrial activity based on the S&P Global macroeconomic model. We expect economic growth to increase distillate fuel oil demand from manufacturers and truckers who ship goods.
Increased air travel, measured both as passenger volume and flight departures, has increased U.S. jet fuel consumption every year following the steep decline in 2020. However, commercial air travel in 2025 showed slower growth than the 2010‒2019 average and the slowest rate of growth in any year since 2020. We expect growth will continue in our forecast as commercial activity continues to increase. We forecast jet fuel consumption to increase in the United States by about 1% in both 2026 and 2027.
Consumption of motor gasoline is the only one of the three primary transportation fuels that we expect will decline over the next two years. Fuel efficiency gains in the vehicle fleet have generally outpaced growth in driving since 2019, allowing drivers to travel more miles using less gasoline. We forecast U.S. motor gasoline consumption to decline about 1% in 2026 as fuel efficiency gains surpass increased driving activity, measured by vehicle miles traveled. We forecast gasoline consumption to further decrease in 2027, although we expect a slowing pace of decline because of more growth in driving activity as employment growth improves. Compared with 2019, we forecast about 5% less U.S. motor gasoline consumption in 2026 and 2027, despite more miles driven in both years than in 2019.
Components of U.S. distillate consumption
We expect growth in distillate consumption will be supplied mostly by biomass-based diesel fuels. As a result, demand for petroleum-based distillate grows much less than total distillate demand overall. In our forecast, we assume biomass-based diesel production will resume growth following lower production and lower net imports in 2025.
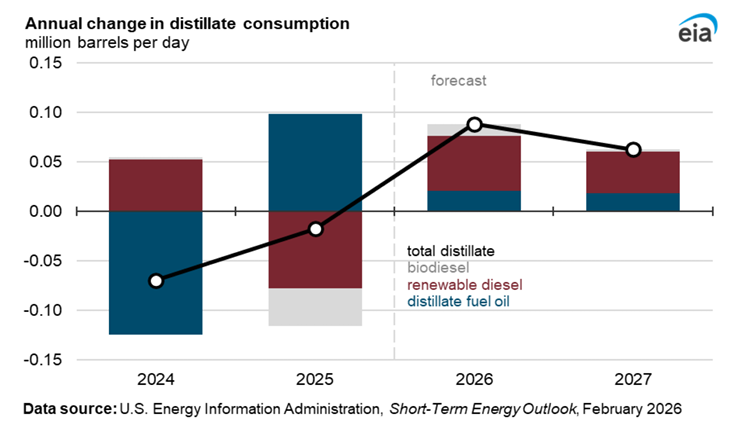
Renewable diesel and biodiesel are biomass-based diesel fuels that can replace petroleum-based distillate and be used to comply with renewable volume obligations (RVOs) in the Renewable Fuel Standard (RFS) administered by the U.S. Environmental Protection Agency (EPA). Biomass-based diesel product supplied increases nearly 70,000 barrels per day (b/d) from 2025 to 2026 and another 40,000 b/d from 2026 to 2027. This growth is driven by our assumption that RVOs in the forecast years will increase, incentivizing biomass-based diesel plant utilization close to pre-2025 levels. We may adjust this assumption as the EPA releases more RVO guidance for 2026 and 2027.
Natural Gas
Natural gas prices
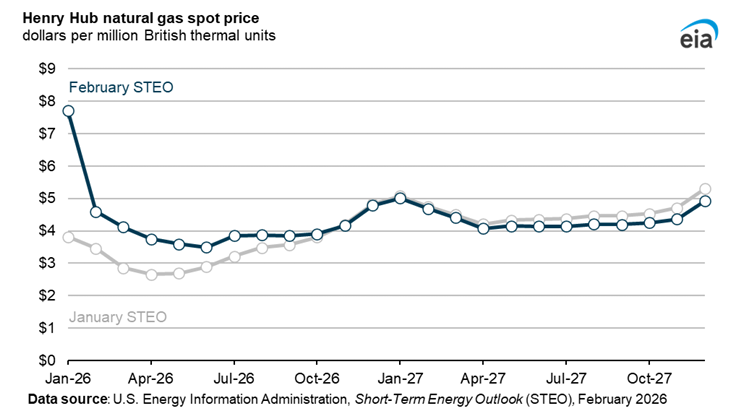
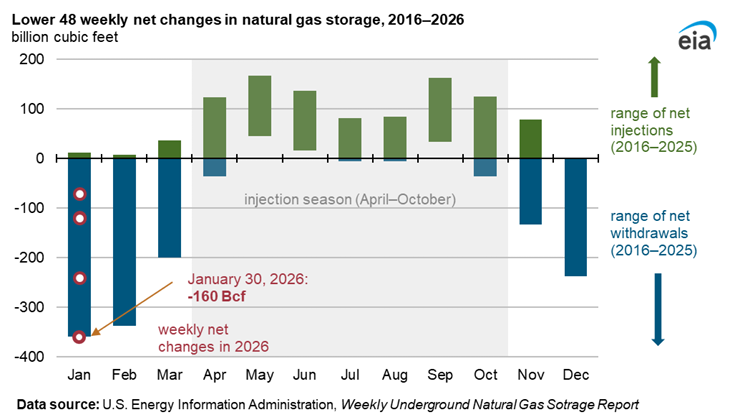
In January, the Henry Hub spot price for natural gas averaged $7.72 per million British thermal units (MMBtu), rising sharply from December’s average of $4.26/MMBtu and marking the highest nominal monthly average since September 2022. On a daily basis, pricing at the hub set a nominal record of $30.72/MMBtu on January 23. These price increases reflected stronger natural gas demand driven by widespread colder-than-normal weather across much of the United States, particularly in the latter half of the month. Winter Storm Fern intensified heating demand while natural gas production declined because of temporary well freeze-offs. For the week ending January 30, the combination of strong demand and a drop in production led to a withdrawal of 360 billion cubic feet (Bcf) of natural gas from inventory, the largest storage withdrawal on record.
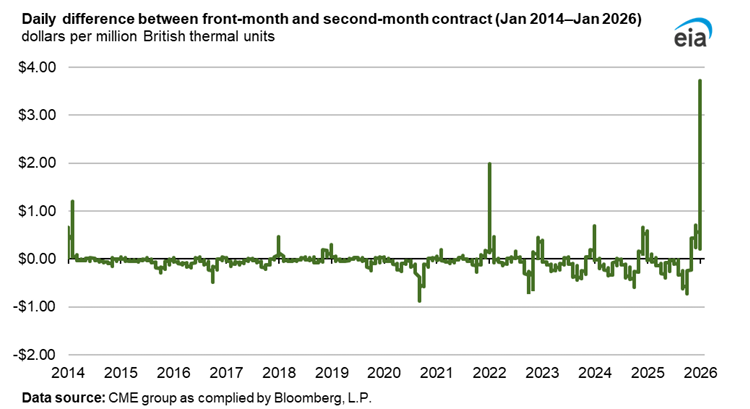
Although market tightness in January was acute, futures prices indicate the market perceived the tightness as relatively short-lived. The February futures price settled significantly higher than the March price on January 28. The February natural gas futures contract for delivery at Henry Hub settled at $7.46/MMBtu on January 28, while the March contract closed at $3.73/MMBtu, the largest difference between the front and following-month prices since at least 2014. On February 2, the new March 2026 prompt-month contract posted its largest one-day decline in 30 years, according to Bloomberg L.P, falling 25.7% to $3.24/MMBtu as some weather forecasts indicated relatively mild weather for much of the country in mid-February.
Looking ahead, the large storage withdrawals in late January mean we now expect the United States will end the withdrawal season in March with less natural gas in storage than we previously expected. Less natural gas in storage led us to raise our forecast for prices for much of this year. We expect the Henry Hub spot price will average $4.60/MMBtu in February and $4.12/MMBtu in March, up from forecasts of $3.46/MMBtu and $2.86/MMBtu, respectively, in last month’s outlook. However, the price increases relative to last month’s forecast moderate later in the year, and we expect the current high prices will encourage more natural gas-directed drilling and lead to higher natural gas production than we previously forecast. With more production, we lowered our price forecast for 2027. We now expect the Henry Hub spot price will average about $4.40/MMBtu next year, down 5% from our forecast last month.
Natural gas storage
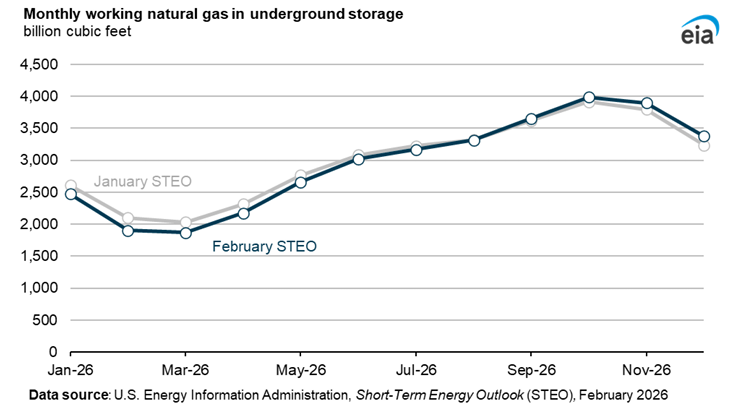
We expect almost 2,080 Bcf of natural gas will be pulled from storage this winter (November—March), 7% more than the five-year average draw. Based on data from the National Oceanic and Atmospheric Administration, we assume January had 5% more heating degree days (HDDs) than the 10-year average and 12% more HDDs compared with last month’s forecast. As a result of colder weather and more demand, we now expect natural gas inventories will end the withdrawal season 1% above the five-year average, whereas last month, we forecast stocks would end the season 10% above average.
Inventories in January fell across all regions. At the time of publication, inventories are lower relative to the five-year average in the East and Midwest regions and close to average in the South Central region. However, the Pacific region remains 30% above average, and the Mountain region is 34% above average.
January reported the largest weekly withdrawal on record of 360 Bcf for the week ending January 30. The cold weather had a significant effect on the South Central region, which increases its supply to other consuming regions when severe cold occurs. Withdrawals in that region comprised 44% of total U.S. withdrawals in that week.
Looking ahead, we expect natural gas inventories to rebuild more rapidly than the five-year average during injection season. As a result, we forecast storage balances to return to surplus relative to the five year average by the end of injection season (October).
Natural gas production
The cold snap led to a drop in natural gas production in January. We estimate that production fell by 4 Bcf/d (3%) from December to January, because of sustained, frigid weather conditions, mostly in the Northeast Appalachia region. However, most production was back online as of early February.
U.S. dry natural gas production in our forecast grows by 2% in 2026 or about 2 Bcf/d and then by 1%, or 1 Bcf/d, in 2027. We expect slower growth in the first half of 2026 (1H26) as weather-related disruptions and lack of sufficient Permian pipeline takeaway capacity affect production in the Lower 48 states. During 2H26, as new pipeline capacity comes online in the Permian, we expect production to ramp up. In 2027, we expect higher gas-oil ratios in the Permian region and increased drilling following higher natural gas prices in the Haynesville region to contribute to overall growth. We now forecast the United States will produce 110 Bcf/d of dry natural gas this year and more than 111 Bcf/d next year. Both of those forecasts are more than 1 Bcf/d higher than in last month’s STEO.
Electricity, Coal, and Renewables
Electricity generation
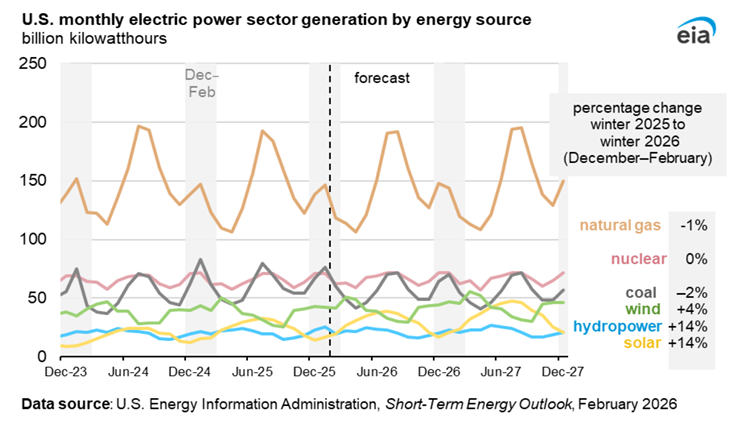
After cold weather in December, followed by Winter Storm Fern in the latter half of January, we expect electricity generation to total 1,072 billion kilowatthours (BKWh) in the winter months of December, January, and February, slightly exceeding electricity generation of 1,063 BKWh in the same period of 2024‒2025.
We expect 2% (3 BKWh) less coal generation from December through February, compared with the same period a year ago. During the same period, we expect 1% (6 BKWh) less electricity to be generated by natural gas because of high natural gas prices. Wind, hydropower, and solar also provide more generation this winter compared with last winter. Dispatchable generation—nuclear, coal, natural gas, and even petroleum—will continue to supply electric energy during periods of peak demand, as seen during Winter Storm Fern.
Higher electricity demand drives increases in annual U.S. electricity generation throughout 2026 and 2027, particularly in the parts of the grid managed by the Electric Reliability Council of Texas (ERCOT) and by the PJM Interconnection, where data center growth and capacity additions are concentrated. We expect total U.S. electricity generation to increase 1.4% in 2026 and 2.5% in 2027, after growing by 2.7% in 2025.
Much of the growth in demand will be met by growth in generation from renewable sources of energy. We expect utility-scale solar generation to be a leading source of growth in electricity generation, rising by 17% in 2026 and by a further 23% in 2027. We also expect wind generation to rise 6% in 2026 and 7% in 2027. The growth in renewable generation comes as 69 gigawatts (GW) of solar capacity and 19 GW of wind capacity get connected to the grid in 2026 and 2027. Hydro generation is also expected to rise 3% in both 2026 and 2027 after historically dry summers in 2024 and 2025. We have updated our model to account for more recent information about typical renewable energy capacity factors, which has contributed to a slight decline in our growth forecasts for solar and wind compared with our last STEO.
We expect natural gas generation to be nearly flat in 2026 and rise by 1% in 2027, while coal generation falls by 6% in 2026 and by 4% in 2027, as some coal plants retire or remain idle while still connected to the grid. We don’t expect coal generation to fall as much in the forecast as we did in the last STEO because of an increase in our forecast prices for natural gas.
Coal markets
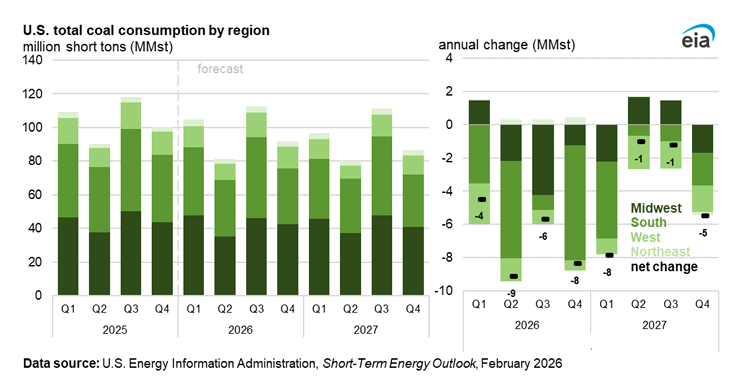
The U.S. coal fleet increased generation during January to meet peak demand during Winter Storm Fern. We estimate that coal consumption totaled 46 million short tons (MMst) in January, 4 MMst more than we expected in the January STEO. Electric power consumption accounts for about 90% of total coal consumption and totaled 43 MMst in January. Coal consumption increased in all four census regions, with the largest increases occurring in the South and the Midwest when compared with December 2025 levels. In addition to increasing consumption, January’s cold temperatures lowered coal production. We are now forecasting coal production to total 46 MMst in January, 3 MMSt less than we forecast last month. More consumption combined with lower production caused a drop in coal stockpiles compared with our January STEO.
We expect U.S. coal consumption in the electric power sector to total 391 MMst in 2026, 15 MMst higher than the January STEO, but a 7% year-on-year decline. In addition to the strong demand in January, we expect more coal consumption this year than we did last month because natural gas prices are expected to be higher than we forecast last month for much of 2026. We anticipate total consumption to decline further to 375 MMst in 2027.
We expect declines in electric power sector coal consumption for most regions across all quarters of 2026 and into 2027. As temperatures moderate following January’s cold snap, coal consumption in the first quarter of 2026 (1Q26) will total 105 MMst, about 4% lower than 1Q25. The largest decrease in consumption will occur in 2Q26 as milder weather lowers electric power demand and as natural gas prices decline from winter highs. Total coal consumption in 2Q26 is expected to be 81 MMst, a 10% decline compared with 2Q25.
Because we raised our forecast for coal consumption, we also raised our forecast for coal production this year. U.S. coal production in our forecast totals 520 MMst in 2026, 13 MMst higher than we expected in our January forecast but down 2.5% from 2025. This follows an annual increase in coal production from 513 MMst in 2024 to 533 MMst in 2025. In 2027, we expect production to decline 4% to 501 MMst.
Economy, CO2, and Weather
U.S. macroeconomics
To generate the macroeconomic assumptions in the Short-Term Energy Outlook (STEO), we input STEO energy price forecasts into S&P Global’s macroeconomic model and produce a conditional forecast.
Emissions
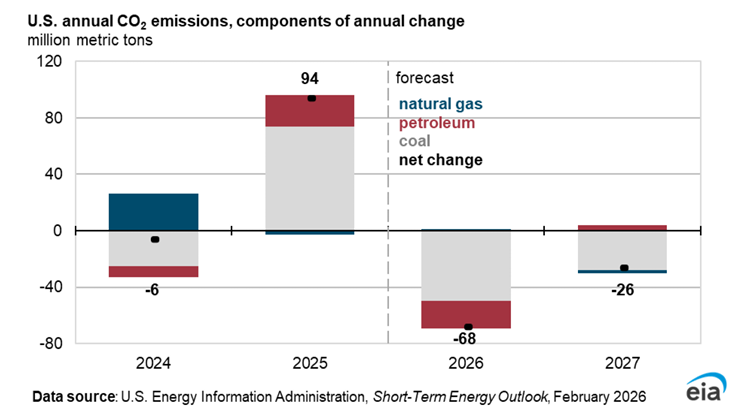
We forecast U.S. energy-related carbon dioxide (CO2) emissions to decrease by 1.4% in 2026 relative to 2025 and to decrease by an additional 0.5% in 2027 relative to 2026. In both years, decreases in CO2 emissions are due primarily to expected declines in coal consumption, most of which occurs at power plants for electricity generation.
Weather
The United States experienced colder-than-normal temperatures toward the end of January as Winter Storm Fern affected significant portions of the country. As a result, we have revised our heating degree day (HDD) forecast for the 2025‒2026 winter heating season (November—March) up by 5%, supported by an 12% increase in January HDDs, compared with the January STEO. The cooler-than-normal temperatures are expected to extend into the first week of February, increasing overall demand for space heating this winter.
Based on our current forecasts and data from the National Oceanic and Atmospheric Administration, we forecast that the United States will average around 2,117 HDDs in the first quarter of 2026, 5% more HDDs than the 10-year average. Overall, we expect this winter will average around 3,330 HDDs, 3% more than both the previous winter and the 10-year winter average.
Comments