 English
 پارسی


Broader U.S. Growth and Improved Hiring, but Persistent Consumer, Cost and Credit Pressures
Executive Summary
The Federal Reserve’s July 2026 Beige Book presents a U.S. economy that is expanding more broadly than it was in the previous reporting cycle, but not necessarily growing much faster. Economic activity increased at a slight-to-moderate pace in 11 of the 12 Federal Reserve Districts, compared with growth in ten Districts, no change in one, and contraction in one in the previous report.
The most important positive change was in the labor market. Five Districts reported meaningful employment growth, compared with only one District in the previous Beige Book. Hiring strengthened in manufacturing, construction, retail, health care, and transportation, although many employers continued to recruit selectively rather than launch broad workforce expansions.
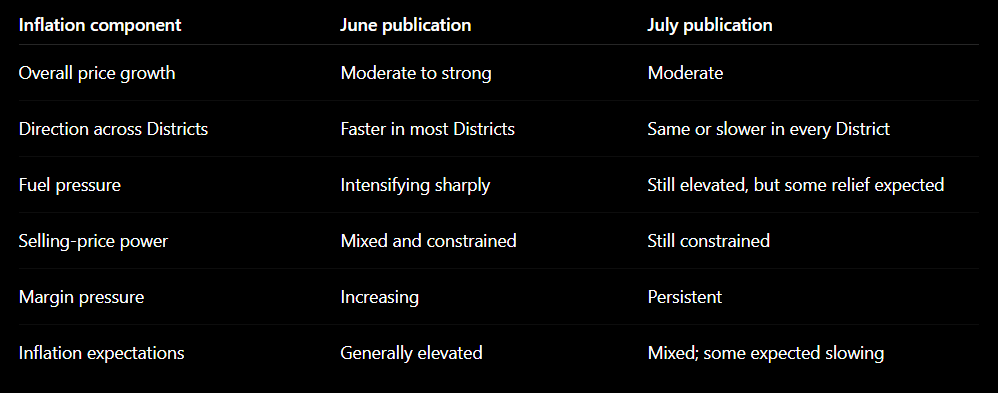
Inflation conditions also improved at the margin. Prices still rose across all Districts, but the national pace was described as moderate, and price growth was unchanged or slower in every District compared with the previous period. This represents a significant improvement from the June 3 publication, which described inflation as moderate to strong and said most Districts had experienced faster inflation.
However, the report does not describe a fully healthy or balanced economy. Consumers remained highly price-sensitive, low- and middle-income households continued to trade down, consumer credit quality weakened slightly, agriculture deteriorated, and businesses continued to face elevated costs for energy, transportation, tariffs, insurance, and raw materials.
The central message is therefore:
The U.S. economy gained breadth and labor-market momentum while inflation pressure moderated, but growth remained uneven and increasingly dependent on capital-intensive sectors such as data centers, AI infrastructure, defense, machinery and energy.
The July Beige Book was published on July 15, 2026, using information collected through July 6 and primarily describing conditions during late May and June. The comparison report was published on June 3, although its cover is labeled May 2026, and incorporated information collected through May 27. The Beige Book is qualitative and anecdotal and does not represent the official views of Federal Reserve policymakers.
1. Overall U.S. Economic Activity
Growth broadened, but the pace remained restrained
Economic activity expanded in 11 Districts, up from ten in the previous report. Only the San Francisco District reported broadly unchanged conditions, although activity there was described as muted.
This is a meaningful improvement in the geographical breadth of growth. Nevertheless, the Fed itself noted that the overall pace was close to the previous reporting period. The July report therefore signals broader stabilization rather than a powerful national acceleration.
Regional performance was uneven:
- Dallas and Richmond reported moderate growth.
- New York, Cleveland, Atlanta and Chicago reported modest growth.
- Boston, Philadelphia, St. Louis, Minneapolis and Kansas City reported slight growth.
- San Francisco reported stable but muted activity.
The composition of growth also changed. Consumer activity remained fragile, while manufacturing, data-center investment, defense production, machinery, health care and selected professional services provided stronger support.
Compared with June, the outlook became moderately more constructive. In the previous report, businesses generally expected little change over the following six months because of uncertainty and weakening consumer demand. In July, contacts generally expected continued expansion, although fuel prices, tariffs, geopolitical conditions and input costs remained major sources of uncertainty.
Assessment
The economy appears to have moved away from the more stagflationary configuration described in June—weakening consumers, nearly flat employment and accelerating costs—but it has not entered a strong, broad-based expansion.
Growth is increasingly divided into two economic tracks:
- Capital-intensive sectors, including AI infrastructure, data centers, defense, energy and advanced manufacturing, are expanding.
- Consumer-facing and lower-margin sectors remain constrained by affordability pressure and weak pricing power.
2. Consumer Spending
Spending increased slightly, but household caution remained visible
Consumer spending edged higher nationally, helped by tourism, major sporting events and resilient higher-income spending. World Cup-related travel supported hotels, bars, restaurants and short-term rentals in cities such as Boston, New York, Philadelphia, Atlanta, Miami and several western markets.
However, the underlying consumer picture remained fragile.
Contacts repeatedly reported:
- Trading down to cheaper products
- Reduced discretionary purchases
- More frequent shopping trips but smaller purchases per visit
- Longer intervals between services and appointments
- Delayed vehicle purchases
- Increased spending on vehicle repairs
- Growing use of short-term loans and buy-now-pay-later financing
- Increased credit card balances
- Greater demand for food, housing and transportation assistance
The weakness was no longer confined entirely to low-income households. Richmond and Atlanta reported changes in behaviour among some higher-income consumers, including reduced alcohol spending, fewer optional services and greater preference for value.
Auto demand remained particularly constrained by high vehicle prices, financing costs and fuel expenses. Consumers continued holding vehicles for longer, supporting repair and parts businesses at the expense of new vehicle sales.
Comparison with June
The June report described spending as mixed and increasingly divided by income. The July report showed a modest improvement in headline spending, but the same affordability problems persisted.
The difference was mainly that:
- Tourism and event-related spending improved.
- Retail conditions stabilized in several Districts.
- Dallas reported an outright improvement in retail sales.
- Philadelphia auto sales stabilized after declining.
- World Cup activity temporarily supported hospitality.
However, consumer fundamentals did not improve enough to eliminate concerns about household financial stress.
Analysis
The tourism increase should not be treated as evidence of a durable consumer reacceleration. Part of the improvement came from temporary World Cup demand and other major events.
The stronger signal is that consumers were still spending, but reallocating budgets toward necessities, value products, repairs and experiences perceived as worthwhile. This environment favours discount retailers, repair providers, affordable travel and essential services while challenging mid-market discretionary businesses.
3. Labor Market Conditions
The clearest improvement from the previous report
Employment rose on balance. Five Districts reported modest, moderate or solid gains, compared with only one District in the previous Beige Book.
Notable improvements included:
- New York: Larger businesses began hiring for growth rather than merely replacing departing employees.
- Richmond: Employment moved from unchanged to modest growth.
- Chicago: Employment accelerated from slight to modest growth.
- Minneapolis: Employment improved from slight to modest growth.
- Dallas: Employment growth became solid, with staffing firms reporting broad-based demand.
- Kansas City: Manufacturing led a slight increase in employment.
Philadelphia remained a weak point, with employment continuing to decline slightly. Atlanta and San Francisco reported broadly stable employment, while Boston and St. Louis were also little changed.
Skilled labour remained scarce
Despite broader labour availability in some regions, employers continued to report difficulty hiring:
- Electricians
- Welders
- Machine operators
- Technicians
- Engineers
- Licensed health-care professionals
- Skilled construction workers
- Experienced financial-services and technology personnel
Data-center development created particularly strong demand for electricians, technicians, transformers, power infrastructure and construction labour. Competition from energy, AI and power-generation projects increased wage pressure for technical workers.
Wage growth
Wages generally rose at a modest-to-moderate pace. Broad wage inflation remained contained, but targeted wage pressure was significant in hard-to-fill occupations.
Examples included:
- Pay increases for skilled manufacturing workers
- Higher compensation for technicians and tradespeople
- Cost-of-living adjustments linked to fuel and housing expenses
- Bonuses and flexible-work arrangements to retain staff
- Increased recruitment fees in the Dallas District
Dallas firms expected wages to rise approximately 3.5% over the following 12 months, up from 3.1% in March.
AI and employment
AI appeared across several District reports in three distinct ways:
- Recruitment and screening: Employers increasingly used AI to process applications.
- Productivity: Businesses invested in AI tools to raise output without proportionately increasing employment.
- Workforce displacement: Some isolated white-collar layoffs or reductions in entry-level opportunities were attributed to AI-related efficiency gains.
The evidence does not yet indicate widespread AI-driven job destruction. Instead, AI is changing job composition, reducing some administrative needs while raising demand for technical, electrical, engineering and infrastructure workers.
Analysis
The labour section is moderately hawkish from a monetary-policy perspective. Hiring improved substantially, and skilled-worker shortages remained evident.
However, the labour market was not uniformly tight. Many firms remained in a selective low-hire, low-fire posture, turnover was low, and employers were still reluctant to expand payrolls without clear demand.
4. Inflation and Business Costs
Headline price pressure moderated
Prices increased moderately overall:
- Nine Districts: Moderate price growth
- Two Districts: Robust price growth
- One District: Slight price growth
Most importantly, price growth was unchanged or slower in every District compared with the previous reporting period.
In June, prices had risen at a moderate-to-strong pace, and most Districts reported an acceleration. By July, Chicago and Minneapolis had moved from rapid or sharp price increases to moderate increases, while overall national inflation pressure had clearly eased.
Cost pressure remained elevated beneath the surface
The improvement in headline pricing did not mean that businesses were experiencing normal cost conditions.
Common cost pressures included:
- Fuel and transportation
- Freight surcharges
- Steel and aluminium tariffs
- Electronic components
- Petrochemicals, resins and adhesives
- Fertilizer
- Insurance
- Electricity
- Food and animal protein
- Construction machinery
- Data-center equipment and transformers
The Middle East conflict and associated fuel-price volatility remained significant factors. Tariffs were also cited repeatedly, particularly in manufacturing, metals, machinery and electronic components.
Margin compression
Many firms reported that input costs were rising faster than final selling prices. Consumer resistance prevented businesses from passing through the full increase.
Businesses responded by:
- Raising prices selectively
- Reducing product variety
- Changing product mixes
- Negotiating contract escalation clauses
- Cutting overtime or staffing hours
- Investing in automation
- Diversifying suppliers
- Delaying capital expenditure
- Accepting temporarily lower margins
Richmond manufacturers reported input-price growth near 7%, while their selling prices changed relatively little. Dallas businesses expected input prices to rise 3.7% over the next year, compared with expected selling-price growth of 2.8%.
Comparison with June
The inflation comparison is the greatest improvement in the July report.
Analysis
This is a disinflationary improvement, not a return to price stability.
The report suggests that the first-round energy shock was no longer accelerating at the same rate. Nevertheless, tariffs, insurance, infrastructure bottlenecks and supply-chain disruptions continued to create persistent cost pressure.
The inflation signal is therefore mixed:
- Better for headline inflation momentum
- Still problematic for corporate margins
- Potentially persistent in services, tariffs and infrastructure
- Highly dependent on future fuel prices
5. Manufacturing and Capital Investment
One of the strongest parts of the economy
Manufacturing production grew modestly to moderately in most Districts. Demand was especially strong in:
- Data-center equipment
- Electrical infrastructure
- Defense
- Aerospace
- Machinery
- Industrial automation
- Metals
- Power generation
- LNG-related fabrication
- Computer manufacturing
Data centers were mentioned throughout the report as a source of demand for steel, electrical components, transformers, technicians, land, energy, and commercial construction.
Philadelphia contacts described the economy as increasingly driven by capital expenditure rather than traditional consumer spending. This observation captures one of the report’s most important themes.
Manufacturing momentum was positive but slightly cooler
Manufacturing remained strong nationally, but some Districts experienced a moderation compared with June:
- New York moved from strong to modest manufacturing growth.
- Cleveland moved from robust to moderate demand growth.
- Richmond moved from moderate to modest growth.
- Dallas manufacturing slowed to a modest pace.
The moderation was offset by continued strength in Chicago, Minneapolis, Kansas City, Atlanta and selected sectors in other Districts.
Supply chains became more difficult
Manufacturers reported:
- Longer delivery times
- Reduced electronic-component availability
- Difficulty sourcing materials from China
- Paper and packaging shortages
- Higher freight rates
- Steel, aluminium and copper cost volatility
- Tariff-related inventory and sourcing changes
Some businesses shifted from imported to domestic materials as pre-existing inventories were depleted. Others delayed projects because of tariff uncertainty or infrastructure costs.
Analysis
Manufacturing is providing a counterweight to weak consumer demand, but the expansion is concentrated.
The strongest areas are connected to strategic investment and government or corporate capital expenditure rather than broad household consumption. That concentration creates vulnerability if AI, data-center or defense investment slows.
6. Services, Travel and Tourism
Service-sector activity rose modestly overall, led by:
- Health care
- Professional services
- Information services
- Staffing
- Transportation
- Legal and accounting services
- Security and laboratory testing
New York experienced an important service-sector improvement after a prolonged period of weakness. Philadelphia nonmanufacturing activity also recovered, while Dallas reported accelerating nonfinancial services activity.
Business services remained more cautious. Economic and policy uncertainty continued to delay consulting, engineering, legal and capital-project decisions.
Tourism
Tourism improved, helped significantly by the World Cup. Luxury and upscale travel generally remained resilient, but budget-conscious behaviour was visible across income groups.
Contacts reported:
- Shorter booking windows
- Greater use of discounts
- Reduced onboard cruise spending
- Weaker international travel from Canada in some northern regions
- Strong weekend travel but softer local restaurant and entertainment spending
- Better performance at properties emphasizing affordability
Analysis
Service-sector recovery broadened the economy beyond manufacturing. Nevertheless, part of the tourism improvement was event-driven and may not continue after major tournaments and celebrations conclude.
7. Construction and Real Estate
Overall conditions improved slightly
Construction and real estate activity increased slightly nationally, improving from the more mixed conditions in the previous report.
The strongest construction areas were:
- Data centers
- Energy infrastructure
- Electricity generation
- Warehouses in selected industrial markets
- Institutional projects
- Defense and advanced-manufacturing facilities
Residential real estate
Residential conditions remained constrained by:
- High mortgage rates
- Low inventory
- Elevated asking prices
- High construction costs
- Buyer affordability problems
- Mortgage-rate lock-in
- Weak first-time buyer demand
Regional differences were substantial:
- Cleveland reported robust residential activity.
- Richmond experienced a delayed but meaningful seasonal pickup.
- New York housing demand strengthened, but inventory remained limited.
- Dallas home sales remained sluggish, with builders using discounts and mortgage-rate buydowns.
- California sales were muted by high prices and limited supply.
- Atlanta builders reduced expectations despite aggressive incentives.
Repair and renovation demand benefited as households chose to remain in existing homes rather than move.
Commercial property
Commercial conditions varied by segment:
- Class A offices benefited from a flight to quality.
- Lower-quality offices continued facing refinancing and vacancy problems.
- AI-related firms supported Manhattan office demand.
- Data centers and industrial infrastructure remained strong.
- Multifamily markets in several Districts faced high vacancy rates, concessions or possible overbuilding.
- Traditional warehousing softened in some regions.
- Commercial-property financing remained difficult for new or highly leveraged projects.
Analysis
Real estate is no longer contracting uniformly, but interest rates continue to prevent a broad recovery. The sector is becoming increasingly segmented between well-capitalized, high-quality or technology-related projects and conventional developments facing financing constraints.
8. Banking, Credit and Financial Conditions
Financial conditions were stable on balance, while commercial and consumer loan volumes increased modestly.
Positive developments included:
- Stronger commercial loan pipelines in several regions
- Increased capital-expenditure and acquisition financing
- Improved mortgage demand in parts of Kansas City
- Notable loan growth in Dallas
- Stable commercial credit quality nationally
However, consumer credit quality weakened slightly.
Signs of stress included:
- Rising mortgage delinquencies in some Districts
- Greater credit card use for necessities
- Negative equity on auto trade-ins
- Increased demand for small-dollar loans
- Greater reliance on home-equity lines
- Weak auto lending
- Increased short-term personal borrowing
- Emerging stress among lower-income borrowers and small businesses
- Deterioration in some agricultural loans and commercial real-estate exposures
Comparison with June
The June report already noted increasing mortgage, consumer and agricultural delinquencies in several Districts. The July report showed stronger loan demand but did not eliminate those credit-quality concerns.
The credit story can therefore be summarized as:
More borrowing activity, but a slightly weaker household borrower.
There was no evidence of broad systemic banking deterioration. Commercial loan quality remained generally stable, and most delinquency increases were described as manageable or concentrated in vulnerable borrower groups.
9. Energy and Transportation
Energy
Oil and gas drilling increased during the reporting period.
- Kansas City reported a moderate increase in activity.
- Dallas reported higher drilling and more positive near-term sentiment.
- Atlanta described energy conditions as stable.
- Industrial energy demand remained strong because of data-center and AI-infrastructure investment.
Companies increased selected capital-spending plans, but most were not preparing for a major drilling surge. Price volatility, financing constraints, equipment availability, electricity access and water-disposal capacity continued limiting expansion.
Transportation
Transportation activity increased modestly.
Important developments included:
- Higher freight and fuel costs
- Route realignments following tariffs and Middle East disruptions
- Increased imports and some demand being pulled forward
- Higher ocean freight rates
- Tighter trucking capacity
- More rail usage as fuel costs made trucking less attractive
- Improved freight demand from machinery, data centers, defense and aerospace
Transportation remained stronger for industrial and capital goods than for housing-related shipments.
Analysis
The energy and freight sectors benefited from higher activity and strategic supply-chain adjustments. However, their improved revenues came with high operating costs and continued geopolitical risk.
10. Agriculture
Agriculture was the weakest major sector in the July Beige Book.
Conditions deteriorated because of:
- Lower crop prices
- High fertilizer and fuel costs
- Tight credit
- Drought in several western and southern regions
- Weak export demand
- Trade-policy changes
- Rising equipment costs
- Consecutive operating losses for some farmers
Atlanta reported severe stress among row-crop producers. Minneapolis described deteriorating conditions. San Francisco contacts characterized some agricultural regions as being in recession. Kansas City reported that strong cattle prices supported livestock producers, but crop profitability remained weak. Dallas conditions improved after rainfall, although high costs continued to pressure farmers.
Comparison with June
Agriculture was already weak or unchanged in most Districts in the June publication. July showed a clearer deterioration, with lower commodity prices becoming an increasingly important problem alongside high input costs.
This means the agricultural squeeze changed from primarily a cost shock into a combination of:
- High expenses
- Weak output prices
- Tight financing
- Adverse weather
11. Community and Household Conditions
Community organizations reported rising demand for:
- Food assistance
- Housing support
- Health-care supplies
- Transportation assistance
- Utility assistance
- Workforce training
- Small emergency loans
At the same time, many nonprofits faced reduced federal or state funding, higher operating expenses and increased demand.
Examples included:
- Food-pantry reliance increasing in Boston
- Affordable-housing waitlists and funding gaps in New York
- Reduced training-program capacity in Cleveland
- Higher meal demand in St. Louis
- Food-assistance demand in Dallas exceeding levels seen during the financial crisis and pandemic
- Nonprofit staffing and service cuts in San Francisco
This section reinforces the consumer and credit findings: aggregate economic growth did not translate into improved financial security for many lower-income households.
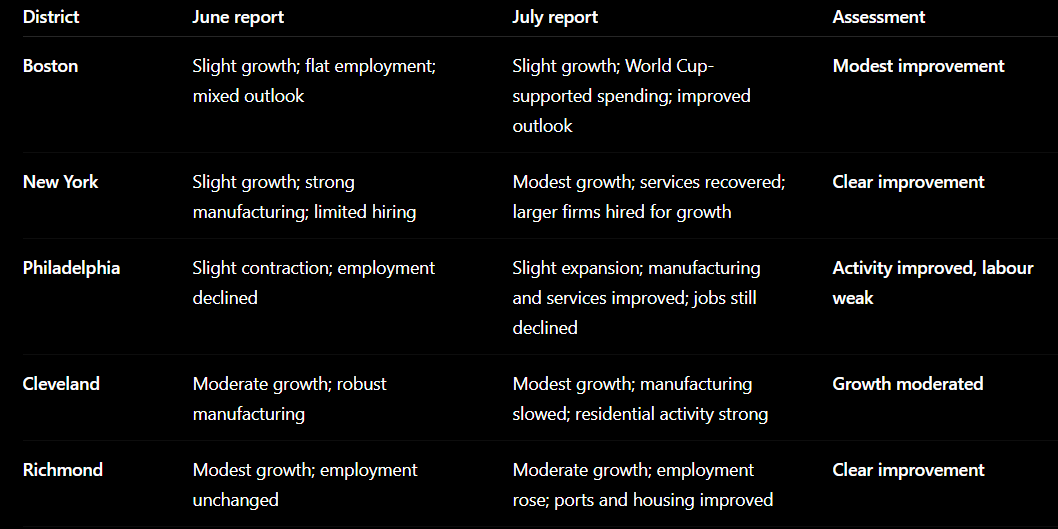
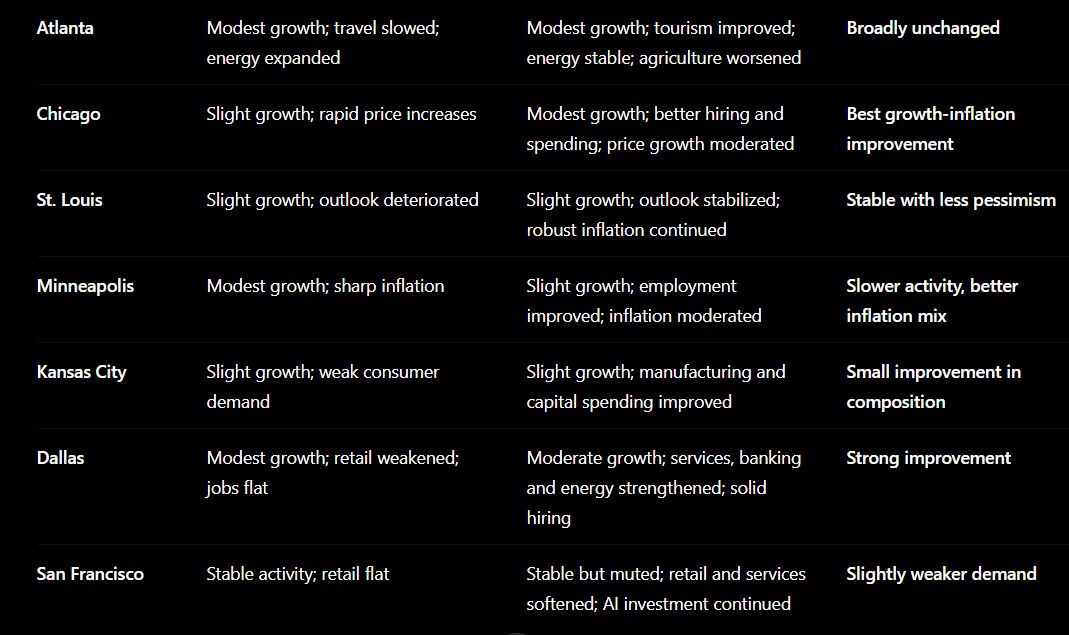
12. District-by-District Comparison
The following table compares the June 3 publication with the July 15 report.
13. Monetary-Policy Interpretation
The July Beige Book is less stagflationary than the June publication.
Three developments support that conclusion:
- Economic expansion broadened from ten to eleven Districts.
- Employment gains spread from one District to five.
- Price growth slowed or remained unchanged in every District.
However, the report is not decisively dovish.
Inflation continued at a moderate pace, skilled labour remained scarce, wage pressure persisted in technical occupations, and tariffs and infrastructure costs could maintain inflation even if fuel prices decline. Economic activity also remained positive in nearly all regions.
The most reasonable policy interpretation is therefore:
The report supports patience rather than an urgent policy shift.
It reduces concern about immediate stagflation because employment and output improved while inflation momentum softened. At the same time, it provides little evidence that price pressure has fully normalized or that the labour market has weakened enough to require rapid monetary easing.
14. Financial-Market Interpretation
U.S. dollar and Treasury yields
The combination of broader employment growth and continuing economic expansion is moderately supportive of the dollar and could limit aggressive expectations for near-term monetary easing.
The inflation moderation partially offsets that effect, particularly if future reports confirm declining fuel and transportation costs.
Overall signal: Neutral to mildly supportive for the dollar; mixed for Treasury yields.
Equities
The Beige Book favours sectors connected to:
- AI infrastructure
- Data centers
- Electrical equipment
- Power generation
- Defense
- Aerospace
- Machinery
- Industrial automation
- Health care
It is less supportive for:
- Lower-margin discretionary retailers
- Auto dealers
- Highly leveraged commercial real estate
- Agriculture
- Businesses dependent on lower-income household spending
- Companies unable to pass through tariff and energy costs
Credit
Commercial credit conditions appeared stable, but consumer and small-business credit risks continued to rise gradually.
This is not a systemic credit warning, but it suggests increasing differentiation between strong corporate borrowers and financially constrained households or smaller firms.
Final Assessment
The July 2026 Beige Book describes an economy that improved in several important respects compared with the June 3 publication.
Growth became more geographically widespread, employment conditions strengthened and inflation momentum moderated. New York, Richmond, Chicago and Dallas recorded particularly notable improvements, while Philadelphia returned to growth after contracting slightly.
Nevertheless, the expansion remained narrow in composition. Data centers, AI infrastructure, defense, machinery, energy and health care carried an increasing share of economic momentum. Household consumption remained constrained by affordability problems, consumer credit quality weakened slightly and agriculture deteriorated.
The report’s central macroeconomic balance can be summarized as follows:
- Economic growth: Positive and broader, but still moderate
- Labour market: Improving, especially for skilled occupations
- Inflation: Slowing but still elevated
- Consumer conditions: Resilient in aggregate but financially stressed beneath the surface
- Manufacturing: Expanding, led by capital expenditure
- Real estate: Stabilizing but constrained by rates and financing
- Banking: Stable, with modestly weaker consumer credit
- Energy: Improving cautiously
- Agriculture: Deteriorating
- Business outlook: More positive, but uncertainty remains high
Overall, the July report is moderately constructive for the U.S. growth outlook and somewhat reassuring on inflation, but it does not eliminate the risks associated with tariffs, fuel prices, household financial stress or uneven sectoral performance.
Frequently Asked Questions
1. What did the Federal Reserve’s July 2026 Beige Book show about the U.S. economy?
The report showed that U.S. economic activity increased at a slight-to-mod
erate pace in 11 of the 12 Federal Reserve Districts. Growth became more geographically widespread, although the overall pace remained moderate and uneven across industries.
2. How did the July 2026 Beige Book differ from the previous report?
Compared with the June publication, economic growth expanded to more Districts, employment gains became substantially more widespread, and price growth slowed or remained unchanged in every District. However, consumer financial stress and agricultural weakness persisted.
3. Did inflation improve in the July 2026 Beige Book?
Yes. Prices increased moderately overall, and inflation was unchanged or slower in every Federal Reserve District compared with the previous period. Nevertheless, fuel, tariffs, freight, insurance and raw-material costs continued to pressure businesses.
4. What did the Beige Book say about the U.S. labor market?
Employment rose on balance, with five Districts reporting modest, moderate or solid gains, compared with only one District in the previous report. Skilled workers, including electricians, technicians, engineers and health-care professionals, remained difficult to find.
5. How were U.S. consumers performing in July 2026?
Consumer spending increased slightly, helped by tourism and World Cup-related activity. However, many households traded down to cheaper goods, reduced discretionary purchases, delayed vehicle purchases, and increased their use of credit and short-term financing.
6. Which sectors were the strongest in the July Beige Book?
The strongest areas included data centers, artificial-intelligence infrastructure, defense, aerospace, machinery, electrical equipment, power generation, and health care. These capital-intensive sectors increasingly supported economic growth as consumer demand remained restrained.
7. What role did artificial intelligence play in the Beige Book?
AI supported demand for data centers, electricity infrastructure, construction, advanced manufacturing, and technical workers. Companies also used AI for recruitment, employee productivity and automation, although widespread AI-related job losses were not reported.
8. What did the report say about U.S. manufacturing?
Manufacturing activity grew modestly to moderately across most Districts, supported by data center development, defense, aerospace, and machinery orders. However, supply shortages, tariffs, rising freight costs and difficulty sourcing electronic components created challenges.
9. What were the main problems in the U.S. real-estate market?
High mortgage rates, limited housing inventory, elevated construction costs, and affordability problems continued to restrict residential activity. Commercial real estate remained divided between strong data-center and high-quality office projects and weaker lower-grade offices and leveraged developments.
10. Were U.S. banking and credit conditions stable?
Financial conditions were broadly stable, and commercial and consumer lending increased modestly. Commercial credit quality remained stable, but consumer credit quality weakened slightly as some Districts reported higher mortgage delinquencies, credit card use, and demand for short-term loans.
11. Why did agricultural conditions deteriorate?
Agricultural conditions weakened because of lower commodity prices, high fertilizer and fuel costs, tighter credit, weak export demand, and adverse weather in some regions. Crop producers generally faced more pressure than livestock producers.
12. What does the July Beige Book mean for Federal Reserve policy?
The report supports a patient and cautious monetary-policy approach. Broader growth and stronger employment reduce the need for urgent monetary easing, while moderating inflation provides some reassurance. However, persistent tariff, fuel, wage and infrastructure costs argue against rapid policy changes.
13. Is the July 2026 Beige Book bullish or bearish for the U.S. dollar?
The report is neutral to mildly supportive for the U.S. dollar. Stronger hiring and broader economic growth may limit expectations for rapid interest-rate cuts, although slower inflation could partially offset the dollar-positive effect.
14. Which stock-market sectors could benefit from the report?
Sectors linked to AI infrastructure, electrical equipment, data centers, defense, aerospace, machinery, power generation and health care may benefit. Consumer-discretionary businesses, agriculture, and highly leveraged commercial real estate companies face greater risks.
15. What is the main conclusion of the July 2026 Beige Book?
The U.S. economy became more resilient and geographically balanced, while employment strengthened and inflation moderated. Nevertheless, growth remained uneven, consumers faced financial pressure and economic momentum depended heavily on capital-intensive industries.
Comments