
 English
 پارسی

IEA Oil Market Report August 2026: Full Analysis, July Comparison and Market Effects
Key takeaways
- The IEA increased its forecast for the 2026 global oil-demand contraction from approximately 1.0 million barrels per day to 1.6 million barrels per day.
- The estimated third-quarter oil-market deficit more than doubled from approximately 0.8 mb/d to 1.8 mb/d.
- Global oil supply is forecast to decline by 4.3 mb/d in 2026, before rebounding by 8.3 mb/d in 2027.
- Global observed oil inventories fell by 69 million barrels in July.
- Refined-product markets, particularly diesel and jet fuel, remain tighter than the crude-oil market.
- The Strait of Hormuz remains the single most important variable for global oil prices.
- The near-term physical balance is bullish, but the expected 2027 supply recovery creates a potentially bearish medium-term outlook.
- OPEC, the IEA and the EIA disagree significantly about the depth of the 2026 demand shock, but all expect demand and production to recover strongly in 2027.
Executive summary: What does the August 2026 oil report tell us?
The August data describe an unusual oil shock in which three apparently contradictory conditions coexist:
- Global crude and refined-product supply remains severely constrained.
- High prices and product shortages are destroying demand.
- The market could move from a substantial third-quarter deficit to surplus once shipping and production recover.
The IEA made its August outlook materially more pessimistic than July:
- Forecast 2026 demand contraction deepened from approximately 1.0 mb/d to 1.6 mb/d.
- The estimated third-quarter supply deficit increased from approximately 0.8 mb/d to 1.8 mb/d.
- Forecast 2026 supply was lowered from 102.6 mb/d to 102.0 mb/d.
- July inventories fell by 69 million barrels, reversing June’s 21-million-barrel increase.
- The 2027 supply recovery was raised to 8.3 mb/d, taking global output to 110.3 mb/d.
- The expected 2027 demand rebound was raised from 2.0 mb/d to 2.4 mb/d.
The central conclusion is therefore:
The oil market is physically bullish in the immediate term, especially for diesel and jet fuel, but potentially bearish over the medium term if the Strait of Hormuz reopens and the unusually large volume of shut-in production returns.
The geopolitical premium cannot be analysed separately from demand. The closure of trade routes is simultaneously reducing supply, raising prices, interrupting product availability, and reducing consumption.
IEA July vs August 2026: What changed in the oil-market outlook?
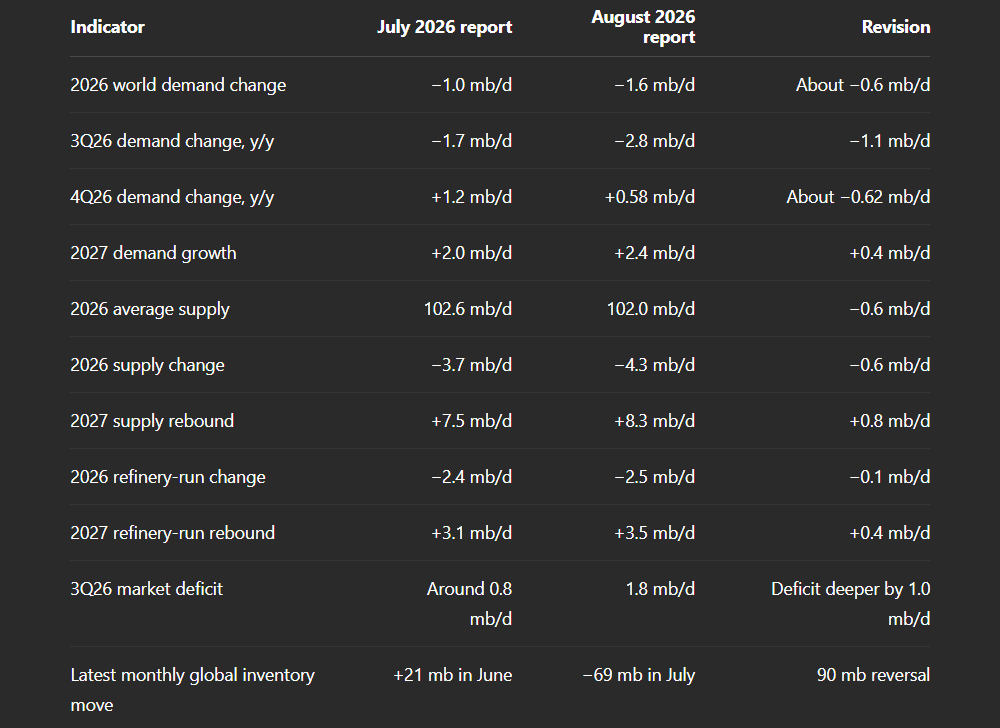
Sources: IEA July 2026 Oil Market Report and IEA August 2026 Oil Market Report.
Why did the IEA revise its forecast so sharply?
The July outlook assumed that the June US-Iran understanding would support a progressive reopening of the Strait of Hormuz. That allowed the IEA to forecast higher Gulf production, improving exports and a relatively rapid release of pent-up demand.
Instead, renewed conflict and attacks on vessels caused regional exports to deteriorate again. Gulf production rose by another 2.5 mb/d in July to 23.9 mb/d, but remained 8.3 mb/d below pre-war levels. Gulf exports declined by 2.1 mb/d to around 15 mb/d, with loadings reportedly falling to approximately 12 mb/d later in July.
The August report consequently lowered estimated third-quarter supply by 1.7 mb/d compared with July. At the same time, the IEA cut second-half demand by roughly 550 kb/d, reflecting expensive fuel, product shortages and damage to international transport and supply chains.
Global oil-demand outlook for 2026 and 2027
The IEA now expects global oil consumption to decline by 1.6 mb/d in 2026. This is not a conventional recession-only demand slowdown. A large part is involuntary or price-induced:
- Fuel is unavailable in some affected markets.
- High prices are reducing discretionary travel and transport.
- Supply chain disruptions are reducing industrial and trade-related fuel consumption.
- Governments and businesses are adopting conservation measures.
- Refinery bottlenecks mean that available crude cannot always be converted into the products most urgently required.
Demand reportedly contracted by 4.9 mb/d year on year in 2Q26. The decline should moderate to 2.8 mb/d in 3Q26, before demand returns to modest growth of approximately 580 kb/d in 4Q26.
Is the oil-demand decline caused by recession or supply shortages?
The 2026 demand contraction is being driven by a combination of economic weakness, high prices and restricted availability.
In a traditional demand-driven slowdown, oil consumption falls because households travel less, factories produce less and international trade weakens. In the current situation, consumption is also falling because fuel is expensive or physically unavailable.
This distinction matters for the 2027 outlook. If demand is merely postponed by shortages, consumption could recover rapidly when supply normalises. This helps explain why the IEA expects demand growth of 2.4 mb/d in 2027, despite forecasting a severe contraction in 2026.
IEA vs OPEC vs EIA oil-demand forecasts
OPEC remains considerably less bearish:
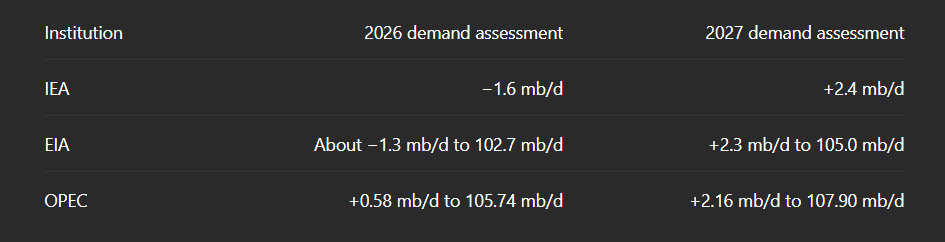
Sources: IEA August OMR, EIA August global oil outlook and OPEC August MOMR.
The spread between the OPEC and EIA estimates of 2026 consumption is approximately 3 mb/d. That difference reflects varying baselines, liquid-fuel definitions, non-OECD data assumptions and, most importantly, different assumptions about how severely the conflict suppresses actual consumption.
OPEC nevertheless reduced its 2026 demand-growth forecast from approximately 0.8 mb/d in July to 0.58 mb/d in August. Its projected growth is narrowly concentrated:
- OECD demand: −40 kb/d
- Non-OECD demand: +610 kb/d
- China: only +90 kb/d
- India: approximately +60 kb/d
- United States: approximately +230 kb/d
- Europe: −120 kb/d
- OECD Asia-Pacific: −170 kb/d
OPEC also lowered its global GDP forecast for 2026 from 3.1% to 3.0%, including weaker forecasts for the Eurozone, Japan and Russia. The EIA’s global GDP assumption is slightly weaker again at 2.9%. OPEC’s regional demand tables confirm that even its positive demand scenario is far from strong.
Analytical conclusion on global oil demand
The IEA’s direction appears well supported: consumption has clearly weakened. The exact magnitude remains uncertain because non-OECD demand data arrive with delays and shortages make consumption harder to measure.
OPEC may be more accurate if transport flows improve quickly. The IEA and EIA become more credible if Hormuz remains constrained through September and product prices stay exceptionally high.
Encouragingly, all three institutions expect a strong demand rebound in 2027. The disagreement is therefore mainly about the depth of the 2026 shock, not whether consumption eventually recovers.
Global oil-supply outlook: Recovery is occurring, but too slowly
Global oil supply rose by 2.4 mb/d in July to 101.5 mb/d, although this was still 6.3 mb/d below July 2025. The IEA now expects:
- 2026 global supply: approximately 102 mb/d
- Annual change: −4.3 mb/d
- 2027 recovery: +8.3 mb/d
- 2027 total supply: 110.3 mb/d
The EIA is slightly more pessimistic on the 2026 level, forecasting 100.8 mb/d, but expects a similar recovery to 109.7 mb/d in 2027. This convergence around 110 mb/d is important: if the recovery happens, the 2027 market could become substantially better supplied.
Why the Strait of Hormuz remains the decisive oil-market variable
- The EIA estimates that crude and petroleum liquids passing through Hormuz averaged only 4.9 mb/d in 2Q26, compared with 21.6 mb/d in 4Q25. It estimated July production shut-ins at approximately 5.5 mb/d and assumes severely restricted flows through August, followed by a slow improvement beginning in September.
- Alternative pipelines cannot fully replace Hormuz. The IEA estimates that Saudi and UAE routes can provide only about 3.5–5.5 mb/d of available bypass capacity, compared with almost 20 mb/d previously moving through the strait.
- There is also an unusual disagreement over current flows. US officials have suggested that close to 9 mb/d may be passing through Hormuz and 15 mb/d may be leaving the region through all routes. Vessel-tracking estimates cited by Reuters have shown significantly lower ranges.
- That uncertainty itself supports volatility because traders cannot confidently establish the true physical balance.
Why shipping data matter more than production announcements
A producer can restart wells and report higher output, but those barrels do not relieve the global market if tankers cannot safely load and leave the region.
Investors should therefore distinguish between:
- Production at the oil field
- Crude entering domestic storage
- Oil loaded onto tankers
- Tankers successfully leaving the Gulf
- Cargoes arriving at foreign refineries
- Refined products subsequently reaching consumers
Each stage introduces delay and operational risk. This is why reported production can increase while global inventories and product supplies continue to tighten.
OPEC+ production and policy outlook
According to the IEA, July production increases included:
- Saudi Arabia: approximately +900 kb/d
- Iraq: approximately +470 kb/d
- Kuwait: approximately +280 kb/d
- Iran: approximately +330 kb/d
Russia declined by around 100 kb/d, while Kazakhstan fell by approximately 330 kb/d.
OPEC’s secondary sources indicate that Declaration of Cooperation producers collectively increased crude production by 1.42 mb/d in July to 37.66 mb/d.
Seven OPEC+ countries agreed to return another 188 kb/d in September, following the same adjustment for August. However, this scheduled increase is small compared with the 8.3 mb/d of Gulf supply still offline in the IEA assessment.
Physical export capacity, infrastructure integrity and maritime security currently matter far more than nominal production targets.
Can OPEC+ production increases reduce oil prices?
Under normal market conditions, an additional 188 kb/d could have a modest bearish effect. Under current conditions, the effect depends on whether the extra barrels can reach international buyers.
If export routes remain constrained, a higher production target may increase domestic or floating storage without materially improving the global supply balance.
The market will therefore pay more attention to export loadings and tanker movements than to the official production target itself.
Non-OPEC oil-supply growth
OPEC forecasts non-DoC liquids supply growth of approximately 640 kb/d in 2026, led by:
- Brazil
- United States
- Canada
- Argentina
The Americas are therefore providing the principal counterweight to Gulf and Russian losses. OPEC sees US non-DoC production rising by about 350 kb/d in 2026, while the EIA expects US crude production to average 13.8 mb/d in 2026 and rise to 14.2 mb/d in 2027.
This creates a regional redistribution of market power toward Atlantic Basin producers, but additional American supply cannot immediately replace missing Middle Eastern products, particularly diesel, jet fuel, naphtha and LPG.
Refining and refined products: The real centre of the 2026 oil crisis
The most important conclusion for consumers is that this is no longer simply a crude-oil shortage. It is increasingly a refined-product shortage.
Global refinery throughputs reached 80.9 mb/d in July, rising by approximately 1.8 mb/d from June but remaining nearly 5 mb/d below the previous year. The IEA expects throughputs to decline by 2.5 mb/d in 2026, followed by a 3.5 mb/d rebound in 2027.
Constraints include:
- Middle Eastern export refineries operating below normal levels.
- Restricted product exports through Hormuz.
- Attacks on Russian refineries and export infrastructure.
- Reduced Chinese refinery runs.
- Low stocks of diesel, gasoline and jet fuel.
- Seasonal maintenance beginning in September and October.
Seaborne petroleum-product trade was reportedly 3.8 mb/d below the previous year. Diesel exports from Russia, the Middle East and Asia were down by approximately 1.3 mb/d, while jet-fuel exports from those regions were lower by around 670 kb/d.
Refinery margins and operating rates
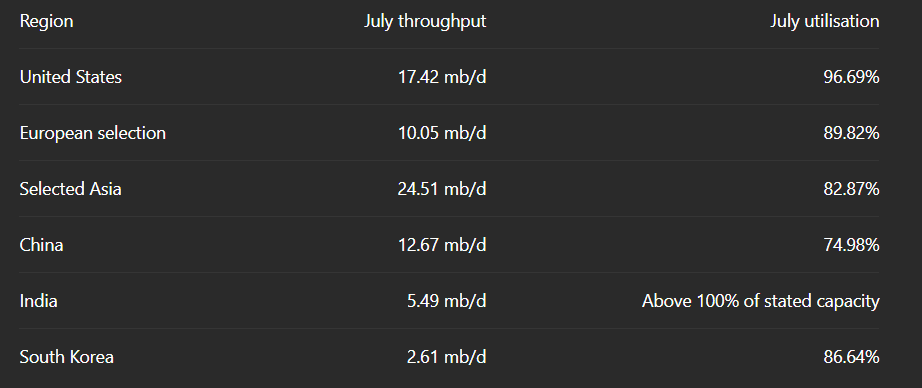
OPEC reported sharply stronger July refinery margins across the US Gulf Coast, Rotterdam and Singapore. US and European margins reached multi-year highs, led by middle distillates. European low-sulphur gasoil cracks reached record territory near the end of July.
Selected July refinery activity illustrates the response:
Why can fuel prices remain high when crude prices fall?
Crude prices can fall without providing immediate relief to consumers. Diesel, jet fuel and gasoline prices depend on product inventories, refinery availability and shipping—not only the price of a barrel of crude.
Consequently, the most attractive part of the petroleum complex may remain product cracks rather than outright crude, while refiners with secure feedstock access retain an advantage.
This also explains why retail gasoline, diesel and aviation-fuel prices may decline much more slowly than Brent or WTI.
Global oil inventories: Strategic and commercial buffers are being depleted
The IEA estimates that global observed oil stocks declined by 69 million barrels in July, bringing the cumulative decline since the conflict began to approximately 410 million barrels, or 2.7 mb/d on average.
Total observed inventories fell below 7.9 billion barrels for the first time since April 2025. Most of July’s decline reflected lower oil-on-water volumes. Onshore stocks fell by a smaller six million barrels, partly because emergency releases continued.
Why did June inventory reports appear contradictory?
The July IEA report showed a 21-million-barrel global increase in June, while OPEC subsequently estimated that OECD commercial stocks fell by 26.4 million barrels that month.
These figures measure different things:
- The IEA global total included a roughly 117-million-barrel rise in oil on water.
- Onshore global stocks fell by approximately 96 million barrels.
- OPEC’s figure covers OECD commercial stocks rather than the whole world.
OPEC estimates OECD commercial inventories at 2.729 billion barrels in June, approximately:
- 59.6 million barrels below the previous year
- 66.5 million barrels below the latest five-year average
- 218.5 million barrels below the 2015–2019 average
- Equivalent to 58.7 days of forward cover, 1.9 days below the five-year average
US crude and petroleum-product inventories
For the week ending 7 August:
- Commercial crude stocks increased by 17.4 million barrels to 424.4 million.
- Crude imports rose by 1.14 mb/d to 7.3 mb/d.
- Gasoline stocks fell by one million barrels and were 6% below their five-year average.
- Distillate stocks fell slightly and were 12% below the five-year average.
- Refinery utilisation reached 96.2%.
- Four-week total products supplied fell 2.1% year on year.
- Gasoline demand fell 0.5%, but distillate and jet-fuel demand increased.
- The US SPR stood at only 298.7 million barrels, compared with 403.2 million one year earlier.
The large crude build was bearish and contributed to the 13 August price decline. However, it was substantially influenced by higher imports, while finished-product stocks remained scarce. One weekly crude increase does not yet overturn the broader global tightening signal.
Emergency oil reserves
IEA countries agreed in March to make 400 million barrels of emergency oil available—the largest coordinated release in the agency’s history. The United States committed 172 million barrels, beginning with an initial exchange of up to 86 million barrels.
These releases reduced the immediate severity of the crisis but also leave smaller policy buffers if the conflict persists or another disruption occurs.
Crude-oil prices, futures curves and tanker freight
July was one of the most volatile months in recent oil-market history:
- North Sea Dated traded across an almost $40 range.
- It reached approximately $105 on 23 July.
- It ended July at $96.80, after rising $25.67 during the month.
- The OPEC Reference Basket averaged $82.99, down $6.76 from June.
- Front-month Brent averaged $83.97.
- Front-month WTI averaged $79.22.
- Brent and WTI prompt structures returned to backwardation.
Backwardation indicates that immediate barrels are valued more highly than future supply. That supports the physical-tightness interpretation despite weaker annual demand.
On 13 August, Brent settled at $87.07 and WTI at $81.25, both down more than 2%, following weaker demand forecasts and the large US crude build.
What does backwardation mean for the oil market?
Backwardation occurs when prompt oil prices are higher than prices for later delivery. It normally indicates that buyers are willing to pay a premium for immediately available supply.
In the current market, backwardation suggests:
- Immediate physical barrels are scarce.
- Inventories have greater value today than in the future.
- The market expects supply conditions to improve later.
- Traders have an incentive to release commercial inventories rather than store oil.
A move from backwardation into contango would indicate that prompt scarcity is easing and future supplies are becoming less uncertain.
Tanker and shipping markets
OPEC reported:
- West Africa-to-Asia VLCC rates remained 188% higher year on year.
- US Gulf-to-Europe Suezmax rates increased 28% in July.
- Cross-Mediterranean Aframax rates rose 60%.
- Clean-tanker rates east of Suez declined during July, partly because lower export volumes reduced cargo demand.
The distinction matters: reduced exports can lower some freight rates even while shipping risks and insurance costs increase. A reopening of Hormuz would likely produce an initial surge in tanker demand as delayed cargoes move, followed by gradual normalisation.
EIA Brent oil-price forecast: Major upward revision from July
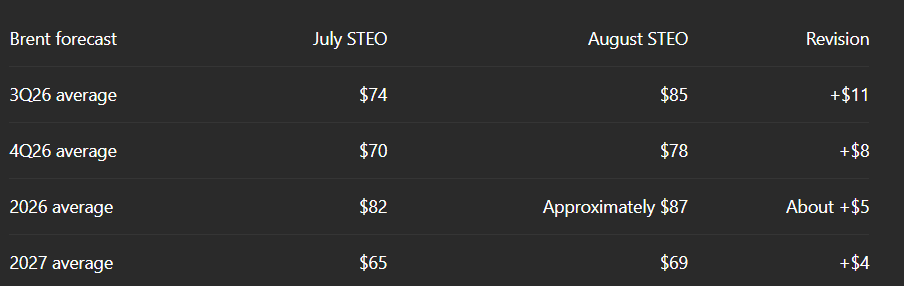
The July forecast assumed a faster return of Hormuz traffic. Renewed disruption led the EIA to increase its projected 3Q26 inventory draw from 2.2 mb/d to 3.8 mb/d.
The EIA still expects Brent to decline to around $78 in 4Q26 and average $69 in 2027, assuming most shut-in output is restored during 1Q27 and inventories begin rebuilding.
What could make the EIA forecast wrong?
Brent could remain above the EIA forecast if:
- Hormuz traffic does not recover from September.
- More tankers or export infrastructure are attacked.
- Bab el-Mandeb shipping becomes more restricted.
- Russian refinery and export outages increase.
- Product shortages intensify during autumn maintenance.
Prices could fall below the forecast if:
- A durable security agreement reopens Hormuz.
- Gulf crude and refined-product exports recover quickly.
- Global demand weakens more sharply than expected.
- Chinese refinery demand remains depressed.
- Commercial inventories begin rebuilding earlier than forecast.
Market effects of the August 2026 oil outlook
Effect on Brent and WTI crude oil
The immediate balance remains supportive because:
- The IEA estimates a 1.8 mb/d third-quarter deficit.
- Stocks are below normal levels.
- Prompt curves are backwardated.
- Gulf and Russian supply risks remain unresolved.
- Emergency releases are slowing.
The principal bearish factors are demand destruction, rising American supply and the possibility of a rapid release of shut-in Gulf production.
Effect on diesel, gasoline and jet fuel
Diesel and jet fuel should remain more vulnerable than crude. Autumn refinery maintenance could tighten product availability further even if crude exports improve.
This creates the possibility of falling Brent prices alongside persistently expensive diesel, aviation fuel and retail transportation costs.
Effect on energy equities
Potential relative beneficiaries include:
- US and other non-Gulf upstream producers
- Canadian and Latin American producers
- Refiners with secure crude access
- Tanker operators positioned on disrupted replacement routes
- Oilfield-services companies involved in restoring damaged capacity
Risks remain high for producers whose export routes are constrained. High prices do not translate into higher revenue when physical volumes cannot reach buyers.
Effect on airlines, logistics and industrial companies
Airlines face pressure from exceptionally expensive jet fuel and hedging costs. Trucking, shipping, agriculture, mining and construction are exposed to diesel inflation. Petrochemical and manufacturing companies may face expensive or unavailable feedstocks.
Companies with strong fuel hedges may temporarily outperform competitors, while businesses with unhedged exposure or limited pricing power face greater margin pressure.
Effect on inflation and monetary policy
The shock is stagflationary:
- Energy and transportation inflation rise.
- Household real income weakens.
- Industrial costs increase.
- Economic growth slows.
- Central banks face greater difficulty easing policy.
Headline inflation may remain high even as underlying demand weakens. Bond-market reactions can therefore be unstable: inflation risk pushes yields higher, while growth fears and safe-haven demand push them lower.
Effect on currencies
All else equal:
- Oil exporters such as Canada and Norway receive terms-of-trade support.
- Oil-importing currencies—including the yen, rupee, baht and several European and Asian currencies—face external-balance pressure.
- The US dollar can benefit from safe-haven demand and US energy independence, but can weaken when lower oil prices reduce inflation and monetary-tightening expectations.
These relationships may be overwhelmed temporarily by changes in global risk sentiment.
Effect on gold and other safe-haven assets
Further escalation in the Middle East could support gold through safe-haven demand and fears of renewed inflation. However, a stronger US dollar and higher real bond yields could partially offset this effect.
A durable reopening of Hormuz would probably reduce part of the geopolitical premium in gold, oil and shipping markets.
Oil-price scenarios for the remainder of 2026
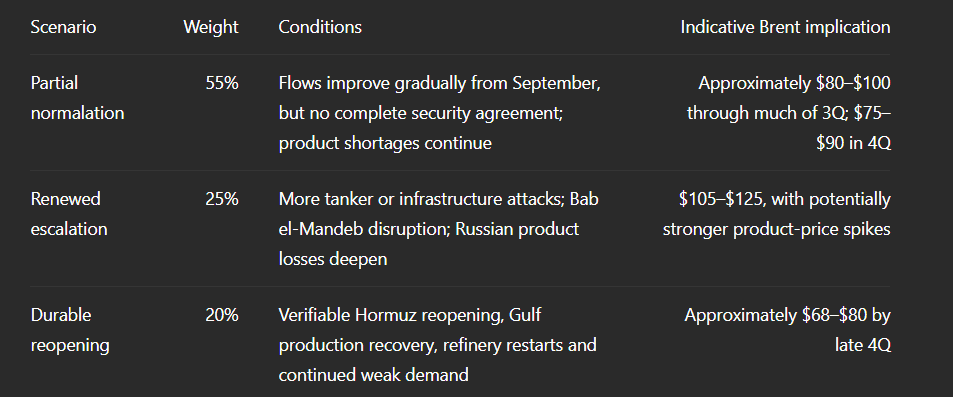
These are independent analytical scenarios, not IEA forecasts.
Base scenario: Partial normalisation
The most likely scenario is a gradual but incomplete recovery in Gulf exports. Some additional crude reaches the market, but security risks, insurance costs and refinery outages prevent a full return to pre-conflict conditions.
In this scenario, Brent remains volatile and generally supported during the third quarter. Prices could decline during the fourth quarter as production recovers, but diesel and jet-fuel prices may remain elevated.
Bullish scenario: Renewed escalation
Additional attacks on tankers, Gulf infrastructure, Bab el-Mandeb shipping or Russian refining capacity could push Brent back above $100.
Because global inventories and emergency reserves have already been drawn down, another major disruption could produce a larger price reaction than an equivalent event earlier in the conflict.
Refined products could rise even faster than crude, particularly if outages affect complex refineries or major product-export terminals.
Bearish scenario: Durable reopening
A verifiable agreement allowing uninterrupted Hormuz traffic could rapidly reduce the geopolitical premium.
Delayed cargoes, floating storage and restarted production could arrive in the market at the same time that high prices have already weakened consumption. That combination could shift the market from deficit toward surplus and pressure Brent into the $68–$80 range by late 2026.
Scenario invalidation signals
The bullish scenario weakens if:
- Hormuz exports consistently return above 15–18 mb/d.
- Gulf refineries resume product exports.
- Global inventories begin increasing for several consecutive weeks.
- Brent loses backwardation.
- Diesel and jet cracks fall sharply.
The bearish scenario weakens if:
- Actual Hormuz traffic remains below public official estimates.
- Bab el-Mandeb becomes less accessible.
- Gulf or Russian infrastructure sustains new damage.
- Product inventories continue declining into refinery-maintenance season.
- Brent returns above $100 while prompt spreads widen.
What investors and traders should monitor
The most valuable indicators over the next month are:
- Actual Hormuz cargo movements, rather than diplomatic statements.
- Bab el-Mandeb security and Saudi Red Sea export capacity.
- Gulf production versus export volumes—oil produced but unable to leave the region does not relieve consumers.
- Diesel, jet-fuel and gasoline crack spreads.
- Brent and WTI time spreads, particularly whether backwardation strengthens.
- Russian refinery operations and product exports.
- Chinese refinery runs, crude imports and stock changes.
- US gasoline and distillate inventories, not only headline crude stocks.
- The pace of emergency-stock releases.
- OPEC+’s 6 September meeting and whether its scheduled increases can physically reach the market.
- Autumn refinery maintenance in the US, Europe and Asia.
- Demand indicators from aviation, road transport and manufacturing.
Final assessment of the August 2026 global oil market
The August oil market cannot be described simply as bullish or bearish.
The immediate physical balance is bullish: supply is restricted, inventories are low, the forward curve is backwardated and refined products remain scarce. The IEA’s deeper 1.8 mb/d third-quarter deficit supports continued price sensitivity to every geopolitical development.
Demand, however, is weakening rapidly. High prices and shortages are doing the work normally performed by an economic recession. That demand destruction places a ceiling on how long crude can remain above $100 without generating further consumption losses.
The medium-term outlook is potentially bearish because both the IEA and EIA expect global production to approach 110 mb/d in 2027. If Gulf supply returns faster than demand and emergency stocks begin rebuilding, Brent could move toward the EIA’s 2027 forecast near $69.
The clearest conclusion is that refined products remain tighter than crude, and shipping normalisation is more important than headline OPEC+ production targets. Until Hormuz and the Gulf refinery system operate reliably, volatility will remain exceptionally high, and consumer fuel prices may stay elevated even during temporary corrections in Brent and WTI.
Frequently asked questions
1. What is the main conclusion of the IEA Oil Market Report for August 2026?
The main conclusion is that the global oil market remains physically tight in the short term, despite rapidly weakening demand. The IEA estimates a third-quarter supply deficit of 1.8 mb/d, while inventories, refined products and secure shipping capacity remain limited.
2. What is the IEA’s global oil-demand forecast for 2026?
The IEA forecasts that global oil demand will decline by approximately 1.6 mb/d in 2026. This is a deeper contraction than the roughly 1.0 mb/d decline forecast in the July report.
3. Why is global oil demand declining?
Demand is declining because of high fuel prices, product shortages, disrupted international trade, weaker economic growth, and government or corporate conservation measures. Part of the decline reflects fuel being unavailable rather than consumers voluntarily reducing consumption.
4. How does the August IEA report differ from the July report?
The August report forecasts weaker demand, lower supply, and a much larger third-quarter deficit. The IEA increased the estimated 3Q26 deficit from approximately 0.8 mb/d to 1.8 mb/d and lowered projected average 2026 supply from 102.6 mb/d to 102.0 mb/d.
5. What is the IEA’s global oil-supply forecast for 2026?
The IEA expects global oil supply to average approximately 102 mb/d in 2026, representing an annual decline of around 4.3 mb/d.
6. What does the IEA expect in 2027?
The IEA expects oil demand to rebound by 2.4 mb/d in 2027. Global supply is forecast to recover by 8.3 mb/d, reaching approximately 110.3 mb/d.
7. Why do the IEA and OPEC disagree about oil demand?
The agencies use different historical baselines, liquid-fuel definitions, and assumptions about non-OECD consumption. They also make different assumptions about how long the Strait of Hormuz disruption will last and how strongly high prices and shortages will suppress consumption.
8. What is OPEC’s 2026 oil-demand forecast?
OPEC expects global oil demand to increase by approximately 580 kb/d in 2026, reaching about 105.74 mb/d. This is significantly more optimistic than the IEA and EIA forecasts.
9. Why is the Strait of Hormuz so important for oil prices?
Before the conflict, close to 20 mb/d of oil moved through the Strait of Hormuz. Alternative Saudi and UAE pipelines can replace only an estimated 3.5–5.5 mb/d. Therefore, a prolonged disruption can remove a very large amount of supply from international markets.
10. Can OPEC+ production increases reduce the current shortage?
Only if the additional barrels can be exported. The planned 188 kb/d September production adjustment is small compared with the millions of barrels per day of Gulf production and exports affected by the conflict.
11. Why are diesel and jet-fuel markets tighter than crude oil?
Several important export refineries in the Middle East and Russia are operating below normal capacity or facing transport restrictions. Crude may be available in some locations, but global refining and shipping systems cannot produce and distribute enough diesel, jet fuel and gasoline.
12. Can retail fuel prices remain high if Brent falls?
Yes. Retail fuel prices depend on refinery margins, product inventories, shipping expenses, insurance and distribution costs. Diesel, gasoline and jet fuel can remain expensive even when crude prices decline.
13. What happened to global oil inventories in July 2026?
The IEA estimates that global observed inventories declined by 69 million barrels in July. Total observed stocks fell below 7.9 billion barrels, while cumulative draws since the conflict began reached approximately 410 million barrels.
14. What happened to US crude inventories in early August?
US commercial crude inventories increased by 17.4 million barrels during the week ending 7 August. However, imports also rose sharply, while gasoline and distillate inventories remained below their five-year averages.
15. What is the EIA’s Brent price forecast for 2026?
The EIA forecasts Brent to average approximately $85 per barrel in 3Q26, $78 in 4Q26, and around $87 for 2026 as a whole.
16. What is the EIA’s Brent forecast for 2027?
The EIA expects Brent crude to average approximately $69 per barrel in 2027, assuming Gulf production recovers and global inventories begin rebuilding.
17. Could Brent return above $100?
Yes. Renewed tanker attacks, further infrastructure damage, a disruption to Bab el-Mandeb or continued declines in Russian product exports could return Brent to the $105–$125 range under an escalation scenario.
18. What could push Brent below $80?
A durable reopening of Hormuz, rapid recovery in Gulf production and refining, continued weak demand and sustained inventory builds could push Brent below $80 during the fourth quarter.
19. Which assets could benefit from the current oil-market conditions?
Potential beneficiaries include non-Gulf upstream producers, refiners with secure feedstock supplies, some tanker operators and oilfield-service companies involved in restoring production and refining infrastructure.
20. Which industries are most exposed to high oil and fuel prices?
Airlines, trucking, shipping, agriculture, mining, construction, petrochemicals and energy-intensive manufacturers are among the most exposed sectors.
 IEA Oil Market Report August 2026: Full Analysis
 EIA Short-Term Energy Outlook August 2026: Oil and Gas Forecast
 Fed Holds Rates in July 2026 as Warsh Reinforces 2% Inflation Target
 Iran War Weekly Update: U.S. Strikes Pause as the Conflict Expands into the Red Sea
 Third Round of US–Iran Hostilities: Military Escalation, Strait of Hormuz Risks and Market Impact
 OPEC July 2026 Oil Market Report: Demand Outlook, Supply Recovery and Comparison with June
 Federal Reserve Beige Book July 2026: U.S. Growth Broadens as Inflation Pressures Ease
 Iran War Review: U.S. Strikes Intensify as the Strait of Hormuz Crisis Deepens, July 14–16, 2026
 IEA Oil Market Report July 2026: Hormuz Flows Recover as Product Markets Stay Tight
 Fed June 2026 Minutes: Warsh Signals Hawkish Policy Reset
 EIA July 2026 STEO: Oil Price Forecast Falls as Hormuz Risk Eases
 U.S.-Iran conflict, Strait of Hormuz, oil prices, Persian Gulf markets, Bitcoin, global markets, Middle East crisis