
 English
 پارسی


EIA Short-Term Energy Outlook August 2026: Oil Prices Rise as Natural Gas Weakens
This divergence is the central theme of the August outlook: global oil markets are being driven by geopolitical scarcity, while the U.S. natural-gas market is dealing with abundant domestic supply. The report was released on August 11, 2026, using forecasts completed on August 6. Its projections depend heavily on assumptions regarding Middle East shipping, regional production recovery, weather, LNG-terminal availability and economic growth.
Key Takeaways from the August 2026 EIA Energy Outlook
- The EIA forecasts Brent crude oil to average approximately $86.81 per barrel in 2026, up 6% from its July estimate.
- Brent is expected to average $85.21 in the third quarter and $78 in the fourth quarter of 2026.
- Global oil inventories are forecast to decline by approximately 3.8 million barrels per day in 3Q26.
- U.S. commercial crude inventories could finish 2026 near 396 million barrels, almost 9% below the previous forecast.
- U.S. retail gasoline is forecast to average $3.78 per gallon in 2026.
- Wholesale diesel prices were revised 8.5% higher to $3.37 per gallon.
- Henry Hub natural gas is forecast to average $2.87/MMBtu in 3Q26, almost 15% below the July forecast.
- U.S. LNG exports are expected to average 17.4 Bcf/d in 2026 and 18.6 Bcf/d in 2027.
- Solar, wind, natural gas, and battery storage remain the primary sources of electricity-sector growth.
- Oil and refined products face near-term scarcity, but the EIA expects a large global supply recovery to push energy prices lower in 2027.
EIA August 2026 Forecast at a Glance
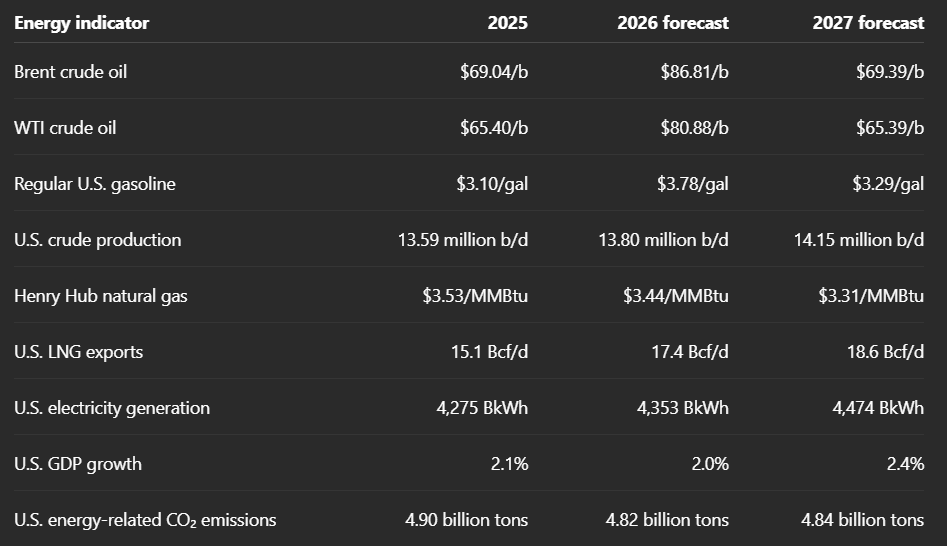
Forecast values may differ slightly because of rounding.
What Changed from the July 2026 EIA Outlook?
The August report represents a significant reversal from the EIA’s more optimistic July oil outlook.
In July, the EIA assumed that the June memorandum of understanding between the United States and Iran would allow shipping through the Strait of Hormuz and Middle East oil production to recover relatively quickly. Renewed attacks on vessels and reduced tanker traffic forced the agency to delay that expected recovery.
The August outlook assumes that severe restrictions on Hormuz traffic will continue through August, followed by only a gradual improvement beginning in September.
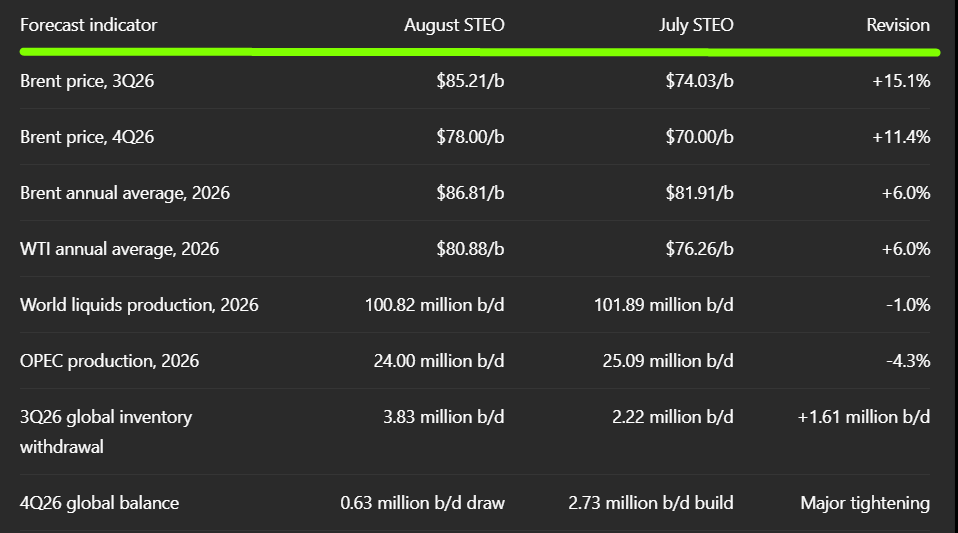
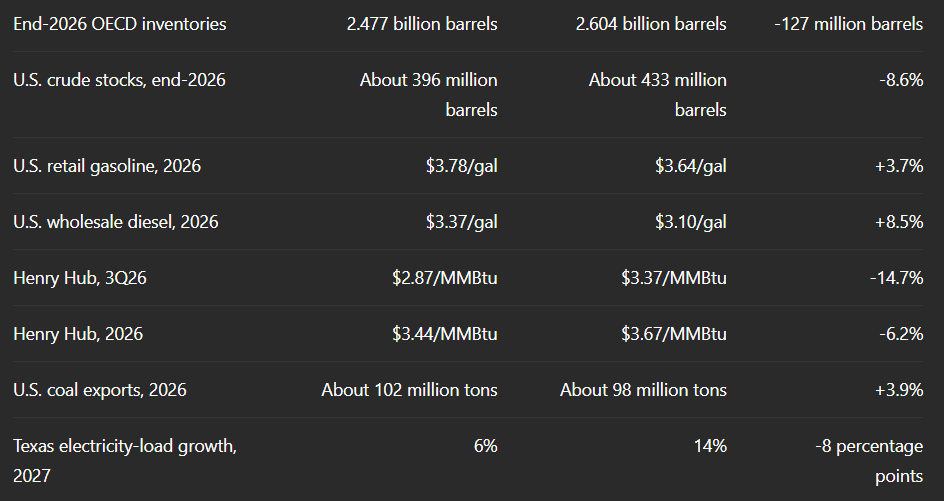
The most important revision is not simply the higher oil-price forecast. The expected timing of the global oil-market rebalancing has fundamentally changed.
The July report projected a substantial inventory build during the fourth quarter of 2026. The August report instead forecasts another inventory withdrawal, delaying meaningful stock replenishment until 2027.
Global Oil Outlook: Hormuz Remains the Main Market Risk
Brent crude oil fell as low as $69 per barrel on July 2 after the June agreement between the United States and Iran initially improved expectations for regional shipping. That optimism did not last.
Renewed attacks on tankers transiting the Strait of Hormuz pushed Brent as high as $105 per barrel on July 23 and returned a significant geopolitical premium to the market.
Strait of Hormuz Oil Flows Collapse
Petroleum and other liquids transported through the Strait of Hormuz averaged only 4.9 million barrels per day during the second quarter of 2026. Before the conflict, approximately 21.6 million barrels per day moved through the strait in the fourth quarter of 2025.
At the same time, volumes passing through Bab el-Mandeb increased from 5.4 million to 8.1 million barrels per day. Saudi Arabia redirected part of its crude production through the East-West pipeline to Yanbu on the Red Sea.
Alternative routes provide some flexibility, but they cannot fully replace Hormuz. Moving oil through the Red Sea, Suez Canal, Sumed pipeline or around the Cape of Good Hope is generally slower, more expensive and limited by infrastructure capacity.
Threats affecting Bab el-Mandeb are therefore especially important. They raise the possibility that both the main Persian Gulf export route and one of its leading alternatives could face disruption simultaneously.
Middle East Oil Production Disruptions
The EIA estimates that approximately 5.46 million barrels per day of Middle East production remained shut in during July:
- Saudi Arabia: 2.07 million barrels per day
- Iraq: 1.86 million barrels per day
- Kuwait: 950,000 barrels per day
- Qatar: 350,000 barrels per day
- Bahrain: 130,000 barrels per day
- Iran: 100,000 barrels per day
- United Arab Emirates: no estimated July shut-in
The EIA now forecasts average production disruptions of:
- 6.57 million barrels per day in 3Q26
- 4.20 million barrels per day in 4Q26
- 1.64 million barrels per day in 1Q27
Approximately 600,000 barrels per day of disruption could continue through the end of 2027.
Global Oil Supply, Demand and Inventory Outlook
World production of crude oil and other liquid fuels is forecast to fall from 106.12 million barrels per day in 2025 to 100.82 million in 2026.
Most of this decline comes from OPEC and other Middle Eastern producers. OPEC production is expected to fall from 29.33 million barrels per day in 2025 to only 24 million in 2026.
Non-OPEC production is considerably more stable. It is forecast at 76.82 million barrels per day in 2026, almost unchanged from 2025, before increasing to 80.07 million in 2027.
The United States, Brazil, Guyana, Canada and other producers outside the disrupted region are helping to offset part of the Middle East supply loss.
Global Oil Demand Weakens in 2026
Higher prices, physical fuel shortages and government conservation measures are reducing oil consumption.
Global demand is forecast to decline by approximately 1.2 million barrels per day in 2026, reaching 102.73 million barrels per day. China’s consumption falls to approximately 16.33 million barrels per day, while demand in other Asian economies also weakens.
Consumption is expected to recover by approximately 2.2 million barrels per day in 2027 as physical supply improves and energy prices decline.
Global Inventories Continue to Fall
Despite weaker demand, available supply remains insufficient in 2026.
The EIA estimates that global oil inventories declined by an average of 4.2 million barrels per day during the second quarter and will fall by another 3.8 million barrels per day during the third quarter.
A smaller inventory draw continues in the fourth quarter.
OECD commercial inventories are projected to finish 2026 at approximately 2.477 billion barrels—127 million barrels below the July forecast.
The balance reverses sharply in 2027. Global production is forecast to recover to 109.74 million barrels per day, while consumption reaches 104.96 million. This would create an inventory build approaching 4.8 million barrels per day.
This projected surplus is the main reason the EIA expects oil prices to decline in 2027. It is also one of the report’s largest uncertainties. If Middle East production recovers more slowly, the expected inventory build and price decline would be significantly smaller.
Brent and WTI Oil Price Forecast for 2026 and 2027
The EIA forecasts Brent crude oil to average:
- $102.93 per barrel in 2Q26
- $85.21 per barrel in 3Q26
- $78.00 per barrel in 4Q26
- $86.81 per barrel for 2026
- $69.39 per barrel for 2027
WTI crude oil is forecast to average:
- $95.48 per barrel in 2Q26
- $81.13 per barrel in 3Q26
- $74.00 per barrel in 4Q26
- $80.88 per barrel for 2026
- $65.39 per barrel for 2027
The expected Brent premium over WTI remains close to $4 per barrel. Strong international demand for relatively secure U.S. supply, combined with low domestic stocks, should continue supporting U.S. crude exports.
The forecast creates a downward-sloping price path. Oil remains supported while global inventories decline, but prices gradually fall as Middle East production returns and inventories rebuild.
For traders, the EIA’s base case is therefore bullish for near-term crude contracts but structurally bearish for the later part of 2027.
U.S. Crude Oil Production Reaches New Records
U.S. crude production remains an important stabilizing force in the global energy market.
Production is forecast to average:
- 13.59 million barrels per day in 2025
- 13.80 million barrels per day in 2026
- 14.15 million barrels per day in 2027
The 2027 estimate is approximately 120,000 barrels per day higher than the July forecast.
Most future growth comes from the Lower 48 states, particularly the Permian Basin. Permian production is forecast to increase from an annual average of 6.78 million barrels per day in 2026 to 7.03 million in 2027.
However, higher U.S. production does not necessarily mean rising U.S. inventories. Strong international demand is encouraging exports, while crude imports have declined.
U.S. crude net imports fell below one million barrels per day during April and May.
Commercial crude stocks declined by approximately:
- 25 million barrels in May
- 15 million barrels in June
- 4 million barrels in July
The EIA expects U.S. commercial crude inventories to reach approximately 392 million barrels at the end of the third quarter and 396 million at the end of 2026.
These levels would remain below the 2021–2025 seasonal range.
Strategic Petroleum Reserve Outlook
The EIA assumes no additional Strategic Petroleum Reserve release beyond the program announced on March 13, 2026.
SPR inventories are forecast to decline from approximately 414 million barrels at the end of 2025 to around 285 million at the end of 2026.
Low commercial and strategic inventories reduce the market’s ability to absorb another major supply shock. This makes prices more sensitive to hurricanes, refinery outages, pipeline disruptions, or further geopolitical escalation.
U.S. Refinery and Petroleum-Product Outlook
U.S. refineries are expected to maintain relatively high utilization because crack spreads remain profitable.
Crude inputs during the first seven months of 2026 were the highest since 2019. Refinery demand is forecast to remain close to 17 million barrels per day through August.
Runs are expected to fall below 16 million barrels per day in October as seasonal maintenance begins, before recovering during November and December.
Several factors are tightening the global refined-product market:
- Lower Russian refined-product exports
- Reduced product availability from Saudi and Kuwaiti refineries
- Lower Chinese refinery runs
- Higher shipping and insurance expenses
- Low international gasoline and distillate inventories
- Strong international demand for U.S. refined products
These conditions mean petroleum-product prices may remain elevated even if crude prices begin to decline.
U.S. Gasoline and Diesel Price Forecast
Regular retail gasoline is forecast to average:
- $4.01 per gallon in 3Q26
- $3.72 per gallon in 4Q26
- $3.78 per gallon in 2026
- $3.29 per gallon in 2027
The 2026 annual forecast is 3.7% higher than in the July outlook.
On-highway diesel is forecast to average:
- $5.18 per gallon in 3Q26
- $4.86 per gallon in 4Q26
- $4.85 per gallon in 2026
- $4.07 per gallon in 2027
Wholesale diesel received one of the largest forecast revisions, rising 8.5% for 2026 and 6.3% for 2027.
Higher diesel prices have a particularly broad economic effect because diesel is used throughout freight, agriculture, mining, construction and industrial supply chains. Rising transportation costs can eventually pass through to consumer prices.
Strong refining margins are positive for U.S. refiners, especially companies able to purchase domestic crude and sell into tight domestic and export markets. The same conditions create pressure for airlines, trucking companies, chemical producers and other fuel-intensive businesses.
U.S. Natural Gas Outlook: High Production Pressures Henry Hub
The U.S. natural-gas outlook is much weaker than the oil forecast.
Henry Hub natural gas is forecast to average:
- $2.87/MMBtu in 3Q26
- $3.14/MMBtu in 4Q26
- $3.44/MMBtu in 2026
- $3.31/MMBtu in 2027
The third-quarter forecast is almost 15% below the July estimate.
The primary causes are record natural-gas production, reduced LNG feedgas demand, and high storage levels.
Freeport LNG Maintenance Reduces Feedgas Demand
Maintenance at Freeport LNG began on July 10 and is expected to continue through late August. The work temporarily affects approximately 2 Bcf/d of nominal export capacity.
Maintenance at Freeport and other export terminals has reduced Gulf Coast feedgas demand. As a result, South Central inventories reached 5% above their five-year average at the end of July.
Nationwide working-gas inventories are forecast to reach a record 3,985 Bcf at the end of October. This is 19 Bcf above the July forecast and approximately 5% above the five-year average.
The EIA expects Henry Hub prices to remain below $3/MMBtu until November.
U.S. Natural Gas Production Forecast
Dry natural-gas production is forecast at:
- 111.2 Bcf/d in 2026
- 116.0 Bcf/d in 2027
Production growth is concentrated in the Permian, Haynesville and Appalachia regions.
Marketed production is forecast to reach 122.5 Bcf/d in 2026 and 127.8 Bcf/d in 2027.
Rising production should help meet growing electricity, industrial and export demand while limiting sustained upward pressure on domestic prices.
U.S. LNG and Pipeline Export Outlook
U.S. LNG exports are forecast to average:
- 17.4 Bcf/d in 2026
- 18.6 Bcf/d in 2027
The annual projections are almost unchanged from July, although the third-quarter estimate has been reduced by 0.2 Bcf/d to 16.5 Bcf/d because of terminal maintenance.
Pipeline exports are expected to average 9.6 Bcf/d in 2026 and rise to 10 Bcf/d in 2027.
Mexico remains an important source of growth. The new Energia Costa Azul LNG terminal on Mexico’s Pacific coast shipped its first cargo on July 8. The facility introduces approximately 0.4 Bcf/d of nominal export capacity supplied by natural gas from the U.S. Permian Basin.
New Mexican gas-fired power plants are also increasing demand for U.S. pipeline exports.
For traders, the important distinction is between international LNG and domestic Henry Hub prices. Hormuz disruptions may support Asian and European LNG benchmarks, but U.S. gas remains weak when export-terminal maintenance prevents domestic supply from reaching the global market.
A return of Freeport LNG should strengthen feedgas demand, although high production and storage may continue limiting the size of any Henry Hub rally.
U.S. Electricity Demand and Data-Center Growth
U.S. electricity demand continues to rise as commercial facilities, data centers and industrial users expand consumption.
Electric-power-sector generation is forecast to increase from 4,275 billion kilowatthours in 2025 to 4,353 billion in 2026 and 4,474 billion in 2027.
The Texas electricity outlook has nevertheless been reduced. Following the governor’s August 3 announcement of a pause on new data-center development while pending projects are reviewed, the EIA lowered expected Texas load growth in 2027 from 14% to 6%.
National electricity retail sales are still projected to rise:
- 1.8% in 2026
- 2.9% in 2027
Commercial electricity sales are the fastest-growing major category, increasing 3.5% in 2026 and 4.1% in 2027.
The Texas decision highlights an increasingly important market issue: electricity demand may be strong, but grid access, transmission capacity and regulatory approval can restrict the speed of new data-center development.
Natural Gas, Coal and Renewable Electricity Generation
Natural Gas Generation
Gas-fired electricity generation is forecast to increase from 1,702 billion kilowatthours in 2025 to 1,732 billion in 2026 and 1,775 billion in 2027.
Low natural-gas prices, new generating capacity and the need for dispatchable power during peak-demand periods support this growth.
Natural gas maintains approximately 40% of total U.S. electricity generation throughout the forecast.
Coal Generation
Coal-fired generation declines from 733 billion kilowatthours in 2025 to 679 billion in 2026 and 661 billion in 2027.
Coal’s share of U.S. generation falls from 17% in 2025 to 16% in 2026 and 15% in 2027.
Coal nevertheless performs slightly better than forecast in July because actual second-quarter generation was stronger and international export conditions improved.
The longer-term domestic trend remains negative as lower-cost natural gas and renewable capacity continue to displace coal.
Solar Energy
Solar remains the fastest-growing source of U.S. electricity generation.
Solar generation is forecast to rise:
- 20.3% in 2026
- 20.0% in 2027
Solar’s share of electricity generation increases from 7% in 2025 to 8% in 2026 and 9% in 2027.
Utility-scale solar photovoltaic capacity is forecast to reach 181.9 GW at the end of 2026 and 222.6 GW at the end of 2027.
Small-scale solar capacity increases to 65.8 GW in 2026 and 72 GW in 2027.
Wind Energy
Wind generation is expected to grow 6.2% in 2026 and 5.5% in 2027, supported by projects including the 3.7 GW SunZia wind farm.
Wind capacity is forecast to rise to 170.2 GW at the end of 2026 and 178.8 GW in 2027.
Hydropower
Hydropower generation increased 9% year over year during the first half of 2026. However, the EIA expects a 3% decline during the second half because of intensifying drought conditions in the western United States.
Battery Storage
Battery-storage capacity is forecast to increase rapidly:
- 43.0 GW at the end of 2025
- 66.2 GW at the end of 2026
- 91.2 GW at the end of 2027
This expansion should improve the grid’s ability to absorb growing solar output and move electricity into higher-demand evening periods.
U.S. Coal Exports Rise Despite Lower Domestic Consumption
U.S. coal exports increased 32% year over year in June. The EIA consequently raised its 2026 export forecast from approximately 98 million to 102 million short tons.
Metallurgical-coal exports have been supported by the opening of Warrior Met Coal’s Blue Creek mine and the reopening of the Longview and Leer South mines.
Steam-coal exports also improved during the second quarter as high international natural-gas prices encouraged gas-to-coal switching in Europe and Asia.
Weather conditions and increased curtailment of wind and solar generation in China provided additional support for thermal-coal consumption.
Despite stronger exports, total U.S. coal consumption is forecast to decline:
- 452 million short tons in 2025
- 416 million short tons in 2026
- 402 million short tons in 2027
Coal production declines more slowly, from 528 million short tons in 2025 to 514 million in 2026 and 497 million in 2027.
The result is a divided coal market. Export-oriented metallurgical-coal producers have a stronger fundamental outlook, while companies dependent on U.S. thermal-coal demand remain under structural pressure.
Economic and Inflation Effects of the EIA Outlook
The EIA’s conditional macroeconomic forecast assumes U.S. GDP growth of 2.0% in 2026, slightly below the July estimate of 2.1%.
Economic growth is forecast to improve to 2.4% in 2027, compared with 2.3% in the previous report.
The energy outlook creates opposing economic forces.
Higher oil, gasoline and diesel prices increase transportation and production costs. They can also weaken household real income and reduce discretionary spending.
Cheaper natural gas provides a partial offset by lowering costs for electricity generators, chemical companies, fertilizer producers and other energy-intensive industries.
Strong refinery activity, oil exports, LNG projects and energy infrastructure investment support parts of the industrial economy. However, restrictions on data-center development could moderate expected electricity investment and commercial construction.
Possible Inflation Effect
The upward revisions to gasoline and especially diesel are inflationary.
Higher transportation costs can gradually pass through to consumer goods, food prices, and services. The effect is likely to appear first in headline inflation.
Cheaper natural gas offers a counterbalance through lower generation, heating and manufacturing costs. However, the offset may be incomplete because retail electricity prices are also influenced by transmission, distribution and infrastructure expenses.
U.S. Electricity Price Outlook
Lower natural-gas prices can reduce wholesale generation costs, but retail electricity prices are still forecast to rise.
The average U.S. residential electricity price increases from:
- 17.30 cents per kilowatthour in 2025
- 18.27 cents in 2026
- 18.65 cents in 2027
This represents an increase of approximately 5.6% in 2026 and another 2.1% in 2027.
The difference between wholesale fuel costs and retail electricity bills reflects transmission investment, distribution costs, capacity payments, maintenance and other utility expenses.
U.S. Energy-Related CO₂ Emissions
U.S. energy-related carbon dioxide emissions are forecast to decline by 1.8% in 2026, from approximately 4.90 billion metric tons in 2025 to 4.82 billion.
Emissions then increase slightly to 4.84 billion tons in 2027.
Coal-related emissions decline from 826 million metric tons in 2025 to 754 million in 2026 and 735 million in 2027.
Petroleum emissions also decrease gradually. These reductions are partly offset by higher natural-gas emissions as gas-fired electricity generation expands in 2027.
Weather Outlook and Energy Demand
The EIA expects the third quarter of 2026 to record 4% more cooling degree days than the same period in 2025.
August is forecast to be particularly warm, with:
- 13% more cooling degree days than August 2025
- 2% more cooling degree days than the ten-year average
The June–September summer period is expected to record approximately 1,200 cooling degree days, 2% above last summer and 1% above the ten-year average.
Warmer weather should increase electricity and natural-gas demand. However, high natural-gas production and storage mean that ordinary summer heat may not be sufficient to create a sustained Henry Hub rally.
A prolonged heatwave, weak renewable generation or an early start to winter would produce a stronger price response.
Market Effects for Investors and Traders
Brent and WTI Crude Oil
The August outlook is bullish for crude oil through the remainder of the third quarter.
Larger Middle East production disruptions, continued inventory withdrawals and unusually low U.S. stocks create a limited buffer against additional supply shocks.
However, the EIA’s 2027 oil outlook is bearish. The projected recovery in Middle East production, combined with higher non-OPEC supply, creates a potential surplus approaching five million barrels per day.
The base case therefore supports elevated near-term crude prices but a declining longer-term price curve.
Gasoline, Diesel and Refining Margins
Diesel has one of the strongest fundamental outlooks among the major petroleum products.
Constrained global refining activity, reduced Russian exports and autumn maintenance could keep diesel and jet-fuel cracks elevated even if crude oil prices decline.
This environment is generally positive for refiners but negative for airlines, trucking companies, logistics providers and other fuel-intensive businesses.
Henry Hub Natural Gas
The U.S. natural-gas outlook is bearish in the near term.
Prices below $3/MMBtu remain possible while inventories are high and Freeport maintenance limits LNG feedgas demand.
Upside risk increases once Freeport returns, especially if September remains unusually hot or winter begins early. Nevertheless, rising Permian and Haynesville production should limit the medium-term upside.
Electricity and Utility Companies
Low natural-gas prices are supportive for gas-fired generators and can moderate wholesale electricity prices.
However, retail electricity prices continue rising because grid, infrastructure and distribution costs remain elevated.
Solar developers, battery-storage companies and transmission providers retain strong structural growth prospects. Data-center projects face increasing grid-access and regulatory risks.
U.S. Dollar, Inflation and Interest Rates
Higher oil and fuel prices can support headline inflation and complicate expectations for Federal Reserve policy.
If energy inflation persists, Treasury yields and the U.S. dollar could receive support from expectations that monetary policy will remain restrictive.
However, softer economic activity and weaker household purchasing power could eventually create the opposite effect by strengthening expectations for monetary easing.
Equity Markets
Potential beneficiaries include:
- U.S. refiners
- Oilfield-services companies
- Pipeline and export-infrastructure operators
- LNG developers
- Metallurgical-coal producers
- Battery-storage and transmission companies
Potentially vulnerable sectors include:
- Airlines
- Trucking and logistics
- Fuel-intensive manufacturers
- Consumer-discretionary businesses
- Utilities facing infrastructure and regulatory pressures
Main Risks to the August 2026 EIA Forecast
- Faster Reopening of the Strait of Hormuz
A faster normalization of shipping would allow Middle East production to recover sooner, rebuild global inventories, and push oil prices closer to or below the July forecast.
- Further Middle East Escalation
Continued attacks or simultaneous disruptions affecting Hormuz and Bab el-Mandeb could push Brent materially above the EIA’s $85 third-quarter average.
- Delayed Production Recovery
The forecast assumes that most Middle East production returns by early 2027. Infrastructure damage, sanctions, political decisions, or financial constraints could delay that recovery.
- Deeper Demand Destruction
Persistently high energy prices could produce a larger decline in Asian and global oil consumption than the EIA currently assumes.
- Low U.S. Crude Inventories
Exceptionally low commercial and strategic inventories increase sensitivity to hurricanes, refinery outages, and unexpected export demand.
- LNG-Terminal Availability
An extended Freeport outage would be bearish for Henry Hub prices. A rapid return to full operation would increase feedgas demand and tighten the domestic balance.
- Extreme Weather
Severe heat, western drought or an early cold winter could significantly change natural-gas, coal and electricity demand.
- Data-Center and Grid Restrictions
Additional restrictions, connection delays or infrastructure shortages could reduce electricity-demand growth beyond Texas.
EIA Energy Outlook Conclusion
The EIA Short-Term Energy Outlook for August 2026 marks a major reversal from July’s more optimistic oil-market forecast.
Renewed shipping disruptions have delayed the recovery of Persian Gulf production, converted the expected fourth-quarter inventory build into another draw and raised forecasts for crude oil, gasoline, diesel and other petroleum products.
At the same time, the U.S. natural-gas market remains well supplied. LNG-terminal maintenance and record production are allowing inventories to approach historic seasonal highs, keeping Henry Hub below $3/MMBtu in the near term despite elevated international LNG prices.
For investors and traders, the energy complex should not be viewed as one unified trade. Crude oil and refined products face near-term scarcity, U.S. natural gas faces domestic abundance, electricity demand is growing but becoming more policy-sensitive, and renewable-energy capacity continues expanding rapidly.
The EIA’s base case favors elevated oil and product prices through late 2026, followed by substantial normalization in 2027.
Whether that transition occurs depends primarily on the speed and durability with which Middle East production and maritime trade return to normal.
Frequently Asked Questions
1. What is the EIA Short-Term Energy Outlook for August 2026?
The August 2026 STEO is the U.S. Energy Information Administration’s monthly forecast for oil, natural gas, petroleum products, electricity, coal, renewable energy, emissions, and major U.S. economic indicators through 2027.
2. What is the EIA Brent crude oil forecast for 2026?
The EIA forecasts Brent crude oil to average approximately $86.81 per barrel in 2026. Brent is expected to average $85.21 in the third quarter and $78 in the fourth quarter.
3. What is the EIA WTI oil price forecast for 2026?
WTI crude oil is forecast to average approximately $80.88 per barrel in 2026. The third-quarter average is projected at $81.13, followed by $74 in the fourth quarter.
4. Why did the EIA raise its oil-price forecast?
The EIA raised its forecast because renewed attacks and restricted tanker traffic through the Strait of Hormuz are delaying the recovery of Persian Gulf production and causing larger global inventory withdrawals.
5. Will oil prices decline in 2027?
The EIA expects Brent to decline to an annual average of approximately $69.39 per barrel in 2027. This forecast assumes that Middle East production recovers and global supply begins substantially exceeding demand.
6. What is the Henry Hub natural-gas forecast for 2026?
Henry Hub is forecast to average $3.44/MMBtu in 2026. The third-quarter forecast was reduced to $2.87 because of high production, LNG-terminal maintenance and above-average storage.
7. Why are U.S. natural-gas prices falling while global energy prices remain high?
U.S. gas production is at record levels, and terminal maintenance is limiting the amount of gas that can be exported as LNG. This keeps more supply inside the United States even while international LNG prices remain elevated.
8. What is the U.S. gasoline-price forecast for 2026?
Regular U.S. retail gasoline is forecast to average $3.78 per gallon in 2026. Prices are expected to average $4.01 in the third quarter and $3.72 in the fourth quarter.
9. What is the outlook for U.S. crude-oil production?
U.S. crude production is forecast to average 13.80 million barrels per day in 2026 and increase to a record 14.15 million barrels per day in 2027.
10. What is the outlook for renewable energy in the United States?
Solar generation is forecast to grow by approximately 20% in both 2026 and 2027. Wind generation also expands, while battery-storage capacity rises from 43 GW at the end of 2025 to more than 91 GW by the end of 2027.
11. How could the EIA outlook affect inflation?
Higher gasoline and diesel prices could increase headline inflation and transportation costs. Lower U.S. natural-gas prices provide a partial offset through cheaper electricity generation and lower industrial energy expenses.
12. What is the biggest risk to the EIA energy forecast?
The largest uncertainty is the Strait of Hormuz. A faster reopening would pressure oil prices lower, while continued disruption or escalation involving Bab el-Mandeb could push prices significantly above the EIA forecast.
---------------------------------------------------------
 IEA Oil Market Report August 2026: Full Analysis
 EIA Short-Term Energy Outlook August 2026: Oil and Gas Forecast
 Fed Holds Rates in July 2026 as Warsh Reinforces 2% Inflation Target
 Iran War Weekly Update: U.S. Strikes Pause as the Conflict Expands into the Red Sea
 Third Round of US–Iran Hostilities: Military Escalation, Strait of Hormuz Risks and Market Impact
 OPEC July 2026 Oil Market Report: Demand Outlook, Supply Recovery and Comparison with June
 Federal Reserve Beige Book July 2026: U.S. Growth Broadens as Inflation Pressures Ease
 Iran War Review: U.S. Strikes Intensify as the Strait of Hormuz Crisis Deepens, July 14–16, 2026
 IEA Oil Market Report July 2026: Hormuz Flows Recover as Product Markets Stay Tight
 Fed June 2026 Minutes: Warsh Signals Hawkish Policy Reset
 EIA July 2026 STEO: Oil Price Forecast Falls as Hormuz Risk Eases
 U.S.-Iran conflict, Strait of Hormuz, oil prices, Persian Gulf markets, Bitcoin, global markets, Middle East crisis