 English
 پارسی


OPEC Monthly Oil Market Report – July 2026
Full Analysis and Comparison with the June 2026 Report
OPEC’s July 2026 Monthly Oil Market Report, published on 13 July 2026, presents a market in transition from severe geopolitical disruption toward recovering supply flows, lower risk premiums and improving refinery activity. However, the report does not describe a comfortably oversupplied oil market. Physical inventories remain below historical averages, the futures curve remains backwardated, and OPEC expects global oil-demand growth to accelerate substantially in 2027.
The most important change from June is OPEC’s 0.2 million barrels per day downward revision to 2026 demand growth, from approximately 1.0 mb/d to 0.8 mb/d. At the same time, projected 2027 demand growth rises from 1.7 mb/d to 1.9 mb/d, although most of this increase comes from the lower 2026 comparison base rather than a major rise in the absolute 2027 demand forecast.
Meanwhile, crude production from Declaration of Cooperation, or DoC, countries rebounded by approximately 3.0 mb/d in June, reflecting the recovery of previously disrupted Middle Eastern supply. This recovery removed a substantial portion of the geopolitical premium embedded in crude prices during the first half of the year.
Executive Summary
The July report contains five central messages:
- Oil prices corrected sharply in June, but the decline was driven mainly by easing supply fears and speculative liquidation rather than a collapse in underlying physical demand.
- OPEC reduced its 2026 oil-demand forecast, primarily because of weaker expected consumption in China, India, Europe, OECD Asia Pacific and Africa.
- The absolute 2027 demand forecast is almost unchanged, despite the headline growth forecast rising to 1.9 mb/d. This is largely a base effect caused by the lower 2026 forecast.
- Middle Eastern crude production and trade flows recovered strongly, particularly from the UAE, Kuwait and Iraq, helping flatten backwardation and reduce freight and product-market stress.
- Oil inventories remain tight, especially relative to historical norms. This limits the downside risk to prices and means any renewed supply disruption could rapidly tighten the market again.
Key Changes from the June Report
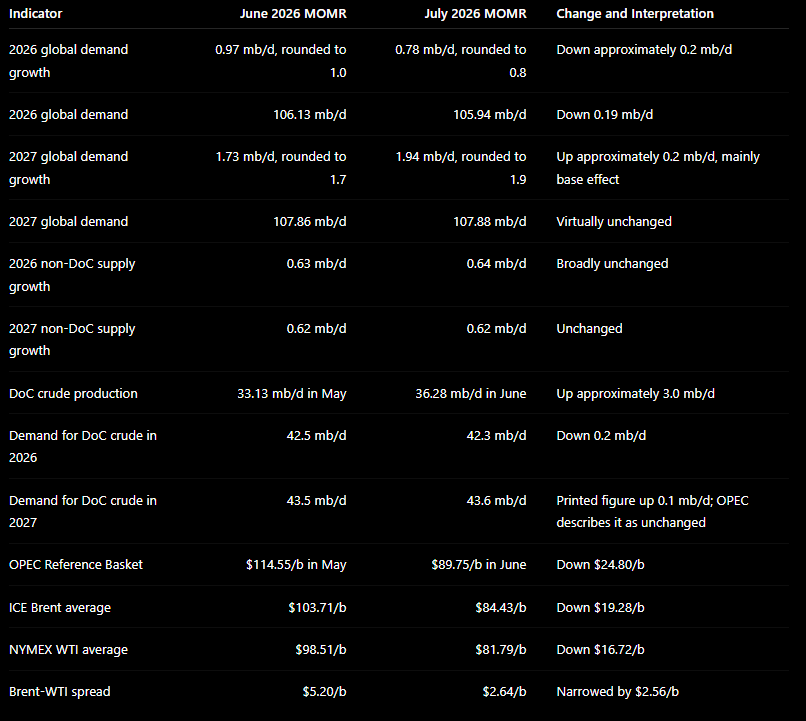
The comparison shows that the July report became less optimistic on 2026 consumption but not structurally bearish on the longer-term market. Supply expectations remain broadly stable, while 2027 demand growth is expected to significantly outpace non-DoC production growth.
1. Crude and Product Prices in the First Half of 2026
ICE Brent and NYMEX WTI futures increased by $21.96/b and $20.95/b, respectively, compared with their averages in the second half of 2025. These represent increases of 33.5% for Brent and 33.8% for WTI.
The rise was driven by:
- Geopolitical uncertainty in the Middle East.
- Disruptions to regional crude exports and shipping.
- Strong demand for prompt-loading replacement barrels.
- Tight Atlantic Basin physical markets.
- Low global commercial oil inventories.
- Significant speculative buying.
However, May and June marked a decisive reversal. Expectations of stronger Middle Eastern supply and improving trade flows led traders to remove much of the geopolitical risk premium. Money managers sold the equivalent of approximately 357 million barrels between early May and 30 June.
Refined products experienced an even larger shock
The product market was initially tighter than the crude market. Global refinery intake fell by approximately 7.3 mb/d in April compared with pre-crisis levels, largely because of reduced Middle Eastern crude availability, lower Asian refinery runs and heavy seasonal maintenance.
Middle distillates were hit hardest:
- US jet/kerosene prices exceeded $170/b in April, approximately 78% above February.
- US gasoil reached nearly $148/b, approximately 73% above February.
- Gasoline experienced a more moderate initial increase because inventories were comparatively healthier.
By June:
- US jet/kerosene had fallen to approximately $127/b, but remained 29% above February.
- US gasoil averaged approximately $121/b, still 42% above February.
OPEC estimates that global refinery intake remained nearly 5 mb/d below the 2025 average when the July report was prepared. Consequently, product supply should continue recovering, but summer driving and aviation demand are expected to prevent a complete collapse in transportation-fuel prices.
Comparison with June
The June feature article focused on the outlook for the second half of 2026 and assumed stronger refinery activity, healthy summer transportation demand, and recovering supply. The July report confirms that this recovery has started, but it also shows that the process is uneven: crude supply has recovered faster than product inventories.
The result is a market where crude prices have fallen sharply, while product prices and refinery margins remain historically elevated in several regions.
2. Crude-Oil Price Movements
OPEC Reference Basket
The OPEC Reference Basket fell by $24.80/b in June, averaging $89.75/b, compared with $114.55/b in May.
Major basket components included:
- Arab Light: $96.89/b
- Iran Heavy: $90.77/b
- Kuwait Export: $92.28/b
- Basrah Medium: $85.10/b
- Murban: $81.80/b
- Meray: $71.13/b
Basrah Medium recorded the largest monthly decline among the listed basket components, falling by $35.12/b.
Despite June’s correction, the ORB’s 2026 year-to-date average remained elevated at $93.67/b, compared with $72.04/b in 2025.
Futures prices and speculative positioning
June averages were:
- ICE Brent: $84.43/b
- NYMEX WTI: $81.79/b
- GME Oman: $79.25/b
The Brent-WTI spread narrowed from $5.20/b to $2.64/b. This reflected the removal of Brent’s Middle East-related risk premium and comparatively strong US fundamentals, including high refinery runs and declining domestic crude inventories.
Between late May and 30 June, money managers sold an estimated 245 million barrels of Brent and WTI exposure. Brent positioning was hit particularly hard:
- ICE Brent net-long positions declined approximately 80%.
- Brent’s long-to-short ratio fell from 3:1 to approximately 1:1.
- Short positions increased to their highest level since December 2025.
- Combined Brent and WTI net-long positions reached their lowest level since January 2026.
Market structure
The futures curves flattened significantly but remained in backwardation:
- Brent M1-M3 backwardation narrowed to $2.14/b.
- Brent M1-M6 backwardation narrowed to $4.87/b.
- WTI M1-M3 backwardation narrowed to approximately $2.94/b.
- Oman M1-M3 backwardation narrowed to $1.64/b.
Backwardation indicates that prompt crude was still valued above future deliveries. Therefore, the price decline should not be interpreted as evidence of a structurally oversupplied physical market.
Analysis
The June price collapse was a combination of:
- Removal of geopolitical risk premiums.
- Restoration of Middle Eastern supply.
- Lower replacement-barrel demand.
- Heavy speculative liquidation.
- Improving refinery access to alternative crude grades.
However, persistent backwardation and low commercial stocks indicate that the market’s physical foundation remained tighter than outright prices suggested.
3. Commodity Markets
The broad energy commodity index fell 17.7% month-on-month in June, although it remained 19.3% higher year-on-year.
Energy commodities
- Average crude oil: $81.70/b, down 18.6% month-on-month.
- European natural gas: down 6.2%.
- US natural gas: up 6.9%, supported by summer cooling and LNG demand.
- Australian thermal coal: up 1.2%.
- US coal: down 4.3%.
European gas storage rose from 40.1% at the end of May to 48.9% at the end of June, helping reduce the European gas risk premium, although storage remained below normal seasonal levels.
Base metals
The base-metals index fell 2.3%:
- Copper: broadly unchanged at $13,574 per tonne.
- Aluminium: down 6.0%.
- Nickel: down 6.5%.
- Lead: down 2.3%.
- Zinc: up 1.4%.
- Iron ore: down 8.3%.
Copper was supported by electrification, artificial-intelligence data centres and power-infrastructure demand, while iron ore was pressured by weak Chinese steel-sector indicators.
Precious metals
Precious metals recorded the sharpest non-energy correction:
- Gold: down 7.8% to $4,228 per ounce.
- Silver: down 14.5% to $66.70 per ounce.
- Platinum: down 13.6% to $1,726 per ounce.
OPEC attributes the decline to higher real interest rates, a stronger US dollar, weaker safe-haven demand and investor repositioning.
Futures investment flows
Combined commodity open interest declined 4.4%, but combined money-manager net length increased 8.3%.
Notable changes included:
- WTI net length: down 9.8%.
- Henry Hub positioning: improved 11.6%, though funds remained net short.
- Gold net length: up 13.8%, despite lower prices.
- Copper net length: up 1.6%.
This divergence suggests that June’s commodity correction was not a uniform rejection of commodities. Investors reduced oil exposure while maintaining or increasing exposure to gold, gas and copper.
4. World Economic Outlook
OPEC left all major economic-growth forecasts unchanged.
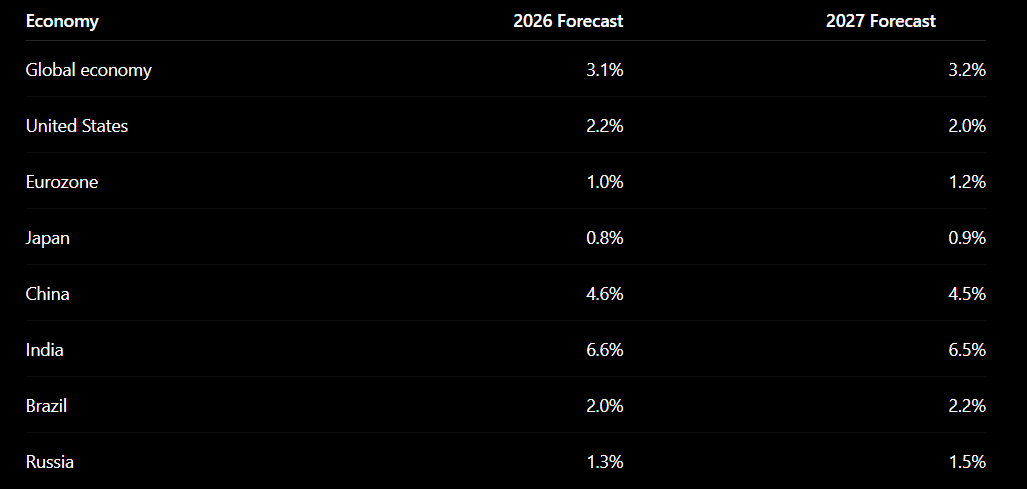
OPEC argues that the global economy entered the second half of 2026 with relatively healthy momentum, supported by:
- Investment in artificial intelligence and semiconductors.
- Resilient household consumption.
- Continued expansion in global trade.
- Public investment and fiscal support.
- Improving energy flows.
- Strong non-OECD Asian growth.
Global trade volumes increased 5.0% year-on-year in April, while trade value rose 9.8%. June global purchasing managers’ indices remained expansionary, with manufacturing at 52.2 and services at 51.7.
Principal economic risks
OPEC identifies four main risks:
- Renewed geopolitical escalation and higher energy prices.
- Changes to US tariff policy and trade agreements.
- Persistent inflation limiting monetary-policy flexibility.
- A slowdown in manufacturing and consumer demand.
US dollar and oil prices
The US dollar index rose 1.6% in June. Dollar appreciation added pressure to dollar-denominated commodities.
OPEC calculated the June ORB at:
- $89.75/b in nominal terms
- $80.83/b in real inflation-adjusted terms
The stronger dollar and higher real interest rates reinforced the liquidation of crude and precious-metal positions.
Comparison with June
Unlike the oil-demand forecast, OPEC’s macroeconomic assumptions were not downgraded. This means the lower 2026 oil-demand outlook reflects product-specific consumption, refinery disruption and regional demand revisions rather than a major reduction in global GDP expectations.
5. World Oil Demand
2026 forecast
OPEC now expects world oil demand to average 105.94 mb/d in 2026, an increase of approximately 0.78 mb/d from 2025.
This compares with the June forecast of 106.13 mb/d, representing a downward revision of approximately 190,000 b/d.
Main 2026 regional revisions from June
- China: 17.11 to 17.00 mb/d, down 110,000 b/d.
- India: 5.80 to 5.74 mb/d, down 60,000 b/d.
- Europe: 13.37 to 13.34 mb/d, down 30,000 b/d.
- Africa: 5.07 to 5.05 mb/d, down 20,000 b/d.
- OECD Asia Pacific: 6.99 to 6.98 mb/d, down approximately 10,000 b/d.
- Americas: 25.65 to 25.67 mb/d, up approximately 20,000 b/d.
The largest downward adjustment was concentrated in second-quarter demand, which was reduced from approximately 104.17 mb/d to 103.67 mb/d.
This reflects the impact of:
- Refinery disruptions.
- Lower crude availability in Asia.
- Weak petrochemical economics.
- Reduced Chinese refinery runs.
- Lower Indian product consumption and imports.
- Pressure on industrial and middle-distillate demand.
2027 forecast
World oil demand is forecast to average 107.88 mb/d in 2027, only around 20,000 b/d higher than the June forecast.
The headline growth forecast nevertheless rises from approximately 1.7 mb/d to 1.9 mb/d because the 2026 base was revised lower.
Expected 2027 growth contributions include:
- India: +0.36 mb/d
- Middle East: +0.32 mb/d
- Other Asia: +0.31 mb/d
- China: +0.29 mb/d
- OECD: +0.27 mb/d
- Africa: +0.16 mb/d
- Latin America: +0.14 mb/d
Analysis
The July demand revision is bearish for the 2026 balance, but it is not a structural rejection of oil-demand growth.
The report effectively shifts part of the expected recovery from 2026 into 2027. Transportation, aviation, petrochemicals and developing-economy consumption remain the principal long-term drivers.
6. World Oil Supply
Non-DoC supply
Non-DoC liquids production is forecast to average:
- 54.84 mb/d in 2026, up 0.64 mb/d
- 55.45 mb/d in 2027, up 0.62 mb/d
The growth forecasts are effectively unchanged from June.
Main 2026 growth drivers
- Brazil: +0.34 mb/d
- United States: +0.24 mb/d
- Canada: +0.11 mb/d
- Argentina: +0.09 mb/d
The Middle East non-DoC category is expected to decline approximately 0.38 mb/d in 2026, reflecting the effect of earlier regional disruptions.
Revisions within the unchanged headline
Although total growth was unchanged, OPEC revised the composition of supply:
- US 2026 liquids production was increased by approximately 90,000 b/d.
- Latin American supply was increased, largely because of stronger Brazilian production.
- Middle Eastern non-DoC supply was reduced.
- The 2027 forecast increasingly relies on Qatar, Canada, Brazil and Argentina, while US growth slows to approximately 30,000 b/d.
DoC crude production
Total DoC crude production rose from 33.28 mb/d in May to 36.28 mb/d in June, an increase of approximately 3.0 mb/d.
Major monthly changes based on secondary sources were:
- UAE: +1.642 mb/d
- Kuwait: +0.880 mb/d
- Iraq: +0.446 mb/d
- Iran: +0.155 mb/d
- Libya: +0.022 mb/d
- Saudi Arabia: -0.099 mb/d
- Russia: -0.061 mb/d
OPEC Member Country production increased by approximately 3.05 mb/d to 22.00 mb/d, while non-OPEC DoC production declined by approximately 50,000 b/d to 14.28 mb/d.
Analysis
The production increase should not be viewed simply as an OPEC+ policy-driven supply expansion. Much of the change represents the restoration of production and exports that had been disrupted earlier in the quarter.
This restoration explains:
- The sharp fall in crude prices.
- Lower replacement-barrel demand.
- Flattening backwardation.
- Improved Asian refinery runs.
- Lower clean tanker freight rates.
- A reduction in extreme product-market tightness.
Nevertheless, June DoC production of 36.28 mb/d remained materially below OPEC’s estimated annual 2026 demand for DoC crude of 42.3 mb/d.
7. Product Markets and Refinery Operations
Refinery margins
US Gulf Coast
USGC margins against WTI fell by $5.83/b to $29.35/b, marking a third consecutive monthly decline.
The fall was driven by:
- Higher refinery utilization.
- Increasing product output.
- Rising jet and gasoil inventories.
- Lower gasoline retail prices.
- Completion of seasonal maintenance.
Margins nevertheless remained $17.53/b higher year-on-year.
Rotterdam
Rotterdam margins declined $2.51/b to $24.25/b as refinery throughput and product availability increased. Margins remained $15.80/b above the previous year.
Singapore
Singapore margins rose $1.04/b to $10.37/b. Crude prices fell faster than product crack spreads, improving refining economics despite weaker regional product prices.
Refinery throughput
June throughput and utilization included:
- United States: 17.28 mb/d, utilization 96.41%
- EU-14, UK and Norway: 9.59 mb/d, utilization 85.76%
- Selected Asia: 24.48 mb/d, utilization 82.79%
Compared with May, throughput increased:
- US: +340,000 b/d
- Europe: +240,000 b/d
- Selected Asia: +690,000 b/d
Comparison with June
The June MOMR showed declining US and Singapore margins but rising Rotterdam margins. In July:
- US margins continued falling.
- Rotterdam reversed lower.
- Singapore margins recovered.
The common driver was the normalization of crude and product flows. Refinery margins are moving down from crisis-era highs, but they remain above normal levels because product stocks and regional availability are still constrained.
8. Tanker Market
Dirty tanker rates remained elevated but became highly volatile as supply fears eased.
VLCCs
- Middle East-to-East: WS507, down 14% month-on-month, but up 745% year-on-year.
- Middle East-to-West: WS195, down 13%.
- West Africa-to-East: WS151, up 10% and approximately 160% higher year-on-year.
Suezmax
- West Africa-to-USGC: WS178, down approximately 3%.
- USGC-to-Europe: WS154, down 9%, but up 114% year-on-year.
Aframax
Aframax rates declined approximately 20% on average:
- Indonesia-to-East: down 27%
- Caribbean-to-US East Coast: down 32%
- Mediterranean-to-Northwest Europe: down 8%
Clean tankers
Clean freight rates declined across all monitored routes:
- West of Suez: down approximately 44%
- East of Suez: down approximately 15%
Comparison with June
In May, clean tanker markets remained strong east of Suez because of product scarcity and high Asian demand. By June, better crude arrivals and refinery output reduced urgent product-import demand, causing clean freight rates to fall in both hemispheres.
Freight costs remain historically high, but the direction has shifted decisively toward normalization.
9. Crude and Refined-Product Trade
United States
June US trade figures showed:
- Crude imports: 5.4 mb/d, down approximately 430,000 b/d
- Crude exports: 4.4 mb/d, down approximately 870,000 b/d
- Product imports: 1.6 mb/d
- Product exports: 7.6 mb/d
US crude exports declined as the narrower Brent-WTI spread reduced the profitability of shipments to Europe and Asia.
OECD Europe
Estimated May flows showed:
- Crude imports: 8.8 mb/d
- Product imports: 2.2 mb/d
- Product exports: 2.1 mb/d
Crude imports increased substantially from April’s 7.7 mb/d, while product exports fell as European refiners supplied more of the domestic market.
Japan
Japanese crude imports recovered from 853,000 b/d in April to approximately 1.5 mb/d in May, although strategic-reserve releases continued to reduce import requirements.
Product imports rose to 735,000 b/d, led by recovering naphtha flows.
China
Chinese crude imports fell from 9.4 mb/d in April to 7.8 mb/d in May.
The decline reflected:
- Lower refinery runs.
- Use of domestic inventories.
- Disrupted trade flows.
- Measures intended to reduce exposure to supply interruptions.
Product exports declined to 787,000 b/d despite a modest easing of government export restrictions.
India
Indian crude imports increased to 5.1 mb/d, the second consecutive monthly recovery.
- Product imports: 814,000 b/d
- Product exports: 938,000 b/d
Russian crude remained India’s largest source, while UAE flows increased and Saudi volumes declined.
Eurasia
Russia and Central Asian crude exports rose to approximately 6.9 mb/d in May, up almost 5% month-on-month. However, product exports fell below 2.0 mb/d, approximately 22% lower year-on-year.
Analysis
The trade section confirms a reorganization of global flows:
- Middle Eastern volumes recovered.
- US export growth slowed.
- Europe increased crude imports but exported fewer products.
- China relied more heavily on inventories.
- India restored imports as regional availability improved.
- Russian crude exports remained resilient, while Russian product exports weakened.
10. Commercial Oil Inventories
OPEC estimates that OECD commercial stocks fell 21.8 million barrels in May to 2.770 billion barrels.
Inventories were:
- 31.4 mb below May 2025
- 48.6 mb below the latest five-year average
- 185.8 mb below the 2015-2019 average
Components included:
- Crude stocks: 1.364 billion barrels, down 6.9 mb
- Product stocks: 1.406 billion barrels, down 15.0 mb
- Forward cover: 59.8 days, down 1.3 days
Regional movements included:
- OECD Americas: down 32.4 mb
- OECD Europe: down 4.9 mb
- OECD Asia Pacific: up 15.6 mb
Preliminary US data for June showed total commercial stocks falling a further 14.8 mb, including a 25.4 mb crude draw, partly offset by a product-stock build.
Important comparison issue
The June report estimated April OECD commercial stocks at 2.748 billion barrels. The July report revised the April level substantially higher, to approximately 2.792 billion barrels, before reporting May’s 21.8 mb decline.
Therefore, comparing the June report’s April level directly with the July report’s May level would incorrectly suggest a stock build. The underlying historical data were revised.
Despite these revisions, the principal conclusion is unchanged: OECD inventories remain materially below both recent and pre-pandemic norms.
Market significance
Low inventories provide a buffer against prolonged price weakness. They also increase sensitivity to:
- Renewed geopolitical disruption.
- Hurricanes or unplanned refinery outages.
- Stronger-than-expected summer demand.
- Delays in restoring Middle Eastern exports.
- A faster reduction in US crude production growth.
11. Balance of Supply and Demand
2026 demand for DoC crude
OPEC reduced its estimate of demand for DoC crude by 0.2 mb/d to 42.3 mb/d, equal to the 2025 level.
Quarterly demand for DoC crude is estimated at:
- Q1 2026: 42.8 mb/d
- Q2 2026: 40.7 mb/d
- Q3 2026: 42.6 mb/d
- Q4 2026: 43.3 mb/d
The June report had estimated annual demand for DoC crude at 42.5 mb/d.
2027 demand for DoC crude
Demand for DoC crude is forecast at 43.6 mb/d, approximately 1.2 mb/d above 2026.
Quarterly figures are:
- Q1 2027: 43.6 mb/d
- Q2 2027: 41.8 mb/d
- Q3 2027: 44.1 mb/d
- Q4 2027: 44.8 mb/d
The June report printed a 2027 figure of 43.5 mb/d, while the July report describes its 43.6 mb/d estimate as unchanged. The small discrepancy appears to be related to rounding and revisions to component estimates.
Implied second-quarter deficit
OPEC’s balance table compares estimated second-quarter DoC production of 34.3 mb/d with demand for DoC crude of 40.7 mb/d, producing a balance of approximately -6.4 mb/d.
This should not be interpreted as a forward projection of a continuing 6.4 mb/d shortage. It reflects extraordinarily low production during the disruption-heavy second quarter and includes the report’s “stock change and miscellaneous” balancing item.
Nevertheless, it explains why:
- Inventories declined.
- Product prices surged.
- Refinery intake fell.
- Freight rates reached extreme levels.
- Backwardation remained intact despite falling flat prices.
Overall Oil-Market Analysis
Near-term outlook: balanced to moderately supportive
The July MOMR is less bullish than the June report regarding 2026 demand, but it is not outright bearish.
Bearish elements include:
- Lower 2026 demand growth.
- Recovery of Middle Eastern supply.
- Lower geopolitical risk premiums.
- Rising refinery throughput.
- Weak Chinese crude imports.
- Heavy speculative selling.
- Falling tanker rates and refining margins.
Supportive elements include:
- Persistent futures backwardation.
- OECD stocks below historical averages.
- Strong summer gasoline and aviation demand.
- Limited US supply growth expected in 2027.
- Continued non-OECD demand expansion.
- A projected 1.9 mb/d rise in global demand in 2027.
Medium-term outlook: tightening risk returns in 2027
OPEC expects 2027 global demand to increase by approximately 1.94 mb/d, while non-DoC supply grows by only approximately 0.62 mb/d and DoC NGLs add approximately 0.11 mb/d.
This creates an increase of approximately 1.2 mb/d in demand for DoC crude, from 42.3 mb/d in 2026 to 43.6 mb/d in 2027.
Therefore, the medium-term balance becomes more dependent on OPEC+ production capacity and policy. Unless demand underperforms, DoC countries will need to supply more crude in 2027 or allow inventories to decline further.
Conclusion
The July OPEC report marks the transition from a crisis-driven oil market to a normalization phase.
The immediate shortage premium has declined because supply and trade flows are recovering. This explains June’s sharp price correction and the easing of tanker and product-market stress. However, normalization is not the same as abundance.
Inventories remain low, product markets are still recovering, and the 2027 balance requires substantially more DoC crude. The report therefore supports a neutral to moderately bullish fundamental outlook: prices may remain below the extreme levels reached earlier in 2026, but the market retains limited protection against renewed supply disruption or stronger-than-expected demand.
Primary sources: OPEC Monthly Oil Market Report, July 2026, and OPEC Monthly Oil Market Report, June 2026.
Frequently Asked Questions
1. What is the main conclusion of OPEC’s July 2026 oil-market report?
OPEC’s July report shows that the oil market is moving from severe geopolitical disruption toward supply norma
lization. However, inventories remain low, and the futures market remains in backwardation, meaning physical conditions are still relatively tight.
2. How much oil-demand growth does OPEC expect in 2026?
OPEC expects global oil demand to grow by approximately 0.8 million barrels per day in 2026, reaching an annual average of around 105.94 million barrels per day.
3. Why did OPEC reduce its 2026 oil-demand forecast?
The forecast was lowered mainly because of weaker expected consumption in China, India, Europe, Africa and OECD Asia Pacific. Refinery disruptions, weaker petrochemical economics and reduced industrial demand also contributed to the revision.
4. Why did OPEC raise its 2027 oil-demand growth forecast?
OPEC raised projected 2027 demand growth from approximately 1.7 million barrels per day to 1.9 million barrels per day. Much of this increase reflects a lower 2026 comparison base rather than a large upward revision to absolute 2027 demand.
5. How did OPEC’s July report differ from the June 2026 report?
The main change was a reduction of approximately 0.2 million barrels per day in projected 2026 demand growth. The 2027 demand-growth forecast increased, non-DoC supply growth remained broadly unchanged, and estimated demand for DoC crude in 2026 fell to 42.3 million barrels per day.
6. Why did crude-oil prices fall sharply in June 2026?
Prices declined as Middle Eastern production and trade flows recovered, geopolitical risk premiums fell, and speculative investors liquidated a large volume of bullish positions. Expectations of greater prompt crude availability also pressured front-month contracts.
7. What happened to the OPEC Reference Basket price in June 2026?
The OPEC Reference Basket fell by $24.80 per barrel, declining from $114.55 in May to an average of $89.75 per barrel in June.
8. Did the oil market move into structural oversupply?
No. Although crude prices fell and futures curves flattened, the main benchmarks remained in backwardation. OECD commercial inventories also remained below their latest five-year and 2015–2019 averages, indicating that the physical market was not structurally oversupplied.
9. How much did DoC crude production increase in June 2026?
Crude production from countries participating in the Declaration of Cooperation increased by approximately 3.0 million barrels per day, reaching around 36.28 million barrels per day in June.
10. Which countries led the recovery in DoC production?
The largest monthly production increases were recorded in the United Arab Emirates, Kuwait and Iraq. Iran and Libya also posted smaller increases, while Saudi Arabian and Russian production declined modestly.
11. What did OPEC report about global refinery activity?
Refinery throughput increased in the United States, Europe and Asia during June. Refining margins declined in the US Gulf Coast and Rotterdam but improved in Singapore because crude prices fell faster than product prices.
12. What was the condition of OECD commercial oil inventories?
OECD commercial oil inventories fell by 21.8 million barrels in May to 2.770 billion barrels. Stocks remained 48.6 million barrels below the latest five-year average and 185.8 million barrels below the 2015–2019 average.
13. What does OPEC expect for demand for DoC crude in 2027?
OPEC expects demand for DoC crude to reach approximately 43.6 million barrels per day in 2027, around 1.2 million barrels per day higher than in 2026.
14. Is OPEC’s July 2026 report bullish or bearish for oil prices?
The report is moderately bearish for the immediate 2026 demand outlook because demand growth was revised lower and Middle Eastern supply recovered. However, low inventories, continued backwardation, and stronger projected demand growth in 2027 support a neutral to moderately bullish medium-term outlook.
15. What are the main risks to OPEC’s oil-market forecast?
The main risks include renewed Middle East supply disruptions, weaker global economic activity, changes in US trade and tariff policies, persistent inflation, slower Chinese demand, refinery outages and stronger-than-expected summer fuel consumption.
Comments