 English
 پارسی


Forecast overview
- Crude oil price movements.
The Brent crude oil spot price has risen sharply following the onset of military action in the Middle East. Brent settled at $94 per barrel (b) on March 9, up about 50% from the beginning of the year and the highest since September 2023. Crude oil prices have risen as petroleum shipments through the Strait of Hormuz have fallen, and some Middle East oil production has been shut in.
- Middle East oil production.
We make the assumption in our modeling that the effective closure of the Strait of Hormuz will cause oil production in the Middle East to fall further in the coming weeks. We assume this shut-in production will gradually ease as transit through the Strait resumes.
- Crude oil price forecast.
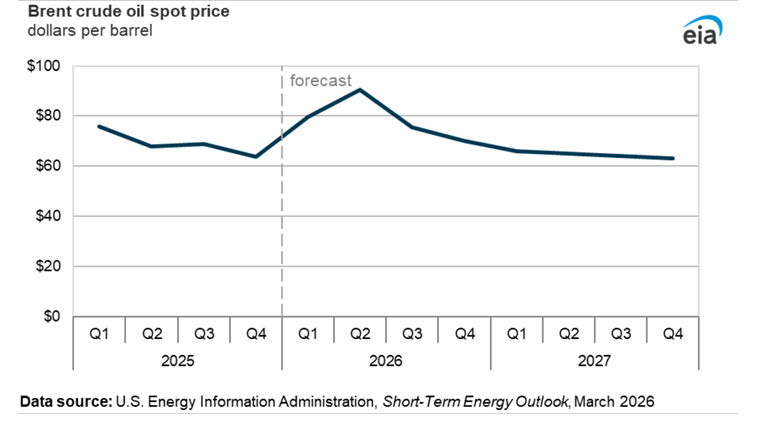
We forecast the Brent crude oil price will remain above $95/b over the next two months, before falling below $80/b in the third quarter of 2026 and around $70/b by the end of the year. We expect prices to average $64/b in 2027. This price forecast is highly dependent on our modeled assumptions of both the duration of conflict in the Middle East and the resulting outages in oil production.
- U.S. crude oil production.
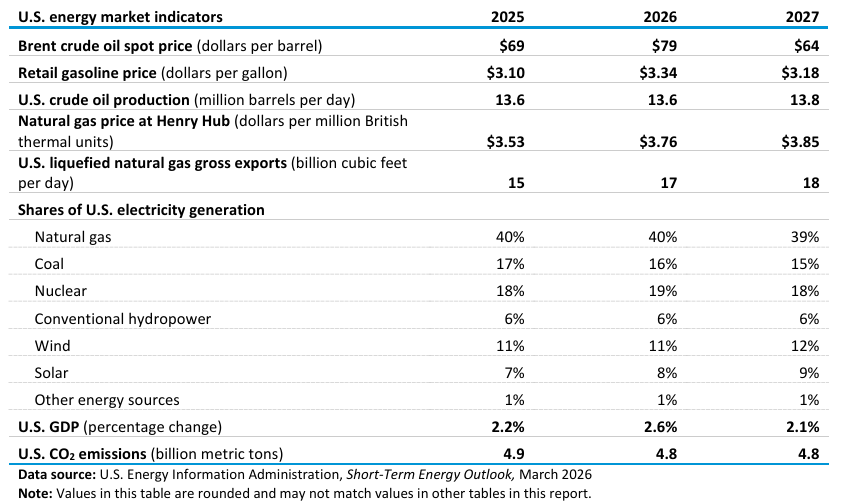
Higher oil prices lead to more U.S. crude oil production in our forecast. We expect U.S. crude oil production to average 13.6 million barrels per day (b/d) in 2026 and rise to 13.8 million b/d in 2027. Our 2027 forecast is 0.5 million b/d higher than last month’s forecast.
- Natural gas prices.
Although reduced liquefied natural gas (LNG) flows through the Strait of Hormuz have caused the price of natural gas in Europe and Asia to increase, we expect U.S. natural gas prices to be relatively unaffected by this development. In our forecast, the Henry Hub spot price averages about $3.80 per million British thermal units (MMBtu) in 2026, or 13% less than our forecast last month. Prices in the early part of our forecast are lower because of milder-than-forecast temperatures in February that left more natural gas in storage than we expected. The Henry Hub spot price averages nearly $3.90/MMBtu in 2027, 12% lower than our forecast last month. Lower prices in 2027 mostly reflect more associated natural gas production as a result of the recent increase in oil prices and the related increase in production later in the forecast.
- Natural gas production.
Higher crude oil production results in more associated natural gas production. We expect marketed natural gas production to average 121 billion cubic feet per day (Bcf/d) this year, an increase of 2% from 2025. Production rises by an additional 3% in 2027 to reach 124 Bcf/d. The 2027 forecast is almost 2 Bcf/d higher than last month’s outlook.
- Natural gas inventories.
We expect U.S. natural gas inventories to end the withdrawal season in March around 1,840 billion cubic feet (Bcf), which is near the five-year average (2021–2025). Storage withdrawals slowed in February, as milder weather moved across much of the country, following historic withdrawals in January related to Winter Storm Fern and subsequent cold weather.
- Electricity.
U.S. electricity generation has been increasing by an average of 2% per year since 2021 to meet growing electricity demand following a period of flat demand growth between 2010 and 2019. We expect U.S. electricity generation will grow by 1.2% in 2026 and by 3.1% in 2027, led by demand growth in the Electric Reliability Council of Texas (ERCOT) region. In 2026, U.S. coal generation declines by 7% in our forecast, as renewable generation increases and the electric power sector retires about 4% of its coal-fired capacity.
- Coal exports.
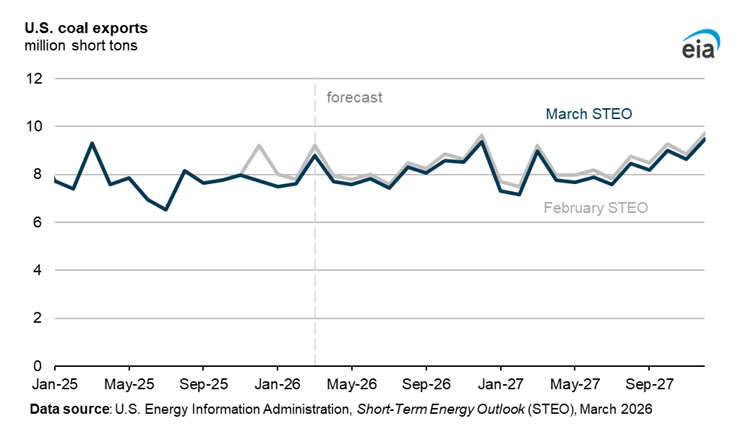
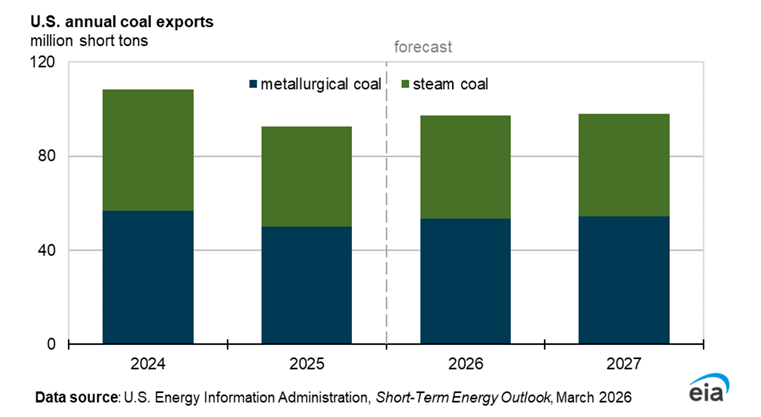
Coal exports fell in 2025 due to a combination of low prices, weak global demand, and increased domestic consumption. Our forecast assumes coal exports will rise slightly in 2026, supported by an increase in metallurgical coal exports, as additional production capacity comes online. Disruptions to global LNG exports through the Strait of Hormuz have led to higher thermal coal spot prices, which may support higher U.S. coal exports should LNG trade disruptions persist.
Global Oil Markets
Global oil prices
The Brent crude oil spot price rose from an average of $71 per barrel (b) on February 27 to $104/b on March 9 following the onset of military action in the Middle East that began on February 28. As of March 9, when we finalized our forecast, physical damage to oil infrastructure was limited, but the Strait of Hormuz was effectively closed to most shipping traffic. High uncertainty about the conflict’s effect on oil supplies has added a large risk premium to oil prices as market participants assess actual disruptions to oil flows and weigh the potential for those disruptions to persist.
The primary risk that would cause oil prices to continue rising is an extended closure of the Strait of Hormuz, which is a major world oil transit chokepoint through which nearly 20% of global oil supply flows. Although the Strait of Hormuz is not physically blocked, the threat of attack by Iran and the cancellation of insurance coverage have led most tankers to avoid transiting the Strait. As a result, some oil production in the region has been shut in. If this reduction in vessel volume persists, oil storage behind the chokepoint will quickly fill, causing oil producers to shut in even more production, lending further support to oil prices.
Running our model requires making a number of assumptions about an environment that is evolving and uncertain. In this analysis, we make the assumption that shut-in oil production will peak in early April, mostly in Iraq with smaller volumes in Kuwait, the United Arab Emirates, and Saudi Arabia. We make the further assumption that shut-in production will gradually ease as transit through the Strait resumes. We expect some near-term disruptions of oil flows and related production shut-ins, along with a persistent risk premium, to keep Brent prices at an average of $91/b in the second quarter of 2026 (2Q26). Once oil flows are reestablished through the Strait of Hormuz, we expect global oil production to continue to outpace consumption over our forecast period, resulting in global oil inventories increasing by an average of 1.9 million barrels per day (b/d) in 2026 and by 3.0 million b/d in 2027. Growing oil inventories will again begin to weigh on oil prices, and we expect the Brent price to fall to an average of $70/b in 4Q26 and $64/b in 2027.
On March 1, OPEC+ agreed to begin increasing production in April 2026 by a total of 206,000 b/d in response to estimated low oil inventories, with the next decision to come on April 5. Although OPEC+ will not announce its planned 2027 targets until 4Q26, we do not expect OPEC+ to significantly increase production next year, given estimates of significant inventory builds over the forecast period. Our current assumption around OPEC+ supply is also contingent on the duration and extent of disruption to oil flows around the Strait of Hormuz.
U.S. Petroleum Products
U.S. crude oil production
Higher crude oil prices lead to more U.S. crude oil production in our forecast. We expect crude oil production in the United States to average 13.6 million barrels per day (b/d) in 2026 and 13.8 million b/d in 2027. Our 2027 forecast is an upward revision of about 0.5 million b/d (4%) from last month's Short-Term Energy Outlook (STEO). The West Texas Intermediate (WTI) crude oil price in our forecast is substantially higher than last month, averaging $74/b in 2026 and $61/b in 2027, compared with $53/b and $49/b, respectively, in the February STEO.
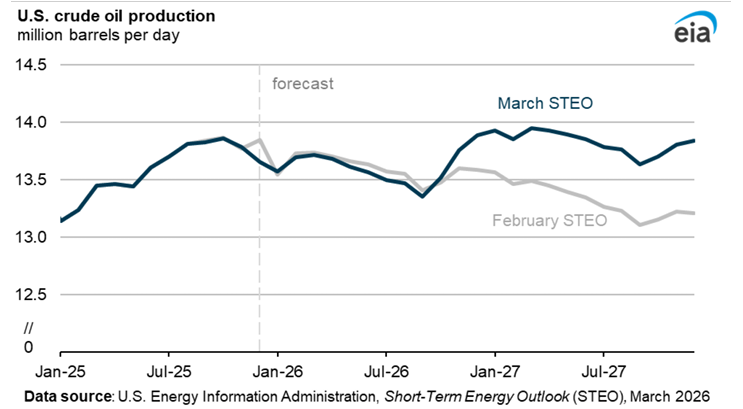
Because changes in oil prices take time to affect production—moving from investment decisions to rig deployment to well completion and first oil—the effect of higher prices in our forecast is more pronounced in 2027 than in 2026, with production increasing from 13.4 million b/d in September 2026 to 13.8 million b/d in 2027. The higher prices support increased drilling activity across most basins, and expanded pipeline capacity in the Permian region allows more associated natural gas to be brought to market, further supporting oil-directed operations. We increased our forecast for crude oil production in the Permian region by 6% in 2027 as new pipeline capacity and price incentives support growth.
We implemented a new modeling system for forecasting crude oil and natural gas production in the U.S. Lower 48 states this month. The new model modernizes our IT platform and enables more detailed, well-level decline curve analysis and calibration to recent historical production that will allow us to have more flexibility in reacting to changes in oil markets. The new model also employs an improved methodology for benchmarking to survey data from EIA-914, Monthly Crude Oil and Lease Condensate, and Natural Gas Production Report, using well-level production information to better inform the forecast in states where well reporting data are still incomplete.
U.S. retail gasoline prices
The U.S. average retail gasoline price in our forecast averages $3.58 per gallon (gal) in March. Relative to last month’s STEO, higher crude oil prices contribute to gasoline prices that are 60 cents/gal higher in March and about 70 cents/gal higher in the second quarter of 2026. Prices decline in the third and fourth quarters, falling back close to $3.00/gal by the end of the year. Our annual average forecast for retail gasoline prices in 2026 is now $3.34/gal. In 2027, we expect annual average retail gasoline prices to fall below $3.20/gal. Our 2027 forecast is up 25 cents/gal compared with our February STEO.
Crude oil prices typically constitute around half the total retail price of gasoline. Other factors include, but are not limited to, refinery margins (subtracting crude oil cost from the refined product price) and retail margins (subtracting wholesale gasoline cost from the pump price). Although we expect most of the gasoline price increase to be passed through to the retail price in the coming weeks, we also expect that the normalization of refining and retail margins will occur more slowly. The net effect will be continued upward pressure in the second quarter that lags behind the initial increase.
Well-above-average seasonal gasoline inventories reported in our Weekly Petroleum Status Report support our outlook for higher inventories of gasoline in 2026, which contributes to some downward pressure on refiner and retail margins.
Natural Gas
Natural gas market update
In our forecast, the Henry Hub spot price averages almost $3.80 per million British thermal units (MMBtu) in 2026, or 13% less than our forecast last month. We reduced our forecast for prices this year largely because of milder-than-expected weather in February, which led to more natural gas in storage in the coming months in our forecast. We expect prices to rise to about $3.90/MMBtu on average next year, or 12% less than our forecast last month. Lower prices in 2027 reflect higher natural gas production than in our previous forecast, which raises our expectations of natural gas inventories next year.
Reductions in the flow of liquified natural gas (LNG) through the Strait of Hormuz have caused natural gas prices in Europe and Asia to increase. However, we expect U.S. natural gas prices to be relatively unaffected by this development, as LNG export facilities were already operating at a high level of utilization before the Middle East conflict, limiting the ability to export additional volumes in the near term. Most of the flexibility in exports will be in the ramp-up at Corpus Christi State 3 (Train 5), which was completed in February, and at Golden Pass Train 1, which is set to come online this month.
Natural gas production
Marketed natural gas production in the Lower 48 states reached a record high in November at 118.5 billion cubic feet per day (Bcf/d), and we estimate production will average 117.8 Bcf/d this winter (November—March), which is 2% more than our October STEO forecast. The increased production, stemming primarily from increased associated gas production from the Permian and the rest of the U.S. Lower 48 states regions, offset the temporary drop in production during Winter Storm Fern. In February, production nearly recovered after the 3.6 Bcf/d decrease in January, which was concentrated in the Appalachia region (-1.3 Bcf/d) and Permian region (-1.3 Bcf/d).
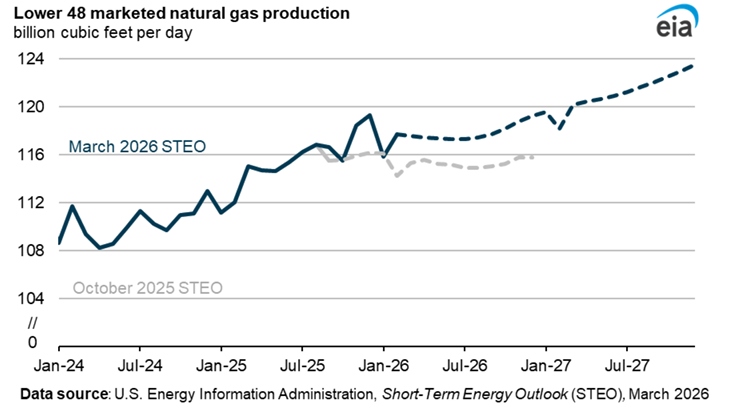
We expect marketed natural gas production to rise through our forecast period, averaging 118 Bcf/d in 2026 and 121 Bcf/d in 2027, relative to 116 Bcf/d in 2025. We expect the growth in natural gas production to originate from the Haynesville, Permian, and Appalachia regions. Elevated oil prices will drive more oil-directed drilling in the Permian, which will contribute to greater volumes of associated natural gas production.
Natural gas storage
We expect U.S. natural gas inventories to end the winter season at 1,840 billion cubic feet (Bcf), 148 Bcf lower than forecasted heading into the winter season in our October 2025 STEO but similar to the five-year (2021–2025) average. In January, natural gas stocks dropped to 2,493 Bcf, reflecting the historic withdrawals in response to Winter Storm Fern.
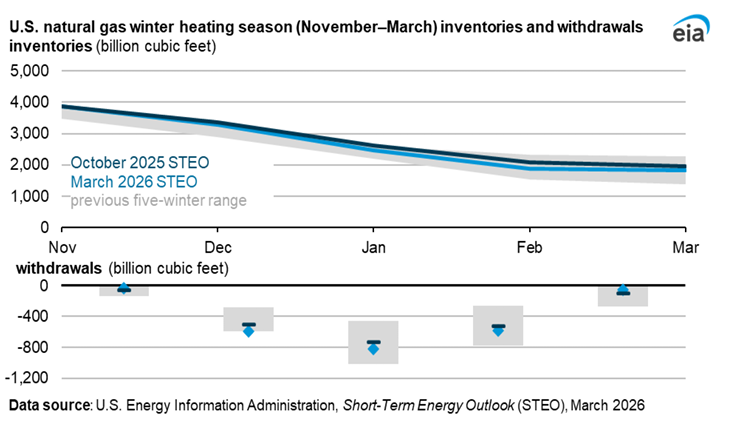
Based on data from the National Oceanic and Atmospheric Administration, the 2025–2026 winter season (November–March) will have 2% more heating degree days (HDDs) than the 10-year average and 4% more HDDs compared with the October 2025 STEO forecast. Although we have had colder weather that has contributed to record high spot prices, production was higher than expected throughout the winter, which helped dampen the effect of January’s large storage withdrawals, keeping storage levels close to or above average through the winter.
We now expect natural gas inventories to end the withdrawal season near the five-year average, whereas in October, we forecast stocks would end the season 8% above average. We expect regional inventories to be lower relative to the five-year average in the Midwest (-22%) and East (-21%) regions and close to average in the South Central region, while we expect above-average inventories in the Pacific region (48%) and the Mountain region (50%) as we head into summer.
Electricity, Coal, and Renewables
Electricity generation
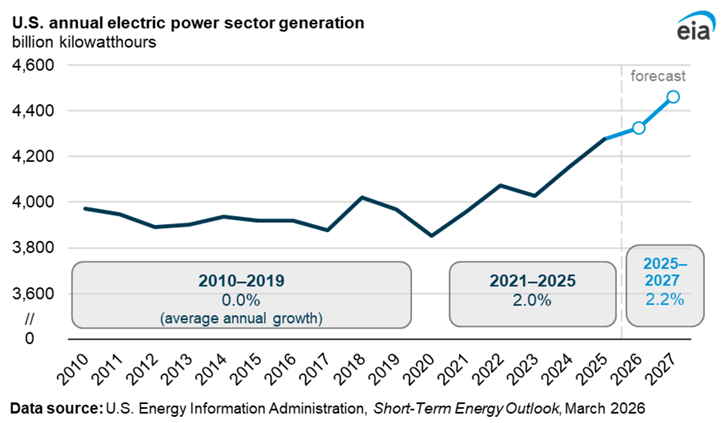
In 2025, the U.S. electric power sector generated 4,275 billion kilowatthours (BkWh) of electricity, an increase of 2.9% from 2024. We expect U.S. electricity generation to grow by 1.2% in 2026 and by 3.1% in 2027, which follows recent upward trends in generation to meet growing electricity demand. Between 2010 and 2019, electricity generation was essentially unchanged as electricity demand from a growing population was offset by the use of more efficient appliances and heating and cooling equipment. But since 2021, the U.S. generation has been growing at an average of about 2% per year.
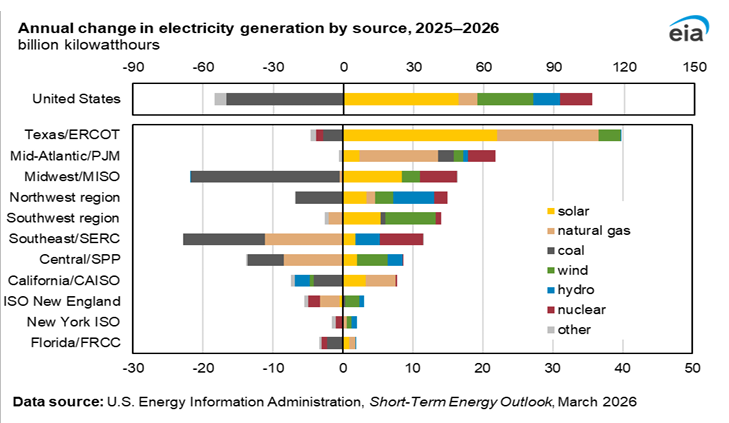
In the area of the country where the grid is operated by the Electric Reliability Council of Texas (ERCOT), we forecast total electricity generation will increase by 35 BkWh, or 7.3%, between 2025 and 2026. Generation from almost all energy sources increases in ERCOT, with similar increases from solar and natural gas-fired power plants.
Forecast natural gas generation in most other regions of the country decreases in 2026 in response to higher fuel costs, with the U.S. price of natural gas delivered to generators increasing 3% this year. We forecast total U.S. generation from natural gas increases by 8 BkWh (0.5%) between 2025 and 2026.
Although higher natural gas prices tend to favor generation from coal-fired power plants as a substitute source of electricity, electric power plant operators indicate they will retire 4% of U.S. coal-fired generating capacity in 2026 unless power plant operators change their plans. This loss of capacity, along with rising generation from renewables, contributes to our forecast that U.S. coal generation will decline by 50 BkWh (7%) in 2026, with most of that decline occurring in the Midwest and Southeast regions.
Coal markets
U.S. coal exports totaled 93 million short tons (MMst) in 2025, a drop of 16 MMst compared with 2024. The decline reflected low prices for both thermal and metallurgical coal last year, as the seaborne market remained well supplied amid relatively weak demand. The decline was led by an 18% drop in thermal coal exports, with metallurgical coal exports falling 11%. The steep drop in U.S. coal exports also reflected a strengthened domestic market, with coal generation for electric power in the United States rising by 13% in 2025.
We expect U.S. exports to recover modestly in 2026. The increase is led by a 7% increase in metallurgical exports, with elevated prices to start the year due in part to weather-related disruptions in Australian supply. These price increases are expected to fade, but Warrior Met Coal’s Blue Creek mine opening, along with the reopening of Allegheny Metallurgical’s Longview mine and Core Natural Resources’ Leer South mine, is expected to increase the amount of U.S. metallurgical coal available for sale in the seaborne market. Although seaborne thermal prices also have been modestly elevated recently due to supply constraints, we expect U.S. thermal coal exports to rise slightly in 2026 at 44 MMst and to remain flat in 2027. Prices for thermal coal in international markets jumped in early March and continue to rise, which may offer opportunities for U.S. coal exports to increase if higher prices are sustained.
Economy, CO2, and Weather
U.S. macroeconomics
To generate the macroeconomic assumptions in the Short-Term Energy Outlook (STEO), we input STEO energy price forecasts into S&P Global’s Short-Term U.S. Macroeconomic Model to produce a conditional macroeconomic forecast. For more details on the macroeconomic model, see our documentation.
S&P Global’s forecast that underlies this STEO was finalized before the U.S. Supreme Court ruling that rescinded some tariffs. The forecast assumes an average effective tariff rate of approximately 14%.
Emissions
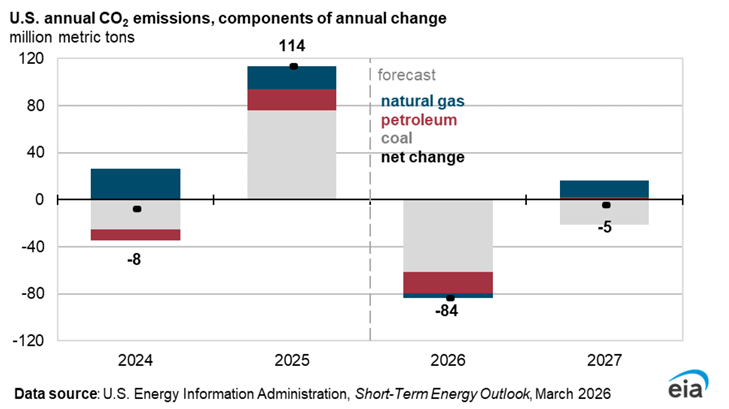
We forecast U.S. energy-related carbon dioxide (CO2) emissions to decrease by 1.7% in 2026 relative to 2025 and to decrease by an additional 0.1% in 2027 relative to 2026. In both years, decreases in CO2 emissions are due primarily to expected declines in coal consumption, most of which occurs at power plants for electricity generation.
Weather
The United States had a relatively mild February, averaging 4% fewer heating degree days (HDDs) than in February 2025, in contrast to the colder-than-normal temperatures in January. However, as this winter season (November–March) comes to an end, we expect the United States to average around 3,270 HDDs overall, 1% more than the previous winter and 2% more than the 10-year winter average, increasing fuel demand for space heating. Based on our current forecasts and data from the National Oceanic and Atmospheric Administration, we forecast that the United States will average around 530 HDDs in March, 14% more compared with March 2025 and 1% more than the 10-year March average.
----------------------------------------------------------------------------------------
Analysis of EIA Short-Term Energy Outlook March 2026:
The March 2026 EIA Short-Term Energy Outlook is not a routine monthly update. It is an event-driven forecast built around a major geopolitical energy shock: the effective disruption of oil and LNG transit through the Strait of Hormuz after military action in the Middle East. The report’s central message is clear: oil is facing a sharp near-term risk premium, but EIA still expects that premium to fade later in 2026 as flows normalize and inventories rebuild.
Big picture: what changed in this STEO
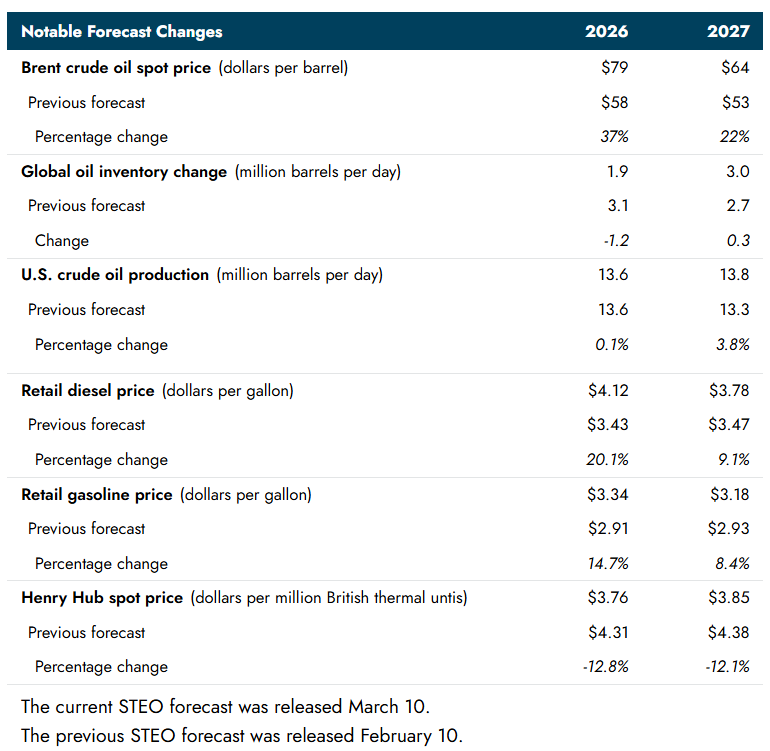
The scale of the revision is unusually large. Compared with the February STEO, EIA raised its 2026 Brent forecast to $79 per barrel from $58, lifted its 2027 Brent to $64 from $53, raised its 2026 U.S. retail gasoline to $3.34 per gallon from $2.91, and increased its 2026 retail diesel to $4.12 from $3.43. At the same time, it cut Henry Hub natural gas to $3.76/MMBtu for 2026 from $4.31, and lifted 2027 U.S. crude production to 13.8 million barrels per day from 13.3 million. In market terms, this is a classic oil-up, fuel-up, gas-down, U.S.-supply-up revision.
Oil market outlook: near-term shock, softer medium-term path
Brent surged from an average of $71 per barrel on February 27 to $104 by March 9 after the conflict began. EIA says physical damage to oil infrastructure was still limited as of March 9, but shipping through the Strait of Hormuz was effectively impaired because tankers were avoiding transit amid security threats and insurance withdrawals. That is the main source of the current risk premium.
EIA’s core assumption is that shut-in Middle East production peaks in early April, led mainly by Iraq, with smaller disruptions in Kuwait, the United Arab Emirates, and Saudi Arabia, and then gradually eases as transit resumes. Under that scenario, Brent averages $91 per barrel in Q2 2026, then falls to $70 in Q4 2026 and $64 in 2027 as global production again exceeds consumption. The report also projects global oil inventory builds of 1.9 million barrels per day in 2026 and 3.0 million barrels per day in 2027.
That matters because the report is not arguing for a structural multi-year oil bull market. It is arguing for a front-loaded geopolitical spike followed by rebalancing once the Strait of Hormuz disruption fades. That is the most important strategic takeaway from the March STEO. This is an inference from EIA’s stated price path and inventory outlook.
U.S. crude production: stronger response, especially in 2027
Higher crude prices pull more U.S. barrels into the forecast. EIA now expects U.S. crude production to average 13.6 million barrels per day in 2026 and 13.8 million in 2027, with the 2027 figure about 0.5 million barrels per day higher than last month’s forecast. The report also says the effect is more visible in 2027 because higher prices take time to move through the investment cycle, from capital allocation to rigs, completions, and first oil.
The Permian Basin is central to that response. EIA says expanded pipeline capacity and better price incentives led it to raise its 2027 Permian crude forecast by 6%, while higher oil prices also support more associated gas production. The report’s implicit message is that U.S. shale remains responsive when price signals improve, even if the response comes with a lag.
Gasoline and diesel: consumer pain now, easing later
For refined products, the near-term inflation impulse is real. EIA forecasts the average U.S. retail gasoline price at $3.58 per gallon in March, around 60 cents higher than last month’s STEO for March, and about 70 cents higher in Q2 2026. It expects prices to ease later, drifting back toward $3.00 per gallon by year-end, with the annual average at $3.34 in 2026 and below $3.20 in 2027.
The report also notes that crude typically makes up roughly half of the pump price, while refinery and retail margins explain much of the rest. EIA expects the crude shock to pass through relatively quickly, but margin normalization to happen more slowly, which means upward pressure in Q2 can persist even after the first oil spike. That makes the report modestly hawkish for the short-run fuel inflation impulse, even if it does not imply a lasting inflation spiral. The inflation interpretation here is an inference from EIA’s fuel-price and margin discussion.
Natural gas: much less dramatic than oil in the United States
The report draws a sharp contrast between oil and U.S. gas. Although lower LNG flows through the Strait of Hormuz have pushed gas prices up in Europe and Asia, EIA says U.S. natural gas prices should be relatively unaffected because U.S. export facilities were already running at high utilization before the conflict, leaving limited room to export materially more in the near term.
That is why EIA now expects the Henry Hub spot price to average about $3.80/MMBtu in 2026 and about $3.90 in 2027, both below last month’s forecast. The main reason is not weak demand but milder-than-expected February weather, which left more gas in storage than EIA had expected. At the same time, associated gas output rises as oil drilling improves.
On supply, EIA expects marketed natural gas production to average 118 Bcf/d in 2026 and 121 Bcf/d in 2027, up from 116 Bcf/d in 2025, with growth led by Haynesville, Permian, and Appalachia. For storage, it expects inventories to end the winter season near 1,840 Bcf, close to the five-year average, rather than materially above average. Regionally, EIA expects lower-than-average inventories in the Midwest and East, but above-average levels in the Pacific and Mountain regions going into summer.
The practical market conclusion is straightforward: global oil is the crisis market; U.S. natural gas is not. Gas still has weather and storage sensitivity, but the March STEO does not support the idea of a sustained U.S. gas shock comparable to oil. This is an inference from EIA’s price, storage, and LNG-utilization assumptions.
Electricity, coal, and renewables: demand growth continues, coal still loses share
EIA says U.S. electricity generation rose to 4,275 billion kilowatthours in 2025, up 2.9% from 2024, and forecasts another 1.2% increase in 2026 and 3.1% in 2027. Since 2021, the generation has been growing by about 2% per year on average, marking a clear break from the flat 2010-2019 period.
The standout region is ERCOT, where EIA forecasts total generation rising by 35 BkWh, or 7.3%, between 2025 and 2026. It says almost all major fuel sources increase there, with especially notable gains from solar and natural gas-fired generation. That makes Texas one of the most important structural power-demand stories in the report.
Coal gets some support from higher gas costs, but not enough to reverse its decline. EIA says power plant operators plan to retire about 4% of U.S. coal-fired generating capacity in 2026, and as a result, it expects coal generation to fall by 50 BkWh, or 7%, in 2026, with much of the drop concentrated in the Midwest and Southeast.
Coal exports and emissions
U.S. coal exports totaled 93 million short tons in 2025, down 16 million short tons from 2024, with thermal coal exports down 18% and metallurgical coal exports down 11%. EIA expects a modest recovery in 2026, led by a 7% increase in metallurgical coal exports, helped by new or reopened mine capacity. It also notes that higher thermal coal prices in international markets could support U.S. exports if those prices hold.
Even so, the longer-run environmental direction in the report remains softer carbon intensity. EIA forecasts U.S. energy-related CO2 emissions down 1.7% in 2026 and down another 0.1% in 2027, driven mainly by lower coal consumption in the power sector.
Macro and weather caveat
One important caveat sits outside the commodity headlines. EIA says the S&P Global macroeconomic forecast embedded in this STEO was finalized before the U.S. Supreme Court ruling that rescinded some tariffs, and it assumes an average effective tariff rate of about 14%. That means the macro backdrop inside this STEO is already somewhat conditional and should not be treated as a fully updated macro base case beyond that point.
On weather, EIA says the 2025-2026 winter season should finish with 2% more heating degree days than the 10-year average and 1% more than the prior winter, while March is expected to average about 530 HDDs, or 14% more than March 2025. That helps explain why gas demand stayed supportive, even though February itself was relatively mild.
What this means for traders and investors
For oil traders, the report supports a bullish near-term but softer medium-term framework. The key variable is the duration of disruption around the Strait of Hormuz. If disruption lasts longer than EIA assumes, Brent could stay above the report’s path for longer. If flows normalize faster, the downside toward the later-2026 forecast could arrive sooner. That conclusion is an inference from EIA’s explicit scenario assumptions.
For energy equities, the report is constructive for U.S. upstream producers, especially names exposed to the Permian and to associated gas growth. It is less friendly for fuel-sensitive sectors in the near term because higher gasoline and diesel prices keep pressure on transport, logistics, and discretionary consumption. This sector read is an inference from EIA’s crude, gasoline, and diesel forecasts.
For natural gas traders, the STEO is not confirming a major bullish U.S. gas thesis. Storage is tighter than EIA expected in October, but still near the five-year average. Production is rising, and export constraints limit the immediate ability to translate overseas tightness into sharply higher U.S. prices.
For macro investors, the message is that the energy shock is concentrated in oil and refined products, not broadly across all U.S. energy markets. That matters for inflation pricing, bond markets, and policy expectations because the fuel shock can lift near-term inflation prints without necessarily creating a broad-based energy inflation regime. This macro interpretation is an inference from the report’s divergence between oil and Henry Hub.
Bottom line
The March 2026 STEO says the global energy market is dealing with a serious oil shock, but EIA still views it as a shock, not a new permanent equilibrium. Brent is high because of conflict risk and disrupted transit through the Strait of Hormuz. U.S. shale responds with a lag, gasoline and diesel rise sharply in the near term, U.S. natural gas stays relatively contained, and electricity demand growth, especially in ERCOT, remains one of the clearest structural themes in the report.
Source: U.S. Energy Information Administration, Short-Term Energy Outlook, released March 10, 2026.
Comments