 English
 پارسی


OPEC Monthly Oil Market Report March 2026:
Oil Market Highlights
- Crude Oil Price Movements
In February, the OPEC Reference Basket (ORB) value increased by $5.59/b, month-on-month (m-o-m), to average $67.90/b. The ICE Brent front-month contract increased by $4.64/b, m-o-m, to average $69.37/b, and the NYMEX WTI front-month contract increased by $4.26/b, m-o-m, to average $64.52/b. The GME Oman front-month contract increased by $5.63/b, m-o-m, to $68.42/b. The Brent–WTI front-month spread increased by $0.38/b, m-o-m, to average $4.85/b. The forward curves of all major crude benchmarks remained in backwardation. The structure continued to be supported by firm physical market fundamentals, alongside supply outages and concerns over potential supply disruptions amid geopolitical developments. Hedge funds and other money managers turned increasingly bullish, boosting net long positions by 46%, m-o-m.
- World Economy
The global economic growth forecasts remain unchanged from last month’s assessment at 3.1% for 2026 and 3.2% for 2027. The US economic growth forecasts remain at 2.2% for 2026 and 2% for 2027. In the Eurozone, the economic growth forecasts remain at 1.2% for both 2026 and 2027. Japan’s economic growth forecasts remain at 0.9% for both 2026 and 2027. The economic growth forecasts for China remain at 4.5% for both 2026 and 2027. India’s economic growth forecasts remain at 6.6% for 2026 and 6.5% for 2027. Brazil’s economic growth forecasts remain at 2.0% for 2026 and 2.2% for 2027. Russia’s economic growth forecasts remain at 1.3% for 2026 and 1.5% for 2027.
- World Oil Demand
The global oil demand growth forecast for 2026 remains at a healthy 1.4 mb/d, y-o-y, unchanged from last month’s assessment. The OECD is forecast to grow by 0.15 mb/d, while the non-OECD is forecast to grow by about 1.2 mb/d. In 2027, global oil demand is forecast to grow by about 1.3 mb/d, y-o-y, unchanged from last month’s assessment. The OECD is
- World Oil Supply
Non-DoC liquids production (i.e., liquids production from countries not participating in the Declaration of Cooperation) is forecast to grow by about 0.6 mb/d, y-o-y, in 2026, unchanged from last month’s assessment, mainly driven by Brazil, Canada, the US, and Argentina. In 2027, non-DoC liquids production is also forecast to grow by about 0.6 mb/d, unchanged from last month’s assessment, mainly driven by Brazil, Canada, Qatar, and Argentina. Natural gas liquids (NGLs) and non-conventional liquids from countries participating in the DoC are forecast to grow by 0.1 mb/d, y-o-y, in 2026, to average about 8.8 mb/d, followed by similar growth in 2027 of about 0.1 mb/d, y-o-y, to average about 8.9 mb/d. In February, crude oil production by countries participating in the DoC increased by 445 tb/d, m-o-m, to average about 42.72 mb/d, according to available secondary sources.
- Product Markets and Refining Operations
In February, refining margins in the Atlantic Basin increased, given the reduction in product output due to seasonal refinery maintenance. Moreover, geopolitical tensions and concerns over product flow disruptions further contributed to upward pressure on product margins. On the US Gulf Coast (USGC), margins were backed by gasoline and middle distillate strength, while in Rotterdam, gains were seen across the barrel, except for low-sulphur fuel oil (LSFO). Refining margins in Singapore moved downwards as regional gasoline inventory builds, higher jet/kerosene availability in Southeast Asia, and stronger feedstock prices weighed on regional refining margins.
- Tanker Market
VLCC spot freight rates showed a strong performance in February, as fleet consolidation and rising tanker demand on long-haul routes tightened availability. On the Middle East-to-East route, spot freight rates rose by 65%, m-o-m. Suezmax spot freight rates edged higher, lifted in part by spill-over support from the exceptionally strong VLCC market. Spot freight rates on the US Gulf Coast-to-Europe route rose by 7%, m-o-m. Aframax rates strengthened, particularly in the East of Suez. Rates on the Indonesia-to-East route were up 21%, m-o-m, and intra-Med rates increased 14%, m-o-m. Clean spot freight rates weakened East of Suez and edged slightly higher West of Suez as the maintenance season boosted the need for product imports.
- Crude and Refined Product Trade
US crude imports rose by 5%, m-o-m, in February, while crude exports from the US averaged 4.2 mb/d, up by 87 tb/d, m-o-m. Product exports slipped to 6.7 mb/d, although flows of distillate and residual fuel oil remained strong. In January, crude imports into OECD Europe are estimated to have been below the 5-year range, as refinery closures reduced import requirements. Product imports into OECD Europe fell compared to the previous month, with declines across all major categories. Meanwhile, Japan’s crude imports fell back in January from a multiyear high the month before to average 2.5 mb/d. Product exports from Japan moved above the five-year range, supported by higher outflows of gasoline and gasoil amid healthy margins in the region. Crude imports into China are estimated to have begun the year above the five-year average, at 12 mb/d, although supply sources varied from the previous month. Product imports into China remained above the five-year range, despite a seasonal decline, m-o-m. India’s crude imports averaged just below 5 mb/d in January. Product imports performed well at 1.3 mb/d, while exports matched the five-year average.
- Commercial Stock Movements
Preliminary January 2026 data show that OECD commercial oil inventories fell by 19.9 mb, m-o-m, to stand at 2,824 mb. At this level, OECD commercial stocks were 70.5 mb higher, y-o-y, and 9.8 mb above the latest five-year average, but 103.1 mb below the 2015–2019 average. Within the components, crude and products stocks fell by 3.0 mb and 16.9 mb, m-o-m, respectively. OECD crude oil commercial stocks stood at 1,313 mb. This was 24.6 mb higher, y-o-y, but 26.9 mb below the latest five-year average, and 118.1 mb lower than the 2015–2019 average. OECD total product stocks stood at 1,511 mb in January. This was 45.9 mb higher, y-o-y, 36.6 mb above the latest five-year average, and 15.0 mb above the 2015–2019 average. In terms of days of forward cover, OECD commercial stocks fell by 0.8 days, m-o-m, in January, to stand at 62.0 days. This was 1.3 days higher than in January 2025, but 0.8 days lower than the latest five-year average and in line with the 2015–2019 average.
- Balance of Supply and Demand
The demand for DoC crude (i.e., crude from countries participating in the DoC) in 2026 is unchanged from the previous month’s assessment of 42.9 mb/d, which is about 0.6 mb/d higher than in 2025. The demand for DoC crude in 2027 remains unchanged from the previous month’s assessment, to stand at 43.6 mb/d, which is about 0.6 mb/d higher than the 2026 forecast.
Full Analysis, Outlook and Market Implications
For traders, investors and energy-market observers, the message is clear: OPEC still sees a healthy oil market balance, steady non-OECD demand growth, modest non-DoC supply growth, and a continued need for DoC crude through 2026 and 2027.
Key Takeaways from the OPEC March 2026 Report
The OPEC Reference Basket rose by $5.59/b month-on-month to $67.90/b in February. ICE Brent averaged $69.37/b, NYMEX WTI $64.52/b, and GME Oman $68.42/b. Forward curves remained in backwardation, while hedge funds and money managers increased net long positions by 46% month-on-month, underscoring stronger bullish positioning in oil futures.
OPEC kept its global economic growth forecasts unchanged at 3.1% for 2026 and 3.2% for 2027. It also left its global oil demand growth forecast unchanged at 1.4 mb/d in 2026 and 1.3 mb/d in 2027, with the bulk of growth still expected to come from non-OECD economies.
On the supply side, non-DoC liquids production is still expected to grow by 0.6 mb/d in 2026 to average 54.8 mb/d, and by another 0.6 mb/d in 2027 to average 55.4 mb/d. Meanwhile, the demand for DoC crude is projected at 42.9 mb/d in 2026 and 43.6 mb/d in 2027, showing that the market still requires sizeable DoC barrels even with non-DoC growth continuing.
Global Economy: Growth Holds Up, Risks Remain
OPEC’s feature article and world economy section frame the oil outlook around a still-resilient global macro backdrop. The organization expects world GDP growth at 3.1% in 2026 and 3.2% in 2027, unchanged from the previous month. Country and regional forecasts were also left unchanged: the US at 2.2% in 2026 and 2.0% in 2027, the Eurozone at 1.2% in both years, Japan at 0.9% in both years, China at 4.5% in both years, India at 6.6% in 2026 and 6.5% in 2027, Brazil at 2.0% and 2.2%, and Russia at 1.3% and 1.5%.
OPEC argues that the macro backdrop remains supported by several factors: early-year US fiscal support, China’s policy backing following the “Two Sessions,” growing fiscal stimulus in Japan and Germany, and continued strength in India. It also noted that the most recent US Supreme Court ruling lowered the effective US tariff rate, which it sees as broadly supportive for global trade, though trade negotiations and geopolitical developments still require close monitoring.
This matters for oil because OPEC continues to link demand resilience to stable household consumption in advanced economies and policy-supported expansion across major emerging markets. In other words, the organization is not forecasting a demand shock; it is still forecasting a steady expansionary environment for petroleum consumption.
Crude Oil Prices: February Strength Driven by Fundamentals and Risk Premiums
Crude benchmarks strengthened notably in February. OPEC says the move was driven by firm physical fundamentals, supply outages, and geopolitical risk premiums, with the strongest support visible in the prompt market. The ORB rose to $67.90/b, while North Sea Dated averaged $71.09/b and Dubai averaged $68.26/b.
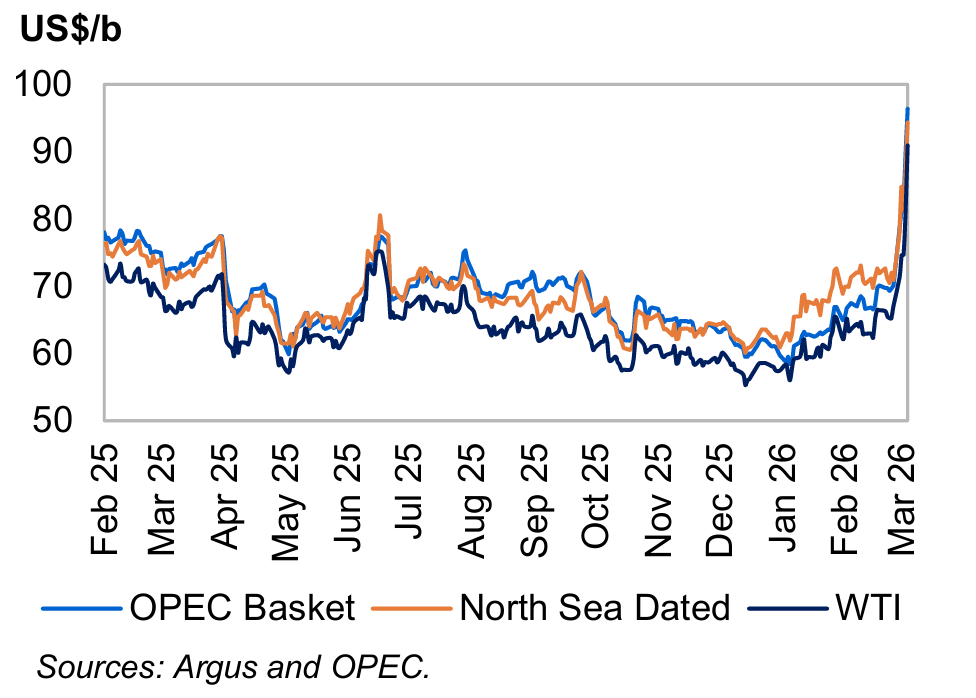
Crude benchmarks moved higher through February, with the OPEC Basket, North Sea Dated, and WTI all posting clear month-on-month gains.
The report notes that spot crude prices remained supported by strong buying from Asia-Pacific, robust interest in Northwest Europe, higher refining margins in Europe and the US Gulf Coast, and concerns over near-term supply availability due to disruptions in the Caspian region, the US and North Africa.
In futures, Brent, WTI and Oman all moved higher. The Brent-WTI front-month spread widened to $4.85/b, keeping US crude relatively competitive internationally. OPEC also highlights a sharp rise in speculative interest: ICE Brent-related net longs reached their highest level since April 2024, while WTI net length hit its highest level since July 2025.
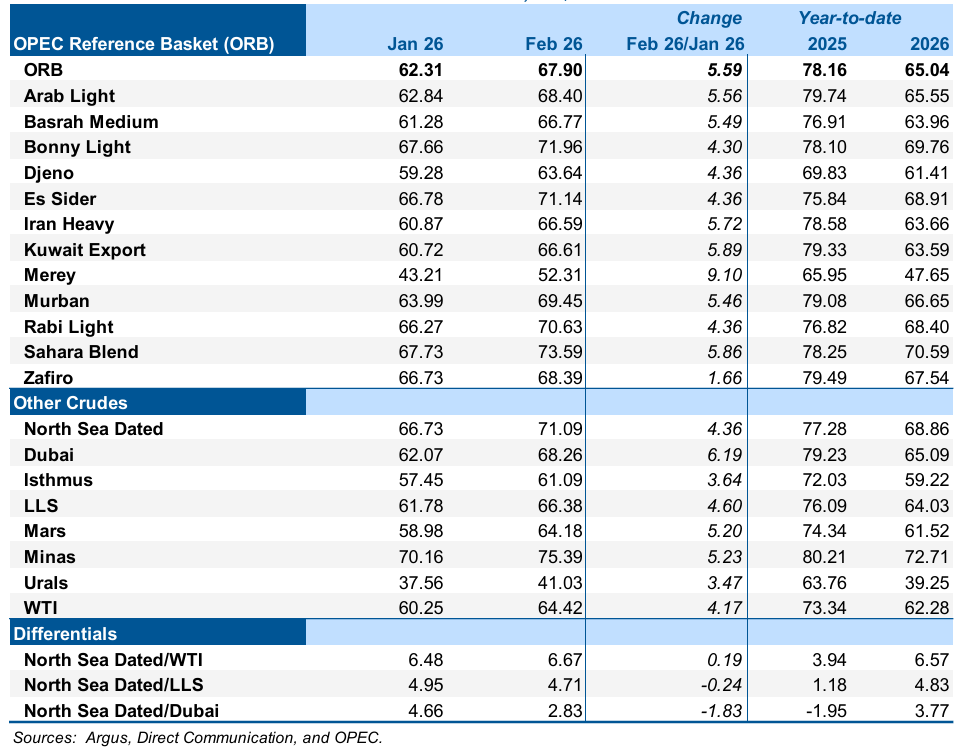
From a market-structure perspective, the important signal is that backwardation persisted across the main benchmarks. That generally points to a market where near-term fundamentals remain tighter than longer-dated expectations. OPEC specifically notes that the GME Oman structure strengthened as demand for medium-sour barrels from Asia-Pacific buyers remained firm.
Commodity Markets: Energy Mixed, Precious Metals Strong
The commodity backdrop was mixed in February. OPEC says the energy price index fell 0.5% month-on-month, as lower US and European natural gas prices offset gains in coal and crude. Average crude oil prices still rose 6.9% month-on-month to $68.0/b, but remained 7.9% below year-earlier levels. Henry Hub natural gas saw a sharp correction, dropping 52.3% month-on-month, while European gas fell 4.4%.
Outside energy, the base metals index slipped 1.1% month-on-month, though it remained sharply higher year-on-year. Gold stood out again, rising 5.6% month-on-month to $5,020/oz, supported by safe-haven demand, central bank diversification and lower US real yields. OPEC also noted a continued rally in lithium, which rose 21.3% month-on-month.
For oil markets, this mixed commodity picture matters because it suggests macro demand conditions are still constructive, but not uniformly strong across all industrial inputs. Oil is benefiting more from physical tightness and geopolitics than from a broad-based commodity boom. That is an important distinction for traders positioning into 2Q26.
World Oil Demand: OPEC Keeps 2026 and 2027 Growth Forecasts Unchanged
OPEC left its 2026 global oil demand growth forecast unchanged at 1.4 mb/d, bringing total world demand to about 106.5 mb/d for the year. For 2027, it also kept growth unchanged at 1.3 mb/d, with total demand reaching 107.9 mb/d.
The OECD is forecast to contribute only a modest part of that increase, with demand rising by 0.15 mb/d in 2026 and 0.1 mb/d in 2027. The non-OECD is expected to remain the core engine of growth, adding about 1.23 mb/d in 2026 and around 1.2 mb/d in 2027.
The regional breakdown reinforces that story. In 2026, OPEC projects oil demand of 17.08 mb/d in China, 5.88 mb/d in India, 10.08 mb/d in Other Asia, 9.11 mb/d in the Middle East, 7.03 mb/d in Latin America, and 5.03 mb/d in Africa. Total OECD demand is projected at 46.08 mb/d, while total non-OECD demand is seen at 60.44 mb/d.
OPEC says transportation fuels will lead demand growth in both 2026 and 2027, especially gasoline, followed by jet fuel and petrochemical feedstocks. It specifically points to stronger mobility and petrochemical expansion in Other Asia, the Middle East, India, China and the US.
That is a constructive signal for refiners and product traders: OPEC is not just forecasting higher crude demand in aggregate, it is pointing to specific product categories and regions where end-use strength should remain visible.
Middle East Demand Outlook: A Quiet but Important Growth Story
One of the more useful sub-themes in the report is the Middle East demand outlook. OPEC expects regional demand to rise by about 0.2 mb/d in 2026 to 9.1 mb/d, with most of the increase coming from Saudi Arabia, Iraq and the UAE. For 2027, it sees another 0.2 mb/d increase to 9.3 mb/d.
The drivers are familiar but important: non-oil economic growth, infrastructure spending, diversification, private consumption, air travel and strong mobility. OPEC also expects gradual reductions in direct crude burning for power generation to continue shaping the region’s product mix.
This matters for the global balance because Middle East demand is often overlooked when compared with China and India, yet OPEC still sees it as a meaningful part of non-OECD oil demand expansion.
World Oil Supply: Non-DoC Growth Continues, But Modestly
OPEC expects non-DoC liquids production to rise by 0.6 mb/d in 2026 to average 54.8 mb/d, unchanged from the previous month. The main growth engines are still Brazil, Canada, the US and Argentina. In 2027, OPEC sees another 0.6 mb/d increase to 55.4 mb/d, led by Brazil, Canada, Qatar and Argentina.
At the same time, DoC NGLs and non-conventional liquids are forecast to increase by around 0.1 mb/d in 2026 to about 8.8 mb/d, and by another 0.1 mb/d in 2027 to around 8.9 mb/d. Preliminary data show combined DoC NGLs and non-conventional liquids averaged 8.7 mb/d in 1Q26, with OPEC Member Countries at about 6.0 mb/d and non-OPEC DoC countries around 2.7 mb/d.
OPEC also reports that DoC crude oil production increased by 445 tb/d month-on-month in February to 42.72 mb/d, according to secondary sources.
The practical implication is that non-DoC supply growth is still real, but it is not explosive. OPEC’s framework still points to a market where demand growth stays ahead of non-DoC liquids growth by enough to preserve the call on DoC crude.
Refining and Product Markets: Atlantic Basin Stronger, Singapore Weaker
Refining margins moved unevenly by region in February. OPEC says margins in the Atlantic Basin increased, helped by lower product output due to maintenance and by geopolitical concerns over product flows. On the US Gulf Coast, gasoline and middle distillates led the strength, while in Rotterdam gains were seen across most of the barrel except low-sulphur fuel oil.
Singapore was the weak spot. OPEC says refining margins there fell as gasoline inventories built, jet/kerosene availability in Southeast Asia improved, and feedstock costs rose. Refining margins against Oman averaged $3.40/b, which was $2.11/b lower month-on-month and $0.63/b lower year-on-year.
Refinery operations reflected those regional patterns. In February, US refinery utilization averaged 89.08%, with throughput at 16.16 mb/d, down 650 tb/d month-on-month. EU-14 plus the UK and Norway averaged 83.14% utilization with 9.30 mb/d throughput, down 380 tb/d month-on-month. By contrast, Selected Asia averaged 94.35% utilization and 27.90 mb/d throughput, up 160 tb/d month-on-month.
This split is useful for product-market positioning: the Atlantic Basin looked tighter because maintenance reduced supply, while Asia looked softer because product availability increased faster than regional demand.
Tanker Market: Freight Rates Surge, Especially for VLCCs
One of the most bullish operational signals in the report came from the tanker market. OPEC says VLCC spot freight rates surged in February, driven by fleet consolidation and stronger long-haul demand. On average, VLCC rates rose 57% month-on-month and were 140% higher year-on-year. The Middle East-to-East route jumped 65% month-on-month to WS160, Middle East-to-West rose 51% to WS80, and West Africa-to-East climbed 52% to WS143.
Suezmax rates also strengthened, averaging 10% higher month-on-month and 89% above year-earlier levels. The West Africa-to-USGC route averaged WS159, up 13% month-on-month, while USGC-to-Europe averaged WS140, up 7% month-on-month. Aframax rates strengthened too, especially East of Suez.
These freight dynamics matter because they increase transport costs, support regional crude differentials, and can reinforce prompt-market tightness even when outright supply is not collapsing. Higher freight often acts as an additional bullish layer in the physical market.
Trade Flows: US Exports Firm, China and India Imports Still Strong
In trade, OPEC says US crude imports rose 5% month-on-month in February, while US crude exports averaged 4.2 mb/d, up by 87 tb/d. US product exports eased to 6.7 mb/d, but distillate and residual fuel oil exports remained strong.
In OECD Europe, January crude imports were estimated below the five-year range due to refinery closures, while product imports declined across major categories. In Japan, crude imports fell back to 2.5 mb/d after the prior month’s multiyear high, but product exports moved above the five-year range.
In China, crude imports started the year above the five-year average at 12 mb/d, while product imports also remained above the five-year range. In India, crude imports averaged just below 5 mb/d, product imports were 1.3 mb/d, and exports matched the five-year average.
The takeaway is that Asia’s import side remains supportive enough to keep medium-sour demand healthy, which aligns with OPEC’s discussion of stronger Oman structure and tighter freight markets.
OECD Commercial Stocks: Inventories Fell in January
OPEC reports that OECD commercial oil inventories fell by 19.9 mb month-on-month in January to 2,824 mb. Despite the monthly decline, stocks were still 70.5 mb above year-earlier levels and 9.8 mb above the latest five-year average, though still 103.1 mb below the 2015–2019 average.
Crude inventories stood at 1,313 mb, down 3.0 mb month-on-month, while product inventories fell 16.9 mb to 1,511 mb. OECD stocks in terms of forward cover dropped 0.8 days month-on-month to 62.0 days.
That stock picture is not overtly tight in five-year-average terms, but it also does not suggest oversupply. It is broadly consistent with OPEC’s argument that the market still requires healthy DoC crude volumes and that prompt fundamentals remain supportive.
Balance of Supply and Demand: The Call on DoC Crude Stays Firm
The report’s balance section is central to the broader oil outlook. OPEC estimates world oil demand at 106.5 mb/d in 2026 and 107.9 mb/d in 2027. Against that, non-DoC liquids production plus DoC NGLs and non-conventionals are expected to average 63.6 mb/d in 2026 and 64.3 mb/d in 2027. That leaves a required DoC crude demand of 42.9 mb/d in 2026 and 43.6 mb/d in 2027.
OPEC also shows DoC crude oil production at 41.9 mb/d in the 2026 balance table, implying a balance of -0.4 mb/d.
That small deficit-like balance is one of the most important messages in the whole report. It suggests that, under OPEC’s current assumptions, the market does not look loose. It looks relatively well-supported, especially if geopolitical risk, freight tightness and prompt backwardation remain in place.
What the OPEC March 2026 Report Means for Oil Markets
The March 2026 OPEC report is not a report of aggressive revisions. It is a report of stability. OPEC did not raise demand forecasts or slash supply expectations dramatically. Instead, it reaffirmed a view that the global economy is holding up, oil demand is still growing at a healthy pace, non-DoC supply growth remains moderate, and the market still needs substantial DoC crude.
That kind of unchanged forecast can still be market-supportive when the surrounding market structure is already firm. February’s higher crude prices, stronger tanker rates, backwardated futures curves and rising speculative net length all point in the same direction: the oil market is not behaving like one that expects a near-term glut.
The main risk variables remain the same ones OPEC flagged repeatedly: geopolitics, trade policy, and the potential knock-on effects of both on flows and confidence. But on the numbers OPEC published, the base case remains constructive rather than bearish.
Final Verdict
The OPEC Monthly Oil Market Report for March 2026 supports a broadly constructive oil-market outlook. Demand growth remains solid at 1.4 mb/d in 2026 and 1.3 mb/d in 2027, led by non-OECD economies. Non-DoC supply growth continues, but only at 0.6 mb/d per year, not enough to eliminate the need for DoC crude. Crude prices strengthened in February, inventories fell month-on-month, freight rates surged, and futures curves stayed backwardated.
In practical terms, OPEC’s latest report argues for an oil market that remains balanced-to-firm, not oversupplied. Unless macro or geopolitical conditions deteriorate sharply, the report leaves room for continued support in crude benchmarks and in the broader physical market complex.
Source: OPEC Monthly Oil Market Report, March 2026.
FAQ
What does OPEC forecast for global oil demand in 2026?
OPEC forecasts global oil demand to average about 106.5 mb/d in 2026, up 1.4 mb/d year-on-year.
What is OPEC’s oil demand forecast for 2027?
OPEC sees global oil demand rising to 107.9 mb/d in 2027, an increase of 1.3 mb/d year-on-year.
What happened to the OPEC Reference Basket in February 2026?
The OPEC Reference Basket increased by $5.59/b month-on-month to average $67.90/b.
What is OPEC’s view on non-DoC supply growth?
OPEC expects non-DoC liquids production to grow by 0.6 mb/d in 2026 to 54.8 mb/d, and by another 0.6 mb/d in 2027 to 55.4 mb/d.
What is the demand for DoC crude in 2026 and 2027?
OPEC projects demand for DoC crude at 42.9 mb/d in 2026 and 43.6 mb/d in 2027.
Comments