 English
 پارسی


Oil Market Highlights
- Crude Oil Price Movements
In January, the OPEC Reference Basket (ORB) value rose by $0.61/b, month-on-month (m-o-m), to average $62.31/b. The ICE Brent front-month contract rose by $3.10/b, m-o-m, to average $64.73/b, and the NYMEX WTI front-month contract increased by $2.39/b, m-o-m, to average $60.26/b. The GME Oman front-month contract rose by $0.83/b, m-o-m, to average $62.79/b. The Brent–WTI front-month spread rose by $0.71/b, m-o-m, to average $4.47/b. The forward curves of all major crude benchmarks strengthened, with the front end of the curves for both ICE Brent and NYMEX WTI moving into stronger backwardation. Oil supply outages, easing selling pressure from speculators, and robust physical market fundamentals supported front-month contracts. The forward curve for GME Oman was little changed, m-o-m. Speculative sentiment turned bullish, with hedge funds and other money managers sharply increasing their net long positions.
- World Economy
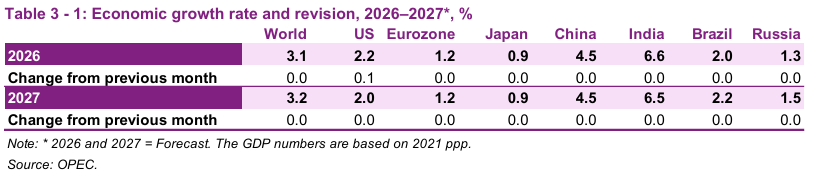
The global economic growth forecasts remain unchanged from last month’s assessment at 3.1% in 2026 and 3.2% in 2027. The US economic growth forecast is revised up slightly to 2.2% for 2026, but remains at 2% for 2027. In the Eurozone, the economic growth forecasts remain at 1.2% for both 2026 and 2027. Japan’s economic growth forecasts remain at 0.9% for both 2026 and 2027. The economic growth forecasts for China remain at 4.5% for both 2026 and 2027. India’s economic growth forecasts remain at 6.6% for 2026 and 6.5% for 2027. Brazil’s economic growth forecasts remain at 2.0% for 2026 and 2.2% for 2027. Russia’s economic growth forecasts remain at 1.3% for 2026 and 1.5% for 2027.
- World Oil Demand
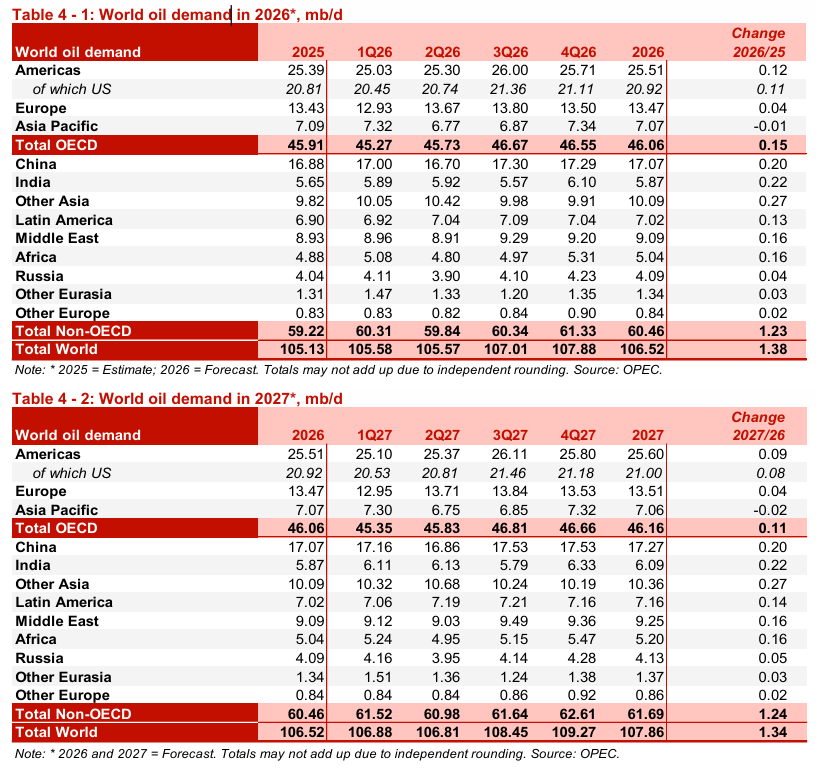
The global oil demand growth forecast for 2026 remains at 1.4 mb/d, y-o-y, unchanged from last month’s assessment. The OECD is forecast to increase by 0.15 mb/d, while the non-OECD is forecast to grow by about 1.2 mb/d. In 2027, global oil demand is forecast to grow by about 1.3 mb/d, y-o-y, unchanged from last month’s assessment. The OECD is forecast to grow by 0.1 mb/d next year, while the non-OECD is forecast to increase by about 1.2 mb/d, y-o-y.
- World Oil Supply
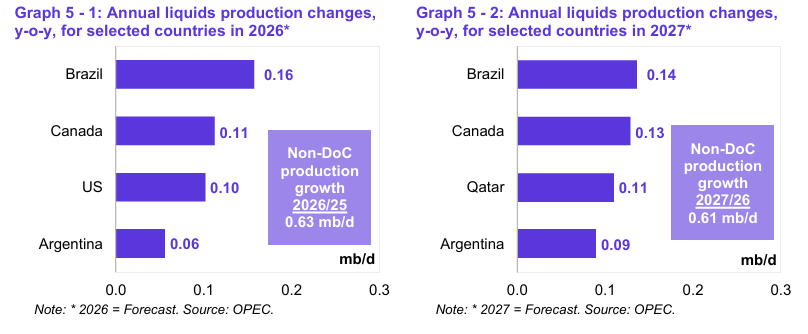
Non-DoC liquids production (i.e., liquids production from countries not participating in the Declaration of Cooperation) is forecast to grow by about 0.6 mb/d, y-o-y, in 2026, unchanged from last month’s assessment, mainly driven by Brazil, Canada, the US, and Argentina. In 2027, non-DoC liquids production is forecast to grow by about 0.6 mb/d, unchanged from last month’s assessment, mainly driven by Brazil, Canada, Qatar, and Argentina. Natural gas liquids (NGLs) and non-conventional liquids from countries participating in the DoC are forecast to grow by 0.1 mb/d, y-o-y, in 2026, to average about 8.8 mb/d, followed by similar growth in 2027 of about 0.1 mb/d, y-o-y, to average about 8.9 mb/d. In January, crude oil production by countries participating in the DoC decreased by 439 tb/d, m-o-m, to average about 42.45 mb/d, according to available secondary sources.
- Product Markets and Refining Operations
In January, refining margins declined in all reported trading hubs. Stronger feedstock prices and seasonal demand-side pressures weighed on refining margins, despite a significant rise in offline capacity due to the severe winter in the Atlantic basin and extended maintenance in Asia. In the US Gulf Coast (USGC), losses stemmed from the bottom section of the barrel as increased availability of heavy crude supplies weighed on fuel oil and, to a more limited extent, on gasoil crack spreads. In Rotterdam, all key product margins declined, with gasoline leading the decline, followed by fuel oil. In Singapore, the decline was driven by elevated gasoline and jet/kerosene supplies in the region.
- Tanker Market
Dirty tanker spot freight rates had a strong start to the year in January, supported by weather disruptions, geopolitical uncertainties, unplanned outages, and steady loading activity. VLCC spot freight rates began in 2026 with an exceptionally strong performance, which spilled over into the smaller vessel classes. Spot freight rates on the Middle East-to-East route reached the highest level for the month in at least a decade, up by 64%, y-o-y. Suezmax rates rose amid weather disruptions in the Atlantic basin and spillover support from the VLCC market. Suezmax rates on the USGC-to-Europe route were up by 12%, m-o-m, more than double year-ago levels, as European refiners sought replacements for disrupted CPC flows. Aframax spot freight rates also experienced a strong performance in January, as a cold blast tied up tonnage in the Atlantic basin. Cross-Med Aframax spot freight rates rose by 10%, m-o-m, to reach a 10-year high for the month. In the clean tanker market, spot freight rates showed a strong performance, led by East of Suez. Rates on the Middle East-to East route were up by 17%, m-o-m, while rates around the Mediterranean gained 5%, m-o-m.
- Crude and Refined Product
Trade US crude imports averaged 6.3 mb/d in January, remaining in line with the latest five-year average. US crude exports rose by almost 0.2 mb/d, m-o-m, to average 4.2 mb/d, amid higher flows to Europe and Africa. Product exports from the US averaged 7.0 mb/d, down from the elevated levels seen over the previous two months. In December, crude imports into OECD Europe declined, m-o-m, driven by lower flows from Kazakhstan. Product exports picked up from the previous month on higher inflows of fuel oil and diesel. In Japan, crude imports surged, averaging just under 3 mb/d in December, the highest since March 2020. Product imports, including LPG, reached a four-month high, led by kerosene and LPG, supported by winter fuel demand. China’s crude imports surged to a record high in December, averaging 13.2 mb/d. China’s product imports declined by 3%, as naphtha inflows fell from record levels seen in the previous month. Product exports from China rose marginally, as a jump in fuel oil exports was partly offset by a drop in gasoline flows. India’s crude imports remained at elevated levels in December, averaging 5.1 mb/d, despite a slight decline, m-o-m. Product imports declined by 5%, m-o-m, to average 1.2 mb/d, as a drop in fuel oil and naphtha inflows was offset by higher LPG imports. India’s product exports were broadly unchanged at 1.4 mb/d.
- Commercial Stock Movements
Preliminary December 2025 data show that OECD commercial oil inventories rose by 6.5 mb, m-o-m, to stand at 2,845 mb. At this level, OECD commercial stocks were 89.9 mb higher, y-o-y, and 44.1 mb above the latest five-year average, but 81.0 mb below the 2015–2019 average. Within the components, crude stocks fell by 2.1 mb, while product stocks increased by 8.6 mb, m-o-m. OECD crude oil commercial stocks stood at 1,363 mb. This was 75.5 mb higher, y-o-y, and 17.5 mb above the latest five-year average, but 64.2 mb lower than the 2015–2019 average. OECD total product stocks stood at 1,481 mb. This was 14.4 mb higher, y-o-y, and 26.7 mb above the latest five-year average, but 16.9 mb lower than the 2015–2019 average. In terms of days of forward cover, OECD commercial stocks rose by 0.7 days, m-o-m, in December, to stand at 62.8 days. This was 1.8 days higher than in December 2024, unchanged relative to the latest five-year average, and 0.5 days higher than the 2015–2019 average.
- Balance of Supply and Demand
The demand for DoC crude (i.e., crude from countries participating in the DoC) in 2026 remains unchanged from the previous month’s assessment of 43.0 mb/d, which is about 0.6 mb/d higher than that of 2025. The demand for DoC crude in 2027 also remains unchanged from the previous month’s assessment of 43.6 mb/d, which is about 0.6 mb/d higher than the 2026 forecast.
Crude Oil Price Movements
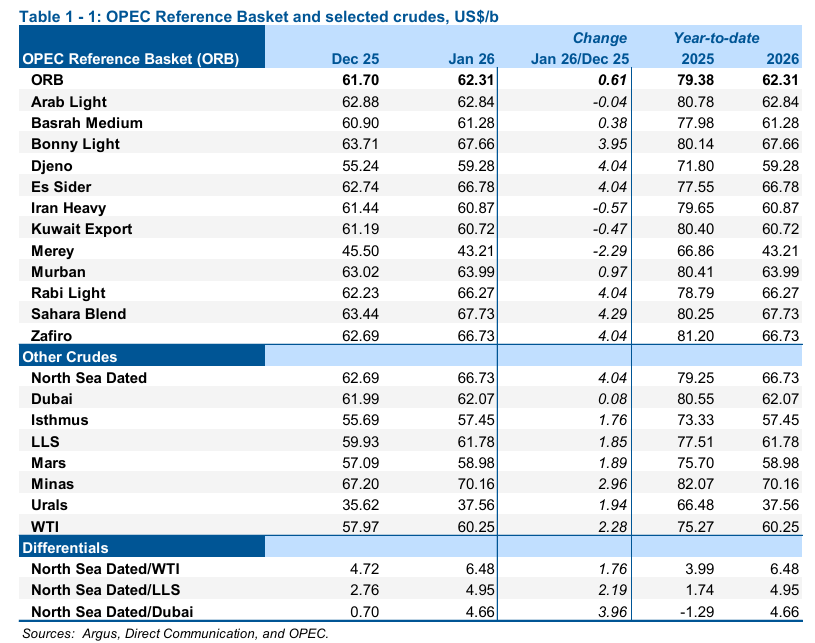
In January, the OPEC Reference Basket (ORB) value rose by $0.61/b, month-on-month (m-o-m), to average $62.31/b. The ICE Brent front-month contract rose by $3.10/b, m-o-m, to average $64.73/b, and the NYMEX WTI front-month contract increased by $2.39/b, m-o-m, to average $60.26/b. The GME Oman front-month contract rose by $0.83/b, m-o-m, to average $62.79/b.
The forward curves of oil futures prices strengthened, with the front end of the curves for both ICE Brent and NYMEX WTI moving into stronger backwardation, reflecting a shift in traders’ perception of the short-term fundamentals. Oil supply outages, the risk of supply disruptions, easing selling pressure from speculators, and robust physical market fundamentals supported front-month contracts. The market structure of GME Oman was little changed, m-o-m.
Speculative sentiment turned bullish, with hedge funds and other money managers sharply increasing their net long positions. Combined net long positions across the main crude benchmarks rose 144%, supported by strong financial inflows and net buying equivalent to 163 mb. This repositioning was driven by supply disruptions, heightened geopolitical developments, and stronger physical market fundamentals, which were further amplified by accelerated short covering in both ICE Brent and NYMEX WTI.
Crude spot prices
Crude spot markets rebounded firmly in January, as prices recovered following several consecutive months of declines. The rebound was primarily driven by easing selling pressure in futures markets.
In addition, heightened geopolitical developments in several key producing regions added a risk premium to the market. Supply disruptions in some regions further tightened spot market conditions, particularly in the Atlantic Basin. Unplanned oil supply outages in the Caspian region, together with adverse weather conditions in the US, raised concerns over near-term oil supply availability.
Strong crude demand for February-loading programmes, including from European buyers, supported spot prices in the Atlantic Basin. Global refinery throughput remained relatively strong in January at around 83.4 mb/d, although it edged slightly lower, m-o-m, which nonetheless helped sustain buying interest in the spot market. Price gains were partially capped by weaker refining margins across major refining hubs, particularly in Europe, as well as large builds in US petroleum product stocks.
Spot crude prices strengthened relative to futures, widening their premium as the market priced in potential supply disruptions. North Sea Dated remained at a premium to ICE Brent’s front-month contract monthly in January, with the spread widening by $0.95/b, m-o-m, to a premium of $2.00/b.
In January, North Sea Dated and WTI first-month prices rose by $4.04/b and $2.28/b, m-o-m, respectively, averaging $66.73/b and $60.25/b. Dubai's first-month price increased by $0.08/b, m-o-m, averaging $62.07/b.
In the Atlantic Basin, most crude differentials strengthened in January, buoyed by buying interest from European and Asian refiners, although lower refining margins and less favourable west-to-east arbitrage economics limited gains. In the North Sea, crude differentials of light sweet grades rose, m-o-m, on firm demand from European refiners, as high freight rates made supply in other regions less attractive in Northwest Europe. On a monthly basis, the Forties and Ekofisk crude differentials in January increased by $1.09/b and $0.61/b, respectively, to premiums of $1.70/b and $2.24/b, respectively, against North Sea Dated. Johan Sverdrup also rose against North Sea Dated, increasing by $0.37/b to a discount of $0.79/b.
Crude Oil Price Movements
The value of West African crude differentials showed mixed movements. Bonny Light and Cabinda crude differentials to North Sea Dated increased by 23¢/b and 31¢/b to stand at a premium of $1.48/b and a discount of $1.18/b. However, Forcados and Qua Iboe dropped by 5¢/b and 21¢/b, to premiums of $2.47/b and $1.09/b. In the Mediterranean, crude differentials were supported by persistent supply outages in the Caspian and robust demand for February-loading cargoes. Saharan Blend and Azeri BTC differentials increased by 59¢/b and 40¢/b, m-o-m, to premiums of $1.53/b and $3.42/b to North Sea Dated, while CPC Blend crude differentials dropped by $1.00/b, m-o-m, to a discount of $1.13/b, also relative to North Sea Dated.
In the USGC, crude differentials weakened. Light Louisiana Sweet (LLS) dropped by 45¢/b last month monthly to stand at a premium of $1.49/b to the WTI benchmark, and Mars sour fell by 36¢/b to a discount of $1.28/b to WTI. In the Middle East, the value of Oman crude differentials to Dubai fell by 72¢/b, m-o-m, to a discount of 7¢/b, compared to a premium of 65¢/b.
OPEC Reference Basket (ORB) value
In January, the ORB value rose by 61¢/b, m-o-m, to average $62.31/b. West and North African Basket components Bonny Light, Djeno, Es Sider, Rabi Light, Sahara Blend, and Zafiro increased by an average of $4.07/b, m-o-m, to $65.74/b. Multiple-region destination grades, including Arab Light, Basrah Medium, Iran Heavy, and Kuwait Export,t dropped on average by 17¢/b, m-o-m, to $61.43/b. Murban crude rose on average by 97¢/b, m-o-m, to $63.99/b, while the Merey component fell by $2.29/b, m-o-m, to settle at $43.21/b.
The oil futures market
Crude oil futures prices rallied in January, amid perceived heightened geopolitical risks and supply-side disruptions in some producing regions. Market attention shifted toward geopolitical developments, while unplanned outages constrained supply. The price rally was further fuelled by speculative activity, as selling pressures observed in previous months eased, which was followed by a wave of short covering as prices moved higher.
During the first week of the month, crude oil futures came under pressure amid continued speculative selling and subdued market sentiment. Uncertainty surrounding geopolitical developments in key producing regions weighed on prices. At the same time, data indicating large builds in US gasoline and middle distillate stocks added downward pressure on prices.
Prices rebounded sharply in the second week of January, driven by a renewed rise in geopolitical risk premiums. Escalating tensions in major oil-producing regions, including Eastern Europe and the Middle East, combined with continued uncertainty in Latin America, supported the recovery. Additional upside momentum stemmed from resilient physical market fundamentals, a weaker US dollar, and gains in major US equity markets, which contributed to a broader risk-on sentiment. Short covering across key futures markets amplified the price rebound.
Further support emerged from persistent supply outages in the Caspian region, alongside reports of strong demand for alternative crude grades in the Atlantic Basin. These developments reinforced concerns about near-term supply availability and further supported prices.
Despite the overall upward trend, oil futures experienced periods of heightened volatility throughout the month, reflecting ongoing uncertainty surrounding geopolitical developments and the market’s sensitivity to the latest news. Sentiment was intermittently weighed down by concerns about a potential escalation of trade tensions following announcements of possible additional US tariffs on goods from several European countries. At the same time, renewed uncertainty regarding US–EU relations sustained geopolitical risk premium in oil markets.
By the end of January, crude oil futures prices strengthened further, supported by elevated geopolitical risk premiums and adverse winter weather conditions in the US, which disrupted oil production and refinery operations.
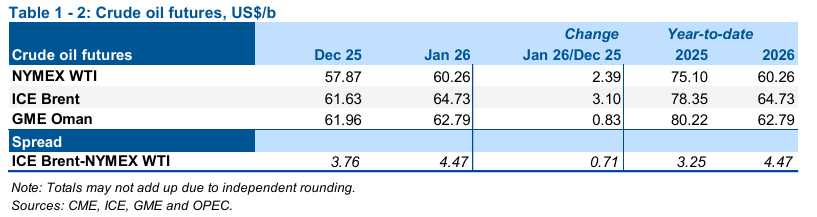
The ICE Brent front-month contract rose in January by $3.10/b, m-o-m, to average $64.73/b, and the NYMEX WTI front-month contract increased by $2.39/b, m-o-m, to average $60.26/b. The GME Oman front-month contract rose by 83¢/b, m-o-m, in January to average $62.79/b.
The ICE Brent-NYMEX WTI front-month spread widened in January, reaching more than a $5/b. The ICE Brent contract rose more than WTI futures, buoyed by rising demand for prompt loading cargoes in the Atlantic Basin amid supply disruptions and geopolitical risks. Higher risk premiums gave more support to the international benchmark, ICE Brent. At the same time, a large build in US petroleum products, specifically gasoline and diesel, weighed on the NYMEX WTI price. The ICE Brent/NYMEX WTI spread widened in January on a monthly average of 71¢/b to settle at $4.47/b, keeping US crude more competitive for international buyers. The spread between North Sea Dated and WTI Houston also widened last month to nearly $7/b daily, reflecting strong buying in the Atlantic Basin. Monthly, the North Sea Dated-WTI Houston spread rose by $1.49/b to a premium of $5.46/b.
Hedge funds and other money managers turned bullish in January, raising their net long positions sharply, particularly in ICE Brent, where positions reached a four-month high. The 144% increase in net long across ICE Brent, NYMEX WTI, and ICE WTI reflects a rapid shift in risk appetite by speculators, underpinned by sizeable financial inflows and net buying equivalent to 163 mb over the month. This repositioning was driven by a combination of market-driving factors. Supply disruptions and heightened geopolitical risks boosted price expectations, while stronger physical market signals reinforced confidence in underlying fundamentals. The rally in net long positions was amplified by accelerated short covering in both ICE Brent and NYMEX WTI, as speculators rushed to close previously accumulated bearish positions.
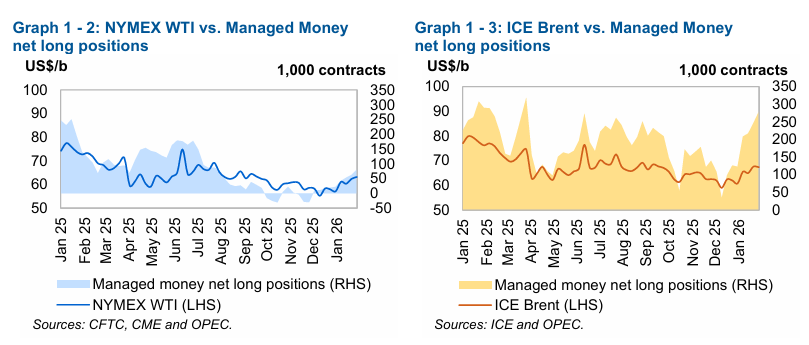
Money managers turned more optimistic about ICE Brent futures prices in January, buying an equivalent of about 121 mb in ICE Brent contracts. The combined futures and options net long positions related to Brent increased by 120,733 lots, or 95.7%, over the month, to stand at 246,917 contracts during the week of 27 January. This is due to long positions increasing by 67,792 lots, or 21.9%, to stand at 377,371 contracts and short positions falling by 52,941 lots, or 28.9%, to stand at 130,454 contracts over the same period.
WTI-related net long positions also rose over January, with net long positions in the week of 27 January rising to their highest point since July 2025. Between the weeks of 30 December and 27 January, NYMEX WTI futures and options net long positions increased by 41,964 lots, to stand at 28,937 contracts. During the same period, short positions dropped by 16,558 lots, or 10.0%, to 149,663 contracts, and long positions rose by 25,406 lots, or 16.6%, to 178,600 contracts.
The ICE Brent long-to-short ratio of speculative positions rose slightly to about 3:1 in January, compared to about 2:1 in December. However, the NYMEX WTI long-to-short ratio remained almost unchanged at 1:1 in January, unchanged compared to December.
Total open interest volumes related to ICE Brent, NYMEX, and ICE WTI futures and options increased in January by 725,343 lots, or 10.3%, to stand at 7.8 million contracts in the week ending 27 January. Open interest volumes related to ICE Brent futures and options rose by 370,088 contracts, or 9.6%, m-o-m, to stand at 4.2 million contracts in the week ending 27 January. Open interest volumes related to NYMEX and ICE WTI futures and options increased by 355,255 lots, or 11.1%, to stand at 3.6 million contracts in the last week of January.
The futures market structure
The market structure of oil futures prices strengthened, with the front of the forward curves for both ICE Brent and NYMEX WTI steepening, indicating stronger backwardation in January, affecting a shift in traders’ perceptions of the short-term fundamentals. Oil supply outages, the risk of supply disruptions, easing selling pressure from speculators, and robust physical market fundamentals buoyed front-month contracts. Meanwhile, the market structure of GME Oman was little changed, m-o-m.
The front end of the Brent futures forward curve steepened in January, m-o-m. As an international benchmark, ICE Brent was influenced by heightened uncertainty surrounding recent geopolitical developments and their potential implications for oil supply. Prompt prices were further buoyed by firm demand in the physical market and lower availability of prompt loading volumes for February, specifically in the Atlantic Basin. On a monthly average, the ICE Brent M1/M3 spread rose by 53¢ to a backwardation of $1.13/b in January, the highest since last July. The ICE Brent M1/M6 spread also widened last month by $1.05, with backwardation standing at $1.75/b on average, compared with a backwardation of 70¢/b in December.
In the US, the structure of NYMEX WTI also strengthened last month, with the front of the forward curve moving into stronger backwardation, although rising middle distillates and gasoline stocks weighed on prompt prices. The NYMEX WTI M1/M3 spread widened by 6¢ to an average backwardation of 42¢/b in January.
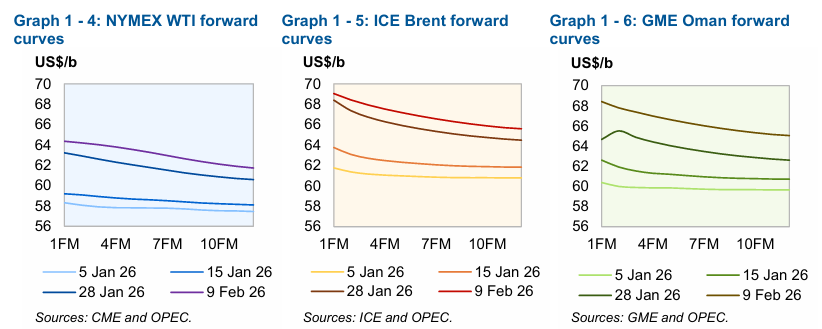
The market structure of GME Oman was little changed in January. On a monthly average, the GME Oman M1/M3 spread eased 2¢ to a backwardation of 58¢/b in January.
In terms of M1/M3 structure, the North Sea Brent spread widened on a monthly average by $0.75/b to a backwardation of $1.73/b, compared to $0.99/b in the month before. In the US, the WTI backwardation also widened by $0.04/b to $0.41/b, compared to a backwardation of $0.37/b in December. The Dubai backwardation narrowed on average by $0.72/b, m-o-m, flipping to a contango of $0.17/b in January.
Crude spreads
The premiums of light sweet crude over medium sour crude widened further in Asia and Europe, where light sweet crudes continued to outperform medium and heavy sour grades for a second consecutive month, although the spread remained little changed in the USGC. Strong demand for light sweet crude, particularly in the Atlantic Basin – following supply outages in the Caspian region – boosted the value of sweet grades. In addition, the stronger performance of light distillate margins, especially naphtha, relative to heavier products contributed to the widening spread between sweet and sour crude. Meanwhile, buying interest from some Asian refiners for medium- and heavy-sour grades softened amid ample supply and a weak fuel oil market, thereby adding downward pressure on sour crude values.
In Europe, the value of light sweet grades was supported by robust buying interest, including from European refiners, as buyers rushed to secure volumes following reports of supply outages in the Caspian region. This increased demand for alternative prompt-loading cargoes in Northwest Europe. Meanwhile, gains in the sour crude market were capped by ample supply availability and competitive arbitrage pricing from other regions, including the Middle East. A wider spread between naphtha and high-sulphur fuel oil crack spreads, reaching nearly $5/b in Europe, further influenced sweet and sour crude values. The sweet–sour crude spread, represented by the Ekofisk–Johan Sverdrup differential, rose by 23¢,m-o-m, to a premium of $3.03/b. Urals crude differentials to North Sea Dated also fell last month, declining by $2.16/b in the Black Sea and $1.61/b in the Baltic Sea, to stand at discounts of $29.17/b and $26.67/b, respectively.
In Asia, the Tapis premium over Dubai crude widened the most, as sour crude values came under pressure while light sweet crude rallied. This was driven by soft demand from some refiners in the Asia-Pacific region, although a rebound in high-sulphur fuel oil margins in Singapore slightly limited the downward pressure on sour crude prices. Meanwhile, strong demand for light sweet crude in other regions, including the Atlantic Basin, supported similar grades in the East of Suez market. This occurred against a backdrop of limited west-to-east arbitrage opportunities, as the Brent Dubai spread widened. The Brent–Dubai differential rose by $3.96/b on a monthly average to a premium of $4.66/b, the highest since November 2022, compared with a premium of $0.70/b in December.
The Brent-Dubai exchange of futures for swaps (EFS) also widened by $1.35/b m-o-m to stand at a premium of $1.73/b. The Tapis-Dubai spread widened by $3.14/b m-o-m in January to average $6.62/b. In the USGC, the LLS premium over medium sour Mars crude edged lower by 4¢ m-o-m in January, settling at $2.80/b. This followed an increase in the previous month, when the spread reached its highest monthly average since October 2024. Light sweet crude continued to outperform sour grades, supported by stronger light distillate margins, particularly naphtha, while weaker high sulphur fuel oil margins further weighed on the sour crude market.
Commodity Markets
All select commodity price indices advanced in January. The energy price index rebounded from the previous month’s decline, and all non-energy price indices continued to advance in the period. In the futures market, sentiment turned bullish, though cautious optimism remained. Both combined open interest (OI) and money managers’ net length increased in January. Commodity prices found support from a weaker US dollar in January, with precious metals being the most direct beneficiaries amid expectations of US interest rate cuts. Winter weather conditions remained supportive of energy prices while improvements in global industrial activity supported metal prices.
Trends in select energy commodity markets
The energy price index increased by 12%, m-o-m, in January, supported by gains across all selected energy prices, with US natural gas prices experiencing the largest gains. However, the index was down by 10.3%, y-o-y, dragged lower by a decline in most select prices, except US natural gas.
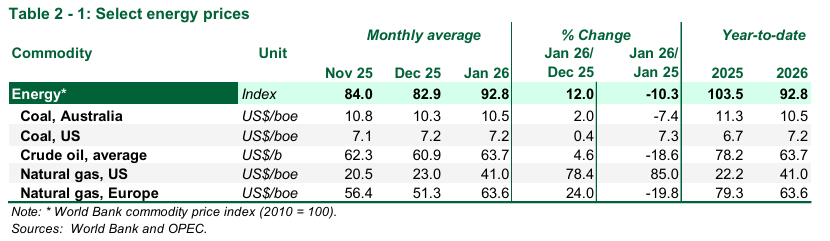
Australian thermal coal prices rose in January, increasing by 2%, m-o-m. Prices benefited from Indonesian export controls, weather-related disruptions, and industrial activity holding firm in some regions. However, destocking activities in key Asian consumer markets partially offset gains. Prices were down by 7.4%, y-o-y.
In the US, coal prices advanced for a fourth consecutive month, rising by 0.4%, m-o-m. Prices saw some support from cold snaps, which increased marginal coal burn in some regions. However, upside support was limited by restricted gas-to-coal fuel switching amid policy-driven mandates. Prices were 7.3% higher, y-o-y.
Average crude oil prices rebounded in January after six consecutive months of declines, increasing by 4.6%, m-o-m. Improved sentiment in the futures markets remained supportive of prices in the month, though they are down by 18.6%, y-o-y.
Henry Hub's natural gas prices continued their upward momentum for a fifth consecutive month in January, rising by 78.4%, m-o-m. Prices rallied on the back of colder weather, which lifted demand for residential heating in the month. At the same time, supply was limited amid production outages in key regions. According to data from the US Energy Information Administration (EIA), average weekly natural gas storage decreased by 12.6%, m-o-m, in January. Prices also benefited from higher LNG demand, though export capacity was limited due to some outages. Prices were up by 85%, y-o-y.
The average Title Transfer Facility (TTF) gas price ended its sixth consecutive monthly decline in January, rising by 24%, m-o-m. Prices rose as colder weather across the region increased heating demand, promoting a sharp decline in storage levels. According to data from Gas Infrastructure Europe, EU storage levels fell to 41% as of the end of January, down from 62% the previous month, representing a 21% drop, m-o-m. Prices also benefited in the month from US LNG export constraints, which limited supply availability to Europe. Prices were down by 19.8%, y-o-y.
Trends in select non-energy commodity markets
The non-energy price index rose for a sixth consecutive month in January, increasing by 2.9%, m-o-m. Gains in the base and precious metals indices supported the overall index, although these were partly offset by a decline in the agriculture index, which fell by 0.5%, m-o-m, during the same period. The non-energy index was up by 3%, y-o-y, while the agriculture index decreased by 8.9%, y-o-y.
Base metals
The base metal index advanced for the fifth consecutive month in January, increasing by 10.3%, m-o-m. Metal prices were supported by a combination of a lower US dollar and improvements in global industrial activity. The global manufacturing PMI rose to 50.9 in January, up from 50.4 the previous month, a 1.0% m-o-m increase. However, inventory builds in some metals limited the upside. The base metal index was up by 33.5%, y-o-y. At the London Metal Exchange (LME) warehouses, combined stocks of base metals declined by 0.5%, m-o-m. Stocks were down by 14.4%, y-o-y.
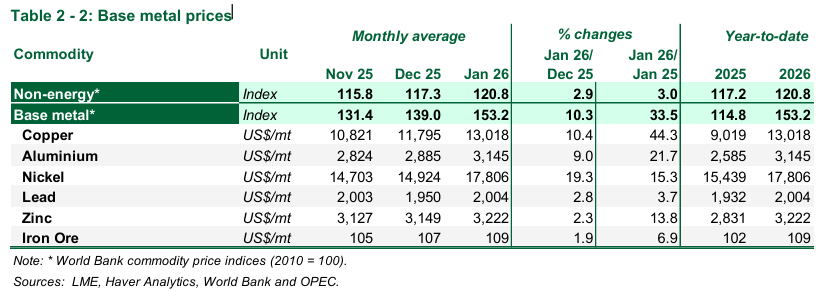
- Copper prices rose in January by 10.4%, m-o-m, and were up by 44.3%, y-o-y. At LME warehouses, stocks fell by 4.5%, m-o-m, in January, and they were down 41.2%, y-o-y.
- Aluminum prices advanced in January by 9.0%, m-o-m, and were up by 21.7%, y-o-y. LME warehouse stocks decreased over the month by 4.6%, m-o-m, and were down by 18.2%, y-o-y.
- Nickel prices increased by 19.3%, m-o-m, in January, and were higher by 15.3%, y-o-y. At LME warehouses, stocks rose by 10.3%, m-o-m, and were higher by 66.1%, y-o-y.
- Lead prices rose by 2.8%, m-o-m, in January, and were up by 3.7%, y-o-y. At LME warehouses, stocks dropped by 12.3%, m-o-m, and were down by 4.6%, y-o-y.
- Zinc prices increased in January by 2.3%, m-o-m, and were up by 13.8%, y-o-y. Stocks increased by 38.2%, m-o-m, at LME warehouses, but were down by 46.8%, y-o-y.
- Iron ore prices advanced in January, increasing by 1.9%, m-o-m, and were higher by 6.9%, y-o-y. China’s steel industry PMI improved in January but remained below expansionary territory. The benchmark rose to 49.3 in the month, up from 46.3 the previous month, representing a 6.5%, m-o-m, increase.
Precious metals
The precious metals index trended upward for a seventh consecutive month in January. The index rose by 17%, m-o-m, as strong momentum across all select precious metals prices remained, led by silver. The index was up 94.1%, y-o-y.
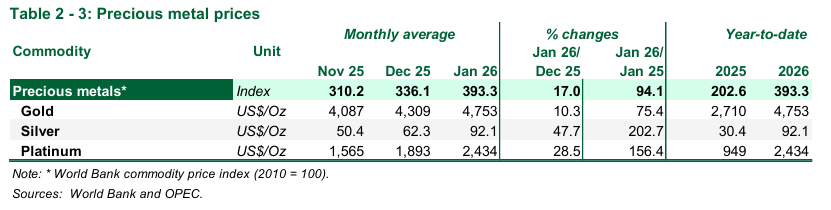
Gold prices rose for a sixth consecutive month, increasing by 10.3%, m-o-m, in January. Higher expectations of potential future US Fed rate cuts – coupled with heightened geopolitical uncertainty – boosted gold’s safe haven status. Speculative activity also contributed to the rally, although a slight late-month improvement in the US dollar partially offset bullish sentiment. Prices were up by 75.4%, y-o-y.
Silver and platinum prices rose by 47.7% and 28.5%, m-o-m, respectively, in January. Both metals rallied on the back of positive momentum in precious metals. Higher industrial demand linked to China’s tech and energy sectors, which are major consumers of both metals, also contributed to the price rallies. Silver and platinum prices were up by more than 100%, y-o-y, respectively.
World Economy
The continued steady growth momentum seen at the end of last year, and the carry-over of its dynamic into 2026, set the global economic growth forecast for a robust 3.1% for 2026 and at 3.2% for 2027. Sound growth in the United States, India, and China is projected to remain a key driver of the global economic expansion in 2026. Combined with steady growth in the Eurozone and Japan, this is expected to provide additional upside to the global outlook. At the same time, Brazil and Russia are also expected to sustain steady growth trends into 2026.
In 1H26, an early-year fiscal boost effect is expected, as the US tax cuts and the reversal of the 4Q25 shutdown-related drag lift growth. Also, stimulus measures are set to gather pace in China, Japan, and Germany, while India is projected to sustain strong growth as fiscal support continues, following the recent announcement of a US–India trade deal. This sound global economic growth dynamic is forecast to accelerate slightly in 2027, supported by normalizing inflation, supportive financial conditions, and improvements in global trade. A potential de-escalation of geopolitical challenges could provide further upside.
Despite persistent volatility in global trade conditions, several recently concluded trade agreements are expected to provide support to global trade. In particular, the newly announced trade agreement between the United States and India, together with agreements concluded by the EU with the Mercosur economies and India, should underpin a renewed acceleration of global trade growth in 2026 and 2027. Nevertheless, close monitoring is warranted, particularly with respect to the US–Mexico–Canada Agreement, which is scheduled for extension mid-year, and the US–China trade agreement, which is set to expire later this year.
Update on the latest global developments
Despite elevated uncertainty in the first half of the year, the global economy ended 2025 on a relatively sound footing. Growth was supported by resilient consumer demand, easing monetary conditions, and supportive fiscal measures in key economies. Trade disruptions were mitigated through trade re-routing and a gradual de-escalation of trade tensions. Global trade largely stabilized and expanded as the US reached agreements with most major trading partners, including most recently India, Taiwan, and Argentina. Beyond the US, trade integration also advanced, with agreements reached between the EU and India and between the EU and Mercosur. Fiscal policy remained supportive, notably in the US, Japan, and Germany, while India continued robust infrastructure spending.
In OECD economies, the US economy expanded by 4.4%, q-o-q, SAAR, in 3Q25, following an upward revision in the Bureau of Economic Analysis’ (BEA) final estimate, accelerating from growth of 3.8% in 2Q25, supported by consumer spending and stronger exports. Eurozone economic growth stood at 1.3%, q-o-q, SAAR, in 4Q25 in Eurostat’s initial estimate, up from 1.1% in 3Q25, supported by a return to growth in Germany in 4Q. Japan’s economy contracted by 2.3%, q-o-q, SAAR, in 3Q25, down from growth of 2.1% in 2Q25, although growth remained positive on an annual basis.
In non-OECD economies, China achieved its annual growth target of 5%, with growth of 4.5%, y-o-y, in 4Q25, decelerating through the year and down from 4.8%, y-o-y, in 3Q25, while exports remained strong despite trade uncertainty with the US. India’s economic growth came in at a robust 8.2%, y-o-y, in 3Q25, up from 7.8%, y-o-y, in 2Q25, supported by strong private consumption and a robust manufacturing sector. Brazil’s growth slowed to 1.8%, y-o-y, in 3Q25 from 2.4%, y-o-y, in 2Q25, as private consumption softened amid tight monetary conditions, although agriculture and mining continued to post strong growth. Russia’s growth decelerated to 0.6%, y-o-y, in 3Q25, down from 1.1%, y-o-y, in 2Q25, as gross fixed capital formation contracted.
Inflation across major OECD economies continued to ease. In the US, headline inflation stood at 2.7%, y-o-y, in December, unchanged from November and down from 3.0% in September, with no October reading released due to the government shutdown. In the Eurozone, inflation slowed to 1.7%, y-o-y, in January, falling below the ECB’s 2% target, and down from 2.0% in December and 2.2% in November, although services inflation remained elevated. In Japan, inflation declined sharply to 2.1%, y-o-y, in December from 2.9% in November and 3.0% in October.
On monetary policy, the US Federal Reserve (Fed) held interest rates unchanged at its January meeting following three consecutive cuts at the end of 2025. The European Central Bank (ECB) kept rates unchanged at its February meeting, citing continued economic resilience and supportive public spending. The Bank of Japan (BoJ) also held rates unchanged at its January meeting while upgrading its economic outlook.
In non-OECD economies, inflation trends remained mixed. In China, CPI rose to 0.8%, y-o-y, in December from 0.7% in November and 0.2% in October, remaining in positive territory following a prolonged period of deflation earlier in the year. In India, inflation edged up to 1.3%, y-o-y, in January from 0.7% in December and 0.3% in October, as food deflation softened following earlier declines driven by lower food prices and the reduction in the Goods and Services Tax (GST). In Brazil, inflation eased to 4.3%, y-o-y, in December from 4.5% in November and 4.7% in October, moving within the upper limit of the target range set by the Banco Central do Brasil (BCB). In Russia, inflation slowed to 5.6%, y-o-y, in December from 6.6% in November and 7.7% in October.
On monetary policy, the People’s Bank of China (PBoC) implemented a 25 bp rate cut across central bank facilities, continuing its easing stance. The Reserve Bank of India (RBI) held rates unchanged at its February meeting following a 25 bp cut in December. The BCB kept rates unchanged at its January meeting, while the Central Bank of Russia (CBR) cut interest rates by 50 bp in December, extending its easing cycle.
Global trade continued to expand in both volume and value terms, although momentum remained uneven across recent months. Trade volume growth rose to 5.3%, y-o-y, in November, up from 3.1% in October and 4.9% in September. In value terms, global trade increased by 2.7%, y-o-y, in November, unchanged from October and up from 2.1% in September. Trade volumes had risen earlier in the year ahead of US tariff implementation and have subsequently normalized.
Near-term global expectations
The global economy is expected to sustain growth after the distortions seen in 2025, having ended the year on solid ground. Major economies are positioned to maintain momentum, supported by resilient consumer spending as easing inflation lifts real wages and policy support for households increases. The services sector is expected to remain a key driver, supported by expanding trade in services, including under new agreements between the EU and India and the EU and Mercosur. Manufacturing activity is also showing signs of recovery and is expected to turn positive in 2026, supported by government measures and increased infrastructure and defence spending.
However, there are still key risks remaining in the global economy. Persistent services inflation in the Eurozone continues to pose a challenge, while the US labour market shows signs of softening, partly offset by strong investment in AI and other technology sectors. In China, deflationary pressures have eased, although the property sector remains fragile. While global trade tensions have largely de-escalated, risks of renewed frictions persist, notably around the renewal of the US–Mexico–Canada Agreement (USMCA) in July and the expiration of the US–China trade truce in October. The baseline assumption remains that negotiated outcomes will be reached in both cases.
Non-OECD economies are expected to remain the primary drivers of global growth, although the Eurozone is likely to outperform earlier expectations alongside continued strength in the US. There, the effects of the OBBBA fiscal package are expected to provide support to consumers and businesses in 2026, alongside sustained investment and more normalized trade patterns, with potential upside to exports. Recent PMI readings point to a possible return to expansion in the manufacturing sector. In the Eurozone, Germany, as the region’s largest economy, is showing signs of a return to growth in 2026, which is expected to generate positive spillovers across the region as fiscal spending increases.
Among non-OECD economies, India is expected to maintain solid growth momentum, supported by stronger private consumption following the reduction in the GST and continued government spending, although labour market pressures persist. China has not yet announced its 2026 growth target, but policy signals continue to point to support for consumption and exports, consistent with steady growth through 2027. Russia’s economy is expected to continue normalizing after several years of above-potential growth. In Brazil, easing inflation is expected to support activity, although growth is also moving towards more normalized levels.
Inflation is expected to continue converging towards target levels across most economies. In the US, inflation remains relatively elevated, although tariff pass-through effects are expected to be largely one-off, allowing inflation to trend lower. In Russia and Brazil, inflation has declined from the elevated levels seen in 2025 following sustained monetary tightening. In China, deflationary pressures are expected to have eased, although the risk of renewed deflation remains.
Global PMIs remained in expansionary territory across both manufacturing and services, with a modest improvement at the start of 2026. The global Manufacturing PMI rose to 50.9 in January, up from 50.4 in December and 50.5 in November. The global Services PMI increased to 52.7 in January from 52.4 in December, although remaining below the 53.2 reading recorded in November, continuing to signal expansion.
The continued momentum at the end of 2025, alongside further trade normalization and resilient consumer spending, is expected to sustain global economic growth at 3.1% in 2026, unchanged from the previous month’s assessment. In 2027, further expansion supported by new trade agreements and a recovery in manufacturing is expected to lift global growth to 3.2%, also unchanged from the previous month’s assessment.
The impact of the USD and inflation on oil prices
The US dollar (USD) index declined for a second consecutive month in January, falling by 0.3%, m-o-m. The currency saw some safe-haven support earlier in the month amid heightened geopolitical developments. However, the upward momentum faded under pressure from softer macroeconomic indicators. The currency was further pressured by elevated expectations that the US Federal Reserve will pivot toward monetary policy easing amid softer inflation data. Compared with the same period last year, the index was down by 9.5%, y-o-y.
In select developed-market currencies, the USD rose 0.5%, m-o-m, against the yen in January. However, it declined against the euro and the pound by 0.3% and 1.1%, m-o-m, respectively. Graph 3 - 20: The Modified Geneva I + US$ Basket (base June 2017 = 100) 200 220 240 260 280 300 320 Jan 24 Mar 24 May 24 Jul 24 Sep 24 Nov 24 Jan 25 Mar 25 May 25 Jul 25 Sep 25 Nov 25 Jan 26 Index Compared with the same period last year, the USD was higher against the yen by 0.2%, y-o-y, but lower against the euro and pound by 11.8% and 8.7%, y-o-y, respectively. In terms of select emerging markets’ currencies, in January, the USD rose against the rupee by 0.8%, m-o-m; however, it declined against the yuan and real by 1.1% and 2.0%, m-o-m, respectively. Compared with the same period last year, the USD was higher against the rupee by 5.3%, y-o-y. However, it was lower against the yuan and the real by 4.6% and 11.2%, y-o-y.
The differential between nominal and real ORB prices widened in January. Inflation (nominal price minus real price) was down by 24.4%, m-o-m. In nominal terms, accounting for inflation, the ORB price declined by 1.8%, m-o-m, in January and was down by 10.6%, y-o-y. In real terms (excluding inflation), the ORB declined by 0.5%, m-o-m, in January, and was down by 25.6%, y-o-y.
World Oil Demand
The global oil demand growth forecast for 2026 remains at a healthy 1.4 mb/d, y-o-y, unchanged from the previous month’s assessment. The OECD is expected to grow by about 0.15 mb/d, y-o-y, mostly driven by requirements from the Americas, supported by an uptick from OECD Europe. In the non-OECD, demand is forecast to expand by about 1.2 mb/d. Oil demand in the non-OECD is forecast to be mostly driven by requirements from Other Asia, supported by India and China. Oil demand growth is expected to be supported by strong air travel demand and healthy road mobility, including on-road diesel and trucking, as well as healthy industrial, construction, and agricultural activities in non-OECD countries. Similarly, capacity additions and petrochemical margins are expected to continue to contribute to growth.
In terms of products, gasoline and jet/kerosene are forecast to contribute significantly to world oil demand growth in 2026. Diesel demand is also forecast to demonstrate y-o-y growth. Regarding petrochemical feedstock, the demand for NGLs/LPG is anticipated to lead y-o-y growth, with naphtha projected to also increase, y-o-y. Demand for the ‘other products’ category is also projected to grow, y-o-y, while demand for residual fuels is expected to weaken slightly, y-o-y.
Global oil demand growth in 2027 is forecast to grow by a healthy 1.3 mb/d, y-o-y, unchanged from the previous month’s assessment. The OECD is expected to grow by 0.1 mb/d, y-o-y, with OECD Americas expected to drive oil demand growth in the region. In the non-OECD, oil demand is forecast to grow by about 1.2 mb/d, led by Other Asia, followed by India and China.
World Oil Supply
Non-DoC liquids production (i.e., liquids production from countries not participating in the DoC) is forecast to grow by about 0.6 mb/d to average 54.8 mb/d in 2026, unchanged from last month’s assessment. The main drivers of liquids production growth are expected to be Brazil, Canada, the US, and Argentina. In 2027, non-DoC liquids production is forecast to grow by about 0.6 mb/d to average 55.4 mb/d. The main drivers for liquids supply growth are expected to be Brazil, Canada, Qatar, and Argentina. DoC NGLs and non-conventional liquids are forecast to grow by about 0.1 mb/d in 2026 to average 8.8 mb/d. An additional growth of about 0.1 mb/d is expected in 2027, to average 8.9 mb/d. DoC crude oil production in January decreased by 439 tb/d, m-o-m, averaging 42.45 mb/d, as reported by available secondary sources.
Key drivers of growth and decline
Non-DoC liquids production in 2026 is forecast to grow by about 0.6 mb/d, unchanged from last month’s assessment. The main growth drivers are expected to be Brazil, Canada, the US, and Argentina. In 2027, non-DoC liquids supply is forecast to grow by about 0.6 mb/d, unchanged from the last month's assessment. The main growth drivers are set to be Brazil, Canada, Qatar, and Argentina.
Comments