 English
 پارسی


Highlights
- Oil demand
Oil demand is expected to contract by 80 kb/d this year, as the Iran war upends our global outlook. This is 730 kb/d less than in last month’s report, and a forecast 1.5 mb/d 2Q26 decline would be the sharpest since Covid-19 slashed fuel consumption. Initially, the deepest cuts in oil use have come in the Middle East and Asia Pacific, mainly for naphtha, LPG, and jet fuel. However, demand destruction will spread as scarcity and higher prices persist.
- Global oil supply
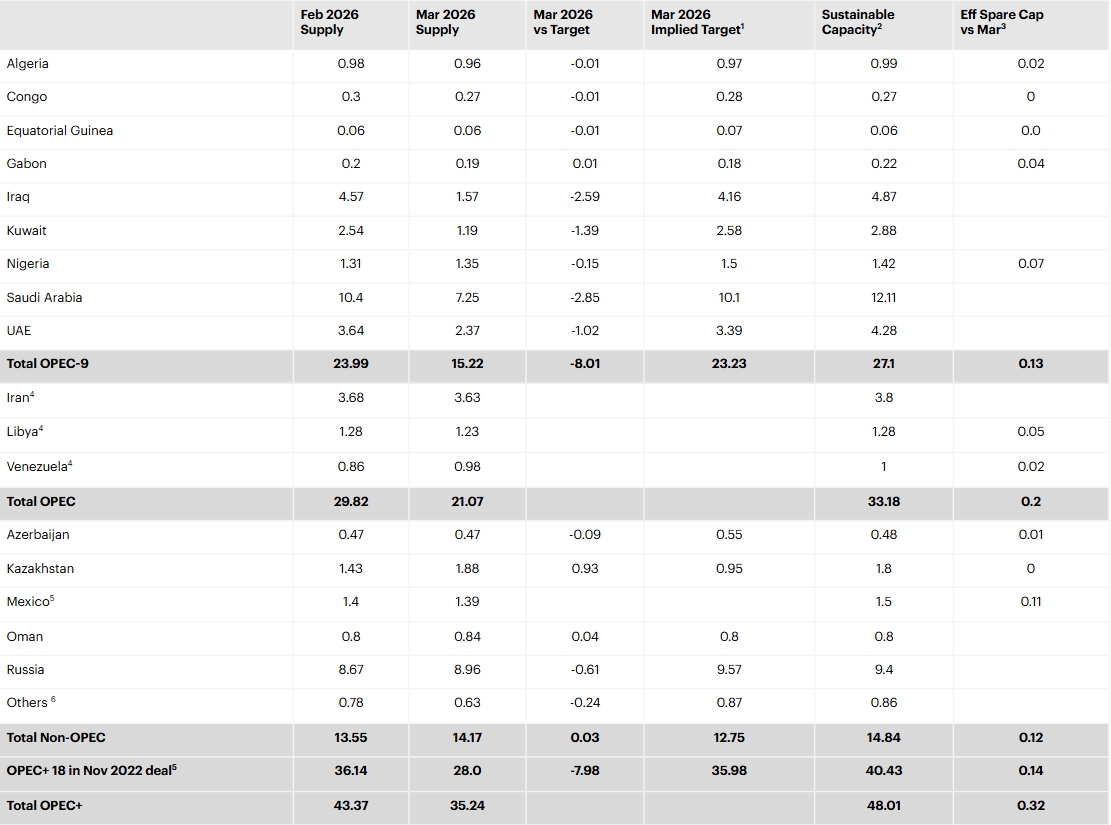
Global oil supply plummeted by 10.1 mb/d to 97 mb/d in March, with continued attacks on energy infrastructure in the Middle East and ongoing restrictions to tanker movements through the Strait of Hormuz leading to the largest disruption in history. OPEC+ production fell 9.4 mb/d m-o-m to 42.4 mb/d while non-OPEC+ supply declined 770 kb/d m-o-m to 54.7 mb/d, as lower Qatari output offset gains in Brazil and the United States.
Global crude
- Global crude throughputs
Global crude throughputs continue to struggle with disruptions to feedstock supplies and infrastructure damage that are tightening global product markets. In April, Middle East and feedstock-constrained refineries in Asia have cut runs by around 6 mb/d, to 77.2 mb/d. Global crude runs are now expected to decline by 1 mb/d on average in 2026, to 82.9 mb/d. Refining margins temporarily surged as middle distillate cracks reached all-time highs.
- Global oil inventories
Global observed oil inventories fell by 85 mb in March, with stocks outside of the Middle East Gulf drawn down by a significant 205 mb (-6.6 mb/d) as flows through the Strait of Hormuz were choked off. At the same time, with limited outlets after the effective closure of the Strait, floating storage of crude and oil products in the Middle East rose by 100 mb, and onshore crude stocks in the region were up by 20 mb. China added 40 mb of crude to tanks.
- Oil prices
Oil prices posted their largest-ever monthly gain in March in the wake of the most severe oil supply shock in history. Spot crude benchmarks and differentials soared, outpacing futures markets, as refiners anxiously scrambled to replace locked-in Middle Eastern cargoes. At the time of writing, North Sea dated crude was trading around $130/bbl – $60/bbl above pre-conflict levels.
Disruptions mount
The announcement last week of a two-week ceasefire in the conflict in the Middle East provided some welcome respite to global oil markets just as the impact of disruptions to supply and trade was spreading globally. However, at the time of writing, it remains unclear whether the ceasefire will turn into a lasting peace and a return to regular shipping flows through the Strait of Hormuz. With oil-importing nations scrambling to source replacement barrels from an increasingly shrinking pool of supply, physical crude oil prices surged to record levels near $150/bbl, far above the prices in futures markets, with the physical-futures disconnect becoming increasingly acute. Even steeper gains have been seen for refined products, with middle distillate prices in Singapore reaching all-time highs above $290/bbl.
Resuming flows through the Strait of Hormuz remains the single most important variable in easing the pressure on energy supplies, prices, and the global economy. The latest development in the fast-evolving situation is the announced US blockade on vessels entering or departing Iranian ports and coastal areas, which was due to go into effect soon after the time of writing. In early April, shipments through the Strait remained severely restricted, with loadings of crude, natural gas liquids, and refined products averaging around 3.8 mb/d, compared with more than 20 mb/d in February ahead of the crisis. Exports through alternative routes – most notably from the west coast of Saudi Arabia and Fujairah on the east coast of the UAE, as well as the ITP pipeline that runs from Iraq to Ceyhan in Türkiye – had increased to 7.2 mb/d from less than 4 mb/d before the war. The overall loss in oil exports exceeds 13 mb/d, with associated production curtailment and damage to energy infrastructure in the region resulting in cumulative supply losses of more than 360 mb in March and 440 mb projected for April.
Consumers and refiners alike are tapping into oil inventories to mitigate the immediate impact of supply disruptions. In March, global observed oil stocks fell by 85 mb despite an accumulation of both on-land and offshore inventories in the Middle East and further builds in China. The largest decline came from oil on water following the near halt to sailings from Gulf producers dependent on the Strait. Crude oil stocks in importing countries in Asia dropped by 31 mb, with further declines expected in April.
Where oil inventories could not bridge the gap, demand has taken a hit. Most notably, Asian petrochemical producers have curtailed operating rates as feedstock supply dried up. Households and businesses using LPG have also been impacted, while flight cancellations across the Middle East, parts of Asia, and Europe have led to a sharp drop in jet fuel consumption. A growing number of countries have implemented policies to reduce demand, while others have put in place measures to shield consumers from the full impact of rising fuel prices. Overall, global oil demand is estimated to contract by 800 kb/d year-on-year in March and by 2.3 mb/d in April. Global oil demand is now projected to decline by 80 kb/d on average in 2026, compared to growth of 730 kb/d expected in last month’s Report.
The prospects for a lasting negotiated settlement to the conflict remain unclear at this stage. In this Report, we present a forecast that assumes a resumption of regular deliveries of oil and gas from the Middle East to international markets by mid-year, although not back to pre-conflict levels. We recognise that this scenario could prove too optimistic, considering the high degree of uncertainty over how the situation may develop. We also present an alternative case where risks to energy production and trade in the Middle East remain high due to a prolonged conflict (see Strait Down – Stocks Draw as the Loss of Hormuz Flows Tightens Balances). In this case, energy markets and economies around the world need to brace for significant disruptions in the months to come.
OPEC+ crude oil production1
million barrels per day
Short review
The IEA’s April 2026 Oil Market Report is materially darker than the March 2026 edition. March still framed the shock as a historic supply disruption that would slow, but not reverse, 2026 oil demand growth. April moves beyond that: it says the war has now upended the global outlook, with 2026 oil demand expected to contract by 80 kb/d, versus March’s view that global oil consumption would still grow by 640 kb/d in 2026. At the same time, the April report says global oil supply actually plunged by 10.1 mb/d in March to 97 mb/d, worse than March’s projection for an 8 mb/d drop.
The most important change is that the April report shows the crisis spreading from a supply shock into a broader macro demand-destruction story. In March, the IEA was focused on the immediate disruption to flows through the Strait of Hormuz, emergency stock releases, and the first signs of weaker demand from flight cancellations and LPG shortages. By April, the tone is harsher: supply and trade disruptions are still severe, but now the agency says scarcity and higher prices are spreading demand destruction, especially across naphtha, LPG, and jet fuel, and warns that a 1.5 mb/d decline in 2Q26 would be the sharpest since the Covid demand collapse.
April also shows that the market is tighter in the physical barrel than March suggested. In March, Brent had surged close to $120/bbl before easing to about $92/bbl at the time of writing. In April, the IEA says North Sea Dated crude was around $130/bbl, about $60/bbl above pre-conflict levels, while physical crude had surged near $150/bbl, and Singapore middle distillates rose above $290/bbl. That is a clear sign the report is no longer just describing volatility in futures, but a severe shortage of immediately available barrels and products.
The inventory message also changed. March stressed that consumer countries still had a significant cushion, highlighting 8.21 billion barrels of global observed stocks in January and the IEA members’ decision to make 400 mb of emergency reserves available. April, by contrast, shows those buffers being used: global observed oil inventories fell by 85 mb in March, with a 205 mb draw outside the Middle East, while floating and onshore storage rose inside the region because exports were trapped by restricted shipping.
My read is that the April report is not just a monthly update to March. It is a regime shift in the IEA’s framing: from “the market can absorb a historic disruption if logistics normalize” to “the disruption is now large enough to hit supply, refining, inventories, prices, and end-user demand at the same time.” The report’s central message is that resumption of normal flows through the Strait of Hormuz is the key variable for both oil prices and the global economy. That is an inference from the report’s own emphasis on severely restricted flows, large export losses, and the direct link it draws to price pressure and economic strain.
Q&A
Q1) What is the headline message of the April 2026 IEA oil report?
The headline is that the oil shock has become broad enough to flip the 2026 demand outlook from growth to contraction, while supply losses, refining disruptions, and price spikes have all intensified.
Q2) What is the biggest difference versus the March report?
March still expects 2026 oil demand growth, even after trimming forecasts, while April expects a small contraction. March projected a severe March supply hit; April shows the realized disruption was even worse.
Q3) How much did the supply shock worsen?
The March projected global oil supply would fall by 8 mb/d in March. April says supply actually fell by 10.1 mb/d to 97 mb/d, making the disruption larger than previously estimated.
Q4) Why is the Strait of Hormuz still the key issue?
Because the IEA says restoring regular flows through the Strait is the single most important variable for easing pressure on energy supplies, prices, and the global economy. In early April, flows through the Strait were only about 3.8 mb/d, versus more than 20 mb/d in February before the crisis.
Q5) What does the April report say about refining and products?
It says refinery stress has deepened. Middle East and feedstock-constrained Asian refineries cut runs by about 6 mb/d in April. Global crude runs are expected to fall by 1 mb/d on average in 2026, and middle distillate cracks reached record highs.
Q6) What happened to inventories?
March emphasized the existence of a large stock cushion and emergency reserve releases. April shows those buffers being drawn down, with 85 mb of global inventory decline in March and particularly large draws outside the Middle East.
Q7) What happened to prices between the two reports?
March described a surge in Brent to almost $120/bbl, later easing to around $92/bbl. April describes a much tighter physical market, with North Sea Dated around $130/bbl and physical crude near $150/bbl.
Q8) Is the April report bullish or bearish for oil prices?
It is bullish for crude and refined products in the near term, but also bearish for global demand and growth if the disruption lasts. That conclusion is an inference from the report’s combination of restricted flows, higher prices, weaker refining activity, stock draws, and explicit demand destruction.
Q9) What is the main market takeaway for investors?
The market is no longer trading only a geopolitical headline premium. The April report suggests oil is now trading at a real physical shortage, with the key swing factor being whether shipping through the Strait of Hormuz normalizes fast enough to stop further stock draws and demand damage.
Q10) In one sentence, how should this report be described?
The April OMR says the market has moved from a historic supply disruption to a broader energy-and-growth shock, and it is materially more severe than the March edition.
Comments