 English
 پارسی


The Federal Reserve’s March 2026 Economic Projections
Stronger growth expectations, firmer inflation forecasts, and a dot plot that still points to a policy path above the longer-run neutral rate
The Federal Reserve’s March 18, 2026, Summary of Economic Projections delivered a mixed but important signal for markets. On one hand, FOMC participants raised their median GDP forecasts for 2026, 2027, and 2028, suggesting more resilience in U.S. economic activity than they projected in December. On the other hand, the Fed also revised inflation projections higher for both headline and core PCE in 2026 and 2027, showing that the path back to 2% inflation is expected to remain uneven.
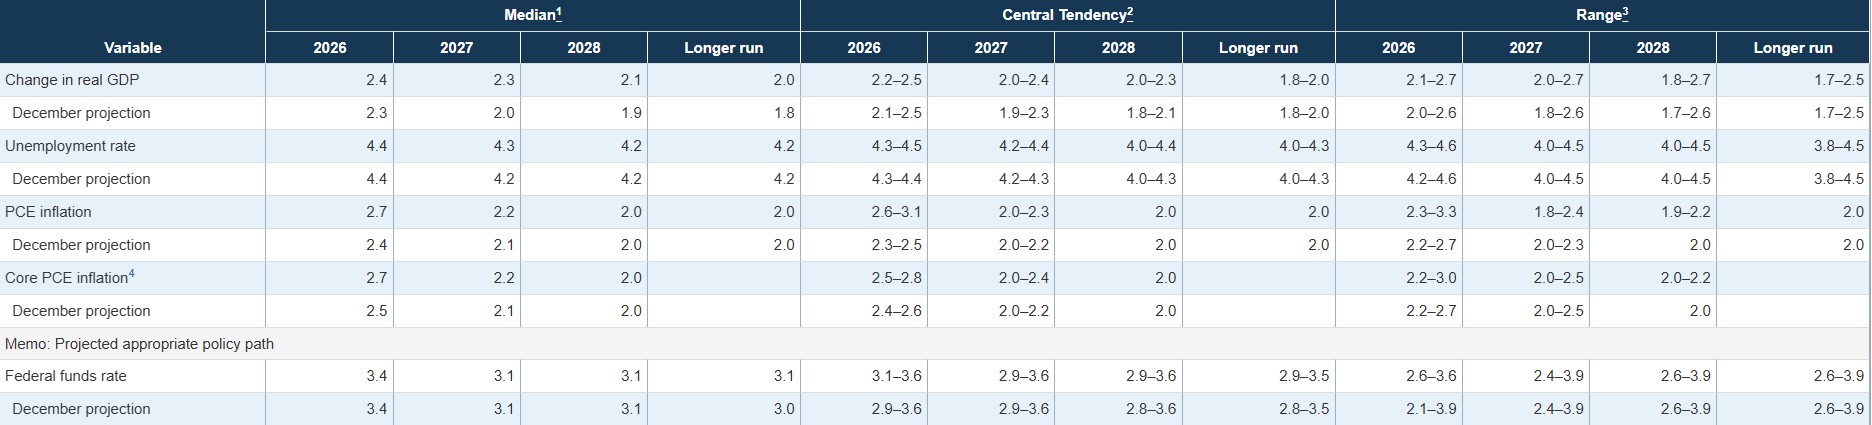
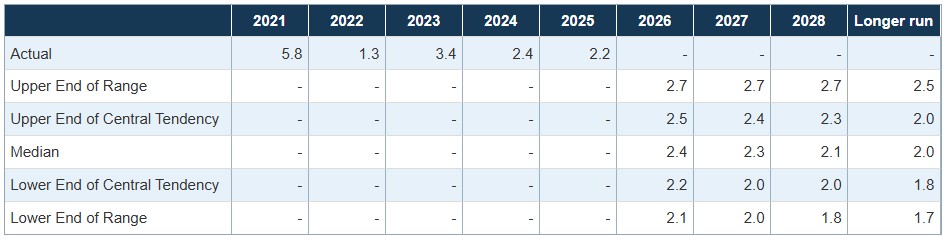
The new SEP showed median real GDP growth projections of 2.4% in 2026, 2.3% in 2027, and 2.1% in 2028, up from 2.3%, 2.0%, and 1.9% in the December 2025 SEP. The longer-run growth estimate also moved up to 2.0% from 1.8%, indicating a modestly more optimistic view of the economy’s underlying potential.
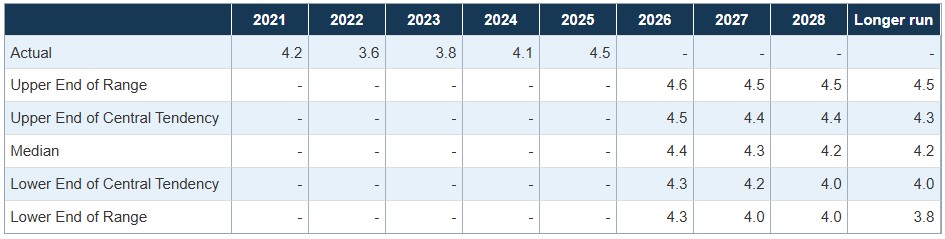
At the same time, the unemployment outlook remained only slightly softer. The median unemployment rate projection stood at 4.4% for 2026, 4.3% for 2027, and 4.2% for 2028, compared with 4.4%, 4.2%, and 4.2% in December. That suggests the Fed still expects some cooling in labor-market conditions, but not a sharp deterioration.
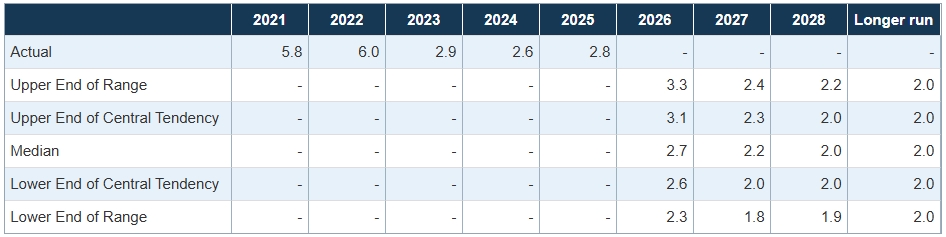
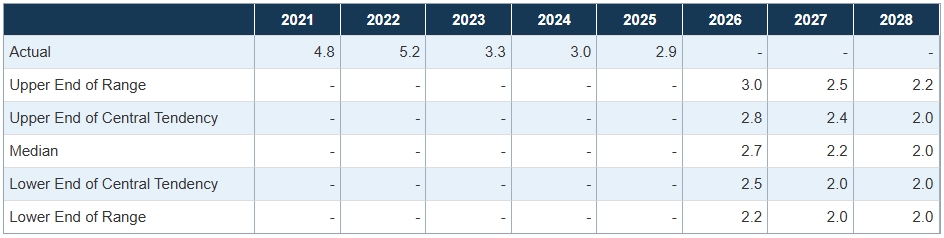
The inflation side of the SEP was more hawkish. Median PCE inflation was projected at 2.7% in 2026, 2.2% in 2027, and 2.0% in 2028, up from 2.4%, 2.1%, and 2.0% in December. Median core PCE inflation was projected at 2.7% in 2026, 2.2% in 2027, and 2.0% in 2028, versus 2.5%, 2.1%, and 2.0% previously. In other words, the Fed now sees a firmer near-term inflation path even as it still expects inflation to return to target over time.
The federal funds rate projections did not show a dramatic policy pivot lower. The March distribution of dots remained centered on a policy path that stays clearly above the longer-run rate through 2028, with the 2026 dots concentrated around 3.375% to 3.625% and the 2027–2028 dots still clustered around 3.125% to 3.375%. The longer-run assessments remained centered near 3.0%, meaning the projected policy path is still restrictive rather than neutral.
The risk assessment in the SEP also became more cautious. For GDP growth, 15 participants judged uncertainty as higher than normal, and 14 participants saw risks weighted to the downside. For unemployment, 16 participants judged uncertainty as higher, and 16 participants saw risks weighted to the upside. For inflation, 16 participants said uncertainty around PCE inflation was higher, while 17 participants judged risks to PCE inflation as weighted to the upside.
Taken together, the March 2026 SEP points to a Fed that is more comfortable with the growth outlook than it was in December, but less comfortable with the inflation outlook. The overall message is not one of imminent easing. Instead, it is a higher-growth, still-sticky-inflation, still-restrictive-policy baseline.
What changed from December 2025 to March 2026
The biggest shift in the March SEP was the combination of higher growth and higher inflation. In December, the Fed projected a slower medium-term economy with a smoother disinflation path. In March, policymakers upgraded GDP, nudged unemployment slightly higher in 2027, and revised both headline and core inflation forecasts upward. That mix matters because it reduces the urgency for aggressive rate cuts while keeping the inflation fight unfinished. This final point is an inference based on the revised medians.
Q&A
1) What was the main message of the March 2026 Fed SEP?
The main message was that the Fed became more optimistic on growth, but also more cautious on inflation. The projections suggest a stronger economy, stickier near-term inflation, and a policy rate likely to remain restrictive for longer.
2) What were the Fed’s GDP forecasts in the March SEP?
The median real GDP growth projections were 2.4% for 2026, 2.3% for 2027, and 2.1% for 2028. All three were higher than in the December 2025 SEP.
3) What did the Fed project for unemployment?
The median unemployment rate projections were 4.4% in 2026, 4.3% in 2027, and 4.2% in 2028. That points to gradual labor-market cooling rather than a sharp deterioration.
4) What were the inflation projections?
Median PCE inflation was projected at 2.7% in 2026, 2.2% in 2027, and 2.0% in 2028. Median core PCE inflation was also projected at 2.7%, 2.2%, and 2.0% for those years. Those forecasts were revised up from December.
5) Did the March 2026 dot plot signal rapid rate cuts?
No. The distribution of dots still implied a policy path above the longer-run rate through 2028, which means the Fed still sees policy as restrictive rather than neutral.
6) What changed the most from December to March?
The biggest change was the combination of higher growth and higher inflation. The Fed upgraded GDP forecasts while also revising inflation projections upward.
7) What did the risk assessments show?
Most participants judged uncertainty to be higher than normal. A majority saw downside risks to GDP growth, upside risks to unemployment, and upside risks to inflation.
8) What is the market takeaway from this SEP?
The broad takeaway is that the Fed is not in a hurry to pivot aggressively toward easing. Growth looks better, but inflation also looks firmer, so the SEP leans more toward patience and caution than a quick policy turn.
Chrts
Table 1. Economic projections of Federal Reserve Board members and Federal Reserve Bank presidents, under their individual assumptions of projected appropriate monetary policy, March 2026
Note: Projections of change in real gross domestic product (GDP) and projections for both measures of inflation are percent changes from the fourth quarter of the previous year to the indicated fourth quarter. PCE inflation and core PCE inflation are the percentage rates of change in the price index for personal consumption expenditures (PCE) and the price index for PCE excluding food and energy, respectively. Projections for the unemployment rate are for the average civilian unemployment rate in the fourth quarter of the year indicated. Each participant’s projections are based on his or her assessment of appropriate monetary policy. Longer-run projections represent each participant’s assessment of the rate at which each variable would be expected to converge under appropriate monetary policy and in the absence of further shocks to the economy. The projections for the federal funds rate are the value of the midpoint of the projected appropriate target range for the federal funds rate or the projected appropriate target level for the federal funds rate at the end of the specified calendar year or over the longer run. The December projections were made in conjunction with the meeting of the Federal Open Market Committee on December 9–10, 2025.
1. For each period, the median is the middle projection when the projections are arranged from lowest to highest. When the number of projections is even, the median is the average of the two middle projections.
2. The central tendency excludes the three highest and three lowest projections for each variable in each year.
3. The range for a variable in a given year includes all participants' projections, from lowest to highest, for that variable in that year.
4. Longer-run projections for core PCE inflation are not collected.
Figure 1. Medians, central tendencies, and ranges of economic projections, 2026–28 and over the longer run
Change in real GDP
Unemployment rate
PCE inflation
Core PCE inflation
-------------------------------
Source: Federal Reserve Board, March 18, 2026, Summary of Economic Projections; December 10, 2025, Summary of Economic Projections.
Comments