 English
 پارسی


Overview
- Global oil production.
Oil flows through the Strait of Hormuz remain constrained, causing oil storage to fill rapidly in countries that depend on the waterway for exports. As a result, we estimate that Iraq, Saudi Arabia, Kuwait, the UAE, Qatar, and Bahrain collectively shut in 7.5 million barrels per day (b/d) of crude oil production in March. We assess that production shut-ins will rise to 9.1 million b/d in April. In this outlook, we assume the conflict does not persist beyond April and that traffic through the Strait of Hormuz gradually resumes. Under those assumptions, we expect production shut-ins to decline to 6.7 million b/d in May and return close to pre-conflict levels by late 2026.
- Crude oil price forecast.
The Brent crude oil spot price averaged $103 per barrel (b) in March, and we expect it to peak at $115/b in the second quarter of 2026 (2Q26) before easing as production shut-ins gradually subside. We maintain a risk premium on crude oil prices throughout the forecast period, as we expect uncertainty surrounding future supply disruptions to keep prices above pre-conflict levels. We forecast that the Brent crude oil price will fall below $90/b in 4Q26 and average $76/b in 2027. This price forecast depends heavily on our assumptions regarding both the duration of the conflict in the Middle East and the resulting oil production outages.
- Brent-WTI spread.
The spread between the Brent crude oil spot price and the West Texas Intermediate (WTI) crude oil spot price widened in March, averaging $12/b, as the conflict in the Middle East pushed Brent higher than WTI. Brent rose more sharply than WTI because it is more exposed to higher shipping costs and reduced oil flows between the Middle East and major consuming markets in Asia. In our forecast, the Brent-WTI spread peaks at $15/b in April, when production disruptions are at their most severe. We expect the spread to gradually narrow as oil flows through the Strait of Hormuz resume and overall oil prices decline.
- Retail gasoline and diesel prices.
Higher crude oil prices have led to higher gasoline and diesel prices, with diesel remaining particularly elevated because of tight global supplies and U.S. inventories staying below the five-year (2021–2025) average. We forecast retail gasoline prices to peak at a monthly average of nearly $4.30 per gallon (gal) in April and to average more than $3.70/gal this year. Diesel prices are expected to peak at more than $5.80/gal in April and average $4.80/gal in 2026.
- LNG exports.
Reduced flows of liquefied natural gas (LNG) through the Strait of Hormuz have tightened global LNG supply and sharply widened the spread between the U.S. benchmark Henry Hub spot price and import prices in Europe and Asia. U.S. LNG export facilities are operating near peak capacity, exporting almost 18 billion cubic feet per day of natural gas in March, close to the record set in December 2025. With capacity utilization already high, only very limited flexibility remains to increase exports further. That flexibility comes from deferred maintenance, the pace of new project ramp-ups, and recent export authorization agreements.
- Natural gas inventories.
Natural gas inventories ended the 2025–2026 withdrawal season (November–March) at just over 1,900 billion cubic feet (Bcf), which is 3% above the five-year average. Supported by growth in natural gas production and very limited capacity to increase exports, we expect storage injections to outpace the five-year average and inventories to end October at 4,015 Bcf, or 6% above the five-year average.
- Electricity demand.
U.S. electricity demand rises in our forecast, led by growth in the commercial sector. Electricity demand peaks during the summer months (June–September) as cooling needs increase. This summer, we expect electricity demand from both the residential and commercial sectors to rise by 3% compared with last summer. Growth in the commercial sector is projected to reach 6% in the summer of 2027, exceeding the residential sector’s 1% growth.
What the Report Is Really Saying
EIA Short-Term Energy Outlook April 2026:
The April 2026 Short-Term Energy Outlook from the U.S. Energy Information Administration presents a market that is no longer trading on a standard supply-demand cycle. The report is built around a geopolitical shock. In the EIA’s framework, the closure and restriction of flows through the Strait of Hormuz have created a major near-term oil supply disruption, lifted the entire petroleum price complex, widened regional pricing gaps, and reinforced a lasting geopolitical premium even if flows begin to normalize later this year.
That is why this report matters beyond energy. It is not only about oil balances or fuel prices. It also carries direct implications for inflation, transport costs, consumer spending, monetary policy expectations, sector rotation in equities, and broader cross-asset risk sentiment.
The Core Shift in the April Outlook
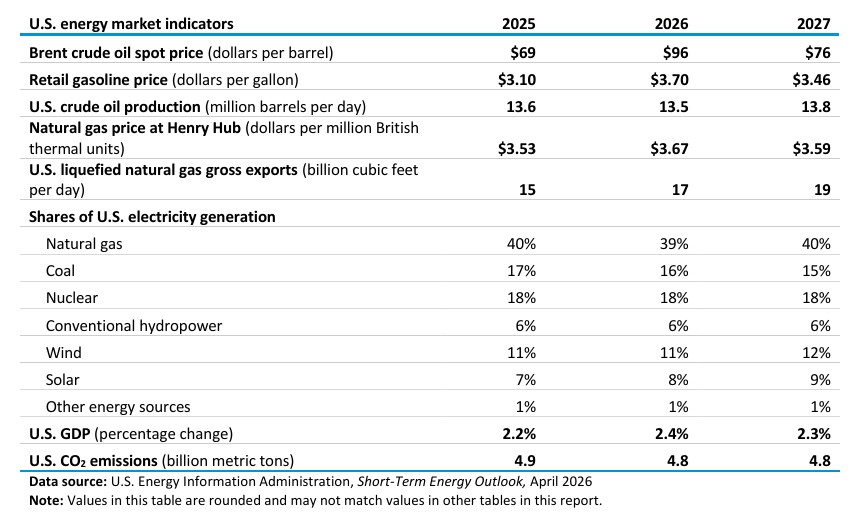
The biggest change in the April report is the crude oil forecast. The EIA now expects Brent crude to average $96 per barrel in 2026 and $76 per barrel in 2027, versus $79 and $64 respectively in the previous forecast. It says Brent averaged $103 per barrel in March and is expected to peak around $115 per barrel in the second quarter of 2026 before easing later as disruptions gradually abate. The report also says this forecast is highly dependent on assumptions about the duration of the Middle East conflict and the scale of supply outages.
That revision is substantial. It tells the market the EIA no longer sees the current oil move as a short-lived spike that fades quickly back toward the earlier downtrend. Instead, it sees a slower normalization path with risk premium embedded through the forecast horizon.
The Oil Story Is a Supply Shock, Not a Demand Boom
The report makes clear that the main driver is disrupted supply. According to the EIA, oil flows through the Strait of Hormuz remain limited, forcing key producers in the region to shut in significant volumes. It estimates that Iraq, Saudi Arabia, Kuwait, the UAE, Qatar, and Bahrain collectively shut in 7.5 million barrels per day in March, with shut-ins rising to 9.1 million barrels per day in April before gradually falling later. The report assumes the conflict does not persist past April and that traffic through Hormuz gradually resumes, but it also says oil flows do not fully return to pre-conflict levels until late 2026.
This matters because it changes how traders should read price strength. A supply-driven rally behaves differently from a demand-driven rally. In a demand boom, higher prices may be offset over time by slowing consumption. In a supply shock, the adjustment is more abrupt, inventory draws are faster, freight dislocations matter more, and pricing can stay distorted longer than many models initially expect. That is exactly the framework the EIA now describes.
Global Inventories and the New Price Regime
The April outlook says that before the conflict, the EIA saw the global oil market as oversupplied and inventories building. That earlier framework has now been overtaken by conflict-related outages. The agency says shut-in production and disrupted flows have led to a sharp drawdown in global inventories, and it forecasts a global inventory draw of 5.1 million barrels per day in 2Q26. It also notes that strategic stock releases, including the U.S. Strategic Petroleum Reserve and coordinated releases announced by the International Energy Agency, are part of the current outlook.
This is one of the most important market signals in the report. When inventories move from build to rapid draw, the market typically becomes much more sensitive to headline risk. Price action tends to become less about average fundamentals and more about marginal disruption, tanker routes, spare capacity, and timing. That usually means more volatility and less confidence in mean-reversion trades.
Why Brent Is Stronger Than WTI
The report also explains why Brent has risen more sharply than WTI. The Brent-WTI spread averaged $12 per barrel in March and is expected to peak at $15 per barrel in April before narrowing later in the year. The EIA attributes that widening to Brent’s greater exposure to global shipping conditions, higher maritime costs, and reduced flows between the Middle East and major Asian consuming markets. By contrast, WTI is partly cushioned by above-average U.S. crude inventories and policy measures such as the SPR release and a temporary Jones Act waiver.
For markets, that means location and benchmark selection matter. This is not only an “oil up” story. It is also a relative value story. As long as disruption risk remains concentrated around export routes and seaborne flows, Brent can continue to command a premium over inland U.S. benchmarks. That has implications for spread traders, refiners, exporters, and any sector whose margins are benchmark-sensitive.
Gasoline and Diesel: The Inflation Transmission Channel
The EIA expects the crude shock to flow directly into retail fuels. It forecasts U.S. gasoline prices peaking near $4.30 per gallon in April and averaging $3.70 per gallon in 2026, up from $3.10 in 2025. For diesel, the move is more severe: the report sees prices above $5.80 per gallon in April and averaging $4.80 per gallon in 2026, up from $3.66 in 2025. It also notes that diesel remains particularly elevated because global distillate supplies are tight and U.S. inventories remain below the five-year average.
This part of the report matters because diesel is often the more macro-sensitive fuel. Diesel affects freight, shipping, logistics, industrial distribution, and parts of the agricultural and construction chains. When diesel stays structurally elevated, the inflation effect is broader than what headline gasoline alone might imply. That makes the April STEO relevant not just for energy traders but also for macro desks, inflation watchers, and central bank observers.
LNG Exports: A Global Tightness Story with U.S. Constraints
The natural gas section is more nuanced. The EIA estimates U.S. LNG exports at 17.9 Bcf/d in March, describing that as the second-highest monthly volume on record after December 2025. It forecasts full-year 2026 LNG exports at 17.0 Bcf/d and 2027 exports at 18.6 Bcf/d, both above the previous annual record of 15.1 Bcf/d in 2025. It says export demand is being supported by the wide spread between U.S. domestic gas prices and European and Asian import prices, while U.S. facilities are already operating near peak capacity.
That means the U.S. is benefiting from global LNG tightness, but it also means spare export flexibility is limited. The EIA points to deferred maintenance, new project ramp-ups, and recent export authorization changes as the main areas where incremental volume can come from. This is constructive for LNG-linked infrastructure and export-sensitive energy names, but it also suggests the market should not assume a limitless U.S. response to global shortages.
Why Henry Hub Is Not Moving Like Global Gas
Despite the global LNG disruption, the EIA does not project the same kind of domestic U.S. gas squeeze that oil is experiencing. It says U.S. natural gas inventories ended the 2025–2026 withdrawal season at around 1,900 Bcf, which is about 3% above the five-year average. It expects injections to outpace the five-year average and for storage to end October at 4,015 Bcf, about 6% above average. It forecasts Henry Hub at $3.67/MMBtu in 2026 and says 2Q26 and 3Q26 prices remain close to recent seasonal norms at around $3.10/MMBtu.
In practical terms, that means global gas benchmarks and U.S. gas benchmarks may remain decoupled. The U.S. domestic market still has a storage cushion and production support, even while global LNG supply is under pressure. The bullish case for U.S. gas is therefore more conditional. It likely needs stronger summer power burn, weaker production growth, faster export ramp-up, or weather-driven tightness to become a sustained domestic price spike story.
Electricity Demand, Renewables, and Coal
Outside oil and gas, the report shows a U.S. power market that continues to grow steadily. The EIA expects electricity demand to rise 1.2% in 2026 and 3.3% in 2027. Summer demand is forecast to increase as cooling needs rise, with the commercial sector leading growth. On the supply side, generation growth this year is led by renewables, especially solar, which the EIA expects to produce 17% more electricity in summer 2026 than last summer. Hydro and wind are also forecast to increase, while coal-fired generation continues to lose ground.
This matters for market structure. The report reinforces a medium-term theme of stronger U.S. power demand, increasing renewable penetration, and declining coal dependence. It does not overturn the role of natural gas in the power mix, but it does show that incremental demand growth is increasingly being met by renewables and by a system that continues to shift away from coal.
What the April EIA Outlook Means for Markets
For crude oil markets, the report is supportive for prices in the near term and especially supportive for Brent relative to WTI while Middle East export disruptions remain unresolved. As long as the market is trading on shipping disruption, shut-in production, and uncertainty around Hormuz, dips are likely to be treated as geopolitical pullbacks rather than clean trend reversals.
For refined products, the report is especially supportive for diesel sensitivity. A sustained diesel premium tends to matter for transport, freight, industrial cost structures, and inflation expectations. If distillate tightness continues, the market may price broader economic effects than gasoline alone would suggest.
For natural gas, the report is supportive for LNG exporters and gas infrastructure tied to overseas demand, but more balanced for Henry Hub itself. The domestic U.S. market still has enough inventory and production support to prevent the kind of explosive repricing seen in international gas markets, at least under the EIA’s current assumptions.
For equities and macro assets, the signal is mixed but important. A prolonged period of high oil and diesel prices tends to support energy producers and some infrastructure-linked names, while pressuring transport, consumer discretionary, and fuel-sensitive industrial segments. It can also keep inflation expectations firmer and make central banks more cautious about easing.
Final Reading of the Report
The April 2026 STEO should be read as a market document shaped by disruption, not equilibrium. The EIA is effectively saying that the market is living through a real supply shock, that partial normalization is possible later, but that the premium attached to geopolitical energy risk will not disappear quickly. That is why the report is important not just for oil traders, but for anyone watching inflation, policy expectations, equity leadership, and cross-asset volatility.
Q&A
Q1: What is the main message of the latest EIA Short-Term Energy Outlook?
The main message is that energy markets are moving in different directions rather than as one unified story. Oil remains heavily influenced by geopolitical supply risk, natural gas looks softer in the near term because of more comfortable storage, and the electricity sector continues to favor gas and solar over coal.
Q2: Why is the oil outlook important for financial markets?
The oil outlook matters because higher crude prices can affect inflation expectations, transport costs, corporate margins, and central bank pricing. If oil rises because of supply disruption rather than stronger demand, markets usually read it as an inflation risk rather than a clean growth-positive signal.
Q3: What does the report suggest about natural gas?
The report suggests that natural gas prices may stay softer in the near term because storage levels are higher than expected, even though LNG exports continue to provide a supportive longer-term demand story.
Q4: What is the key takeaway for the power sector?
The key takeaway is that U.S. electricity demand is still growing, solar is steadily increasing its share, natural gas remains the dominant source of generation, and coal continues to lose ground structurally.
Q5: How can investors use this report?
Investors can use the report to separate the energy market into different trades. Oil producers, LNG-linked assets, utilities, grid infrastructure names, and renewable-related companies may react very differently depending on which part of the outlook becomes the dominant market driver.
--------------
Source: U.S. Energy Information Administration, Short-Term Energy Outlook, April 2026
Comments