translate English
 پارسی
English
Englishپارسی
English
Englishپارسی EnglishپارسیEnglishپارسی

This setup favors a controlled bearish trade because price remains below both the 50-day and 200-day moving averages, while MACD is still negative. A daily close back above 62,500 would weaken the bearish setup, while a stronger trend change would require recovery above the 72,100 area.

SOL/USD is trading below its 20-period and 50-period EMAs on the H1 chart while testing the 85.15 support zone. Read the latest technical analysis, fundamental note, and trading signal with clear entry and exit levels. This setup favors a cautious bearish trade because price remains below the 20- and 50-hour EMAs, the Parabolic SAR is still above price, and the recent trendline break has not yet been repaired. A sustained move back above 86.30–86.45 would weaken the bearish setup materially.

ETH/USD is testing the 2,300 support area on the hourly chart while trading below the Donchian midline. Read the latest technical analysis, fundamental market note, and a clear trading signal with entry and exit levels. This setup favors a downside continuation trade because price is sitting near the lower Donchian band, remains below the midline resistance, and the recent swing structure still points to lower highs. A sustained move back above 2,354 would weaken the bearish setup materially.
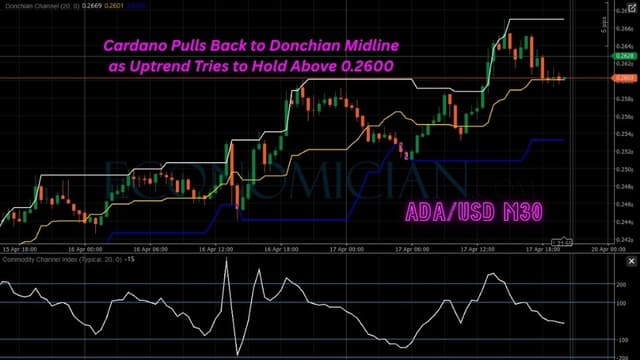
ADA/USD is pulling back to the Donchian midline on the 30-minute chart while holding a broader short-term uptrend. Read the latest technical analysis, fundamental note, and trading signal with clear entry and exit levels. This setup favors a cautious long bias because price is testing the Donchian midline rather than collapsing through it, and the broader intraday structure still shows higher highs and higher lows. A sustained move below 0.2532 would weaken the bullish setup materially.

EOS/USD on the 30-minute Heikin Ashi chart is pushing above the Bollinger mid-band and testing 0.0732 resistance. Read the latest technical analysis, fundamental note, and trading signal with clear entry and exit levels. This setup is based on price holding above the Bollinger middle band, the MACD bullish crossover, and the recovery structure from the 0.0714 base. A drop back below 0.0722 would weaken the immediate bullish setup and increase the risk of a return toward 0.0700.

BTC/USD is trading above its 20-day and 50-day EMAs on the daily chart, signaling a constructive recovery phase. Read the latest technical analysis, short fundamental note, and a clear trading signal with entry and exit levels. This setup is based on price trading above both the 20-day and 50-day EMAs, RSI holding above 50, and the chart pressing a key recovery zone. A daily close back below 72,622 would weaken the bullish structure, while a break above 75,000 would strengthen the case for an extension toward the higher resistance zone.

BTC USD in the daily chart favors a bearish continuation trade because price remains below both moving averages, the broader trend is still negative, and the MACD improvement is not yet strong enough to confirm a bullish reversal. BTC/USD is trading below its 20- and 50-period SMAs on the D1 chart, keeping the broader bias bearish. Here is the key technical setup, short fundamental note, and trading signal with clear entry and exit levels.