translate English
 پارسی
English
Englishپارسی
English
Englishپارسی EnglishپارسیEnglishپارسی
Pivot / Resistance: 4,090
Bias: Bearish below 4,090
Our preference:
Alternative scenario:
Scenario violation:
The bearish scenario is invalidated if gold breaks and holds above 4,090. In that case, the setup shifts toward further upside with targets at 4,110 and 4,130.
Comment:
As long as the resistance at 4,090 is not surpassed, gold remains under downside pressure, and the risk of a break toward/below 3,985 remains high.
Trading implication:
Below 4,090, the bearish setup remains active toward 4,030 and 4,000, with 3,985 as the deeper downside level to watch. A sustained move above 4,090 cancels the short setup and shifts focus to 4,110/4,130.
BTC/USD H1 Technical Analysis
Bitcoin is trading near $62,680 after a sharp rejection from the $64,300–$64,600 resistance area. The decline has returned price to the 50% Fibonacci retracement zone, making the $62,400–$62,700 area the main short-term decision point.
The broader H1 recovery has not been fully invalidated because Bitcoin remains above the previously broken descending trendline. However, the latest selloff shows that buyers failed to sustain the move above the 61.8% retracement near $63,590.
The Standard Deviation indicator has risen to approximately 507, confirming a meaningful expansion in volatility. This does not independently determine direction, but it increases the risk of wider price swings and false intraday breaks.
Immediate support is located at $62,400–$62,200. A confirmed break below this area would expose the 38.2% Fibonacci level near $61,290, followed by the 23.6% level around $59,900. Initial resistance sits at $63,000, followed by $63,590 and the recent swing zone around $64,400–$64,600.
The technical structure is therefore neutral with a conditional bullish bias while the 50% retracement holds. A bullish entry requires confirmation rather than an immediate purchase during the current volatility spike.
Market bias: Bullish
Brent Oil H1 Technical Analysis
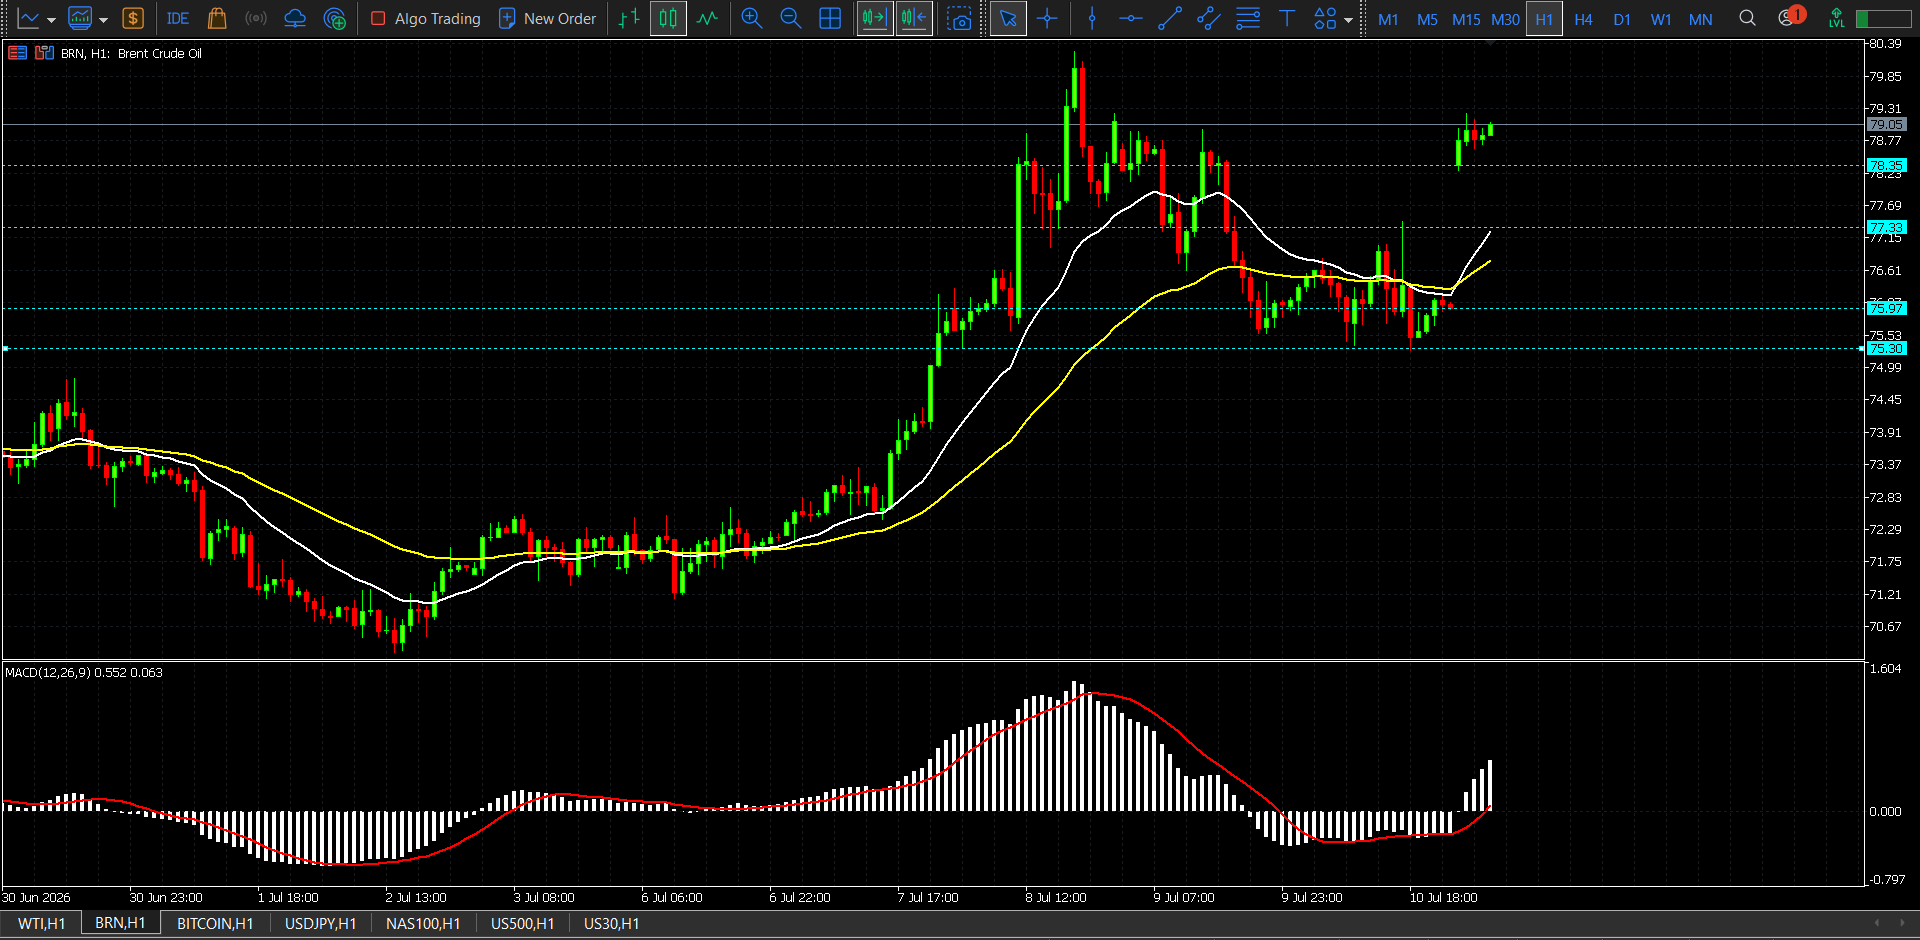
Brent crude is trading near $79.05 on the H1 chart after breaking decisively above the important $78.35 resistance level. Price is holding near the upper end of the latest rally rather than immediately reversing, keeping the short-term structure bullish.
The market is trading comfortably above both moving averages. The faster white average has turned sharply higher and remains above the slower yellow average, confirming an improving trend structure. The former resistance at $78.35 has now become the primary breakout-support zone.
The MACD has moved back into positive territory, while its histogram is expanding and the signal line is turning higher. This supports further upside potential, although the sharp advance means that buying at the current market price offers a weaker risk-to-reward profile than waiting for a controlled retest.
Immediate resistance is located at $79.31, followed by $79.85 and $80.39. Initial support stands at $78.35, followed by $77.33. Deeper support is visible at $75.97–$75.30.
The H1 bias remains bullish while Brent holds above $78.35, but a return below that level would signal that the breakout is losing strength.
Market bias: Bullish
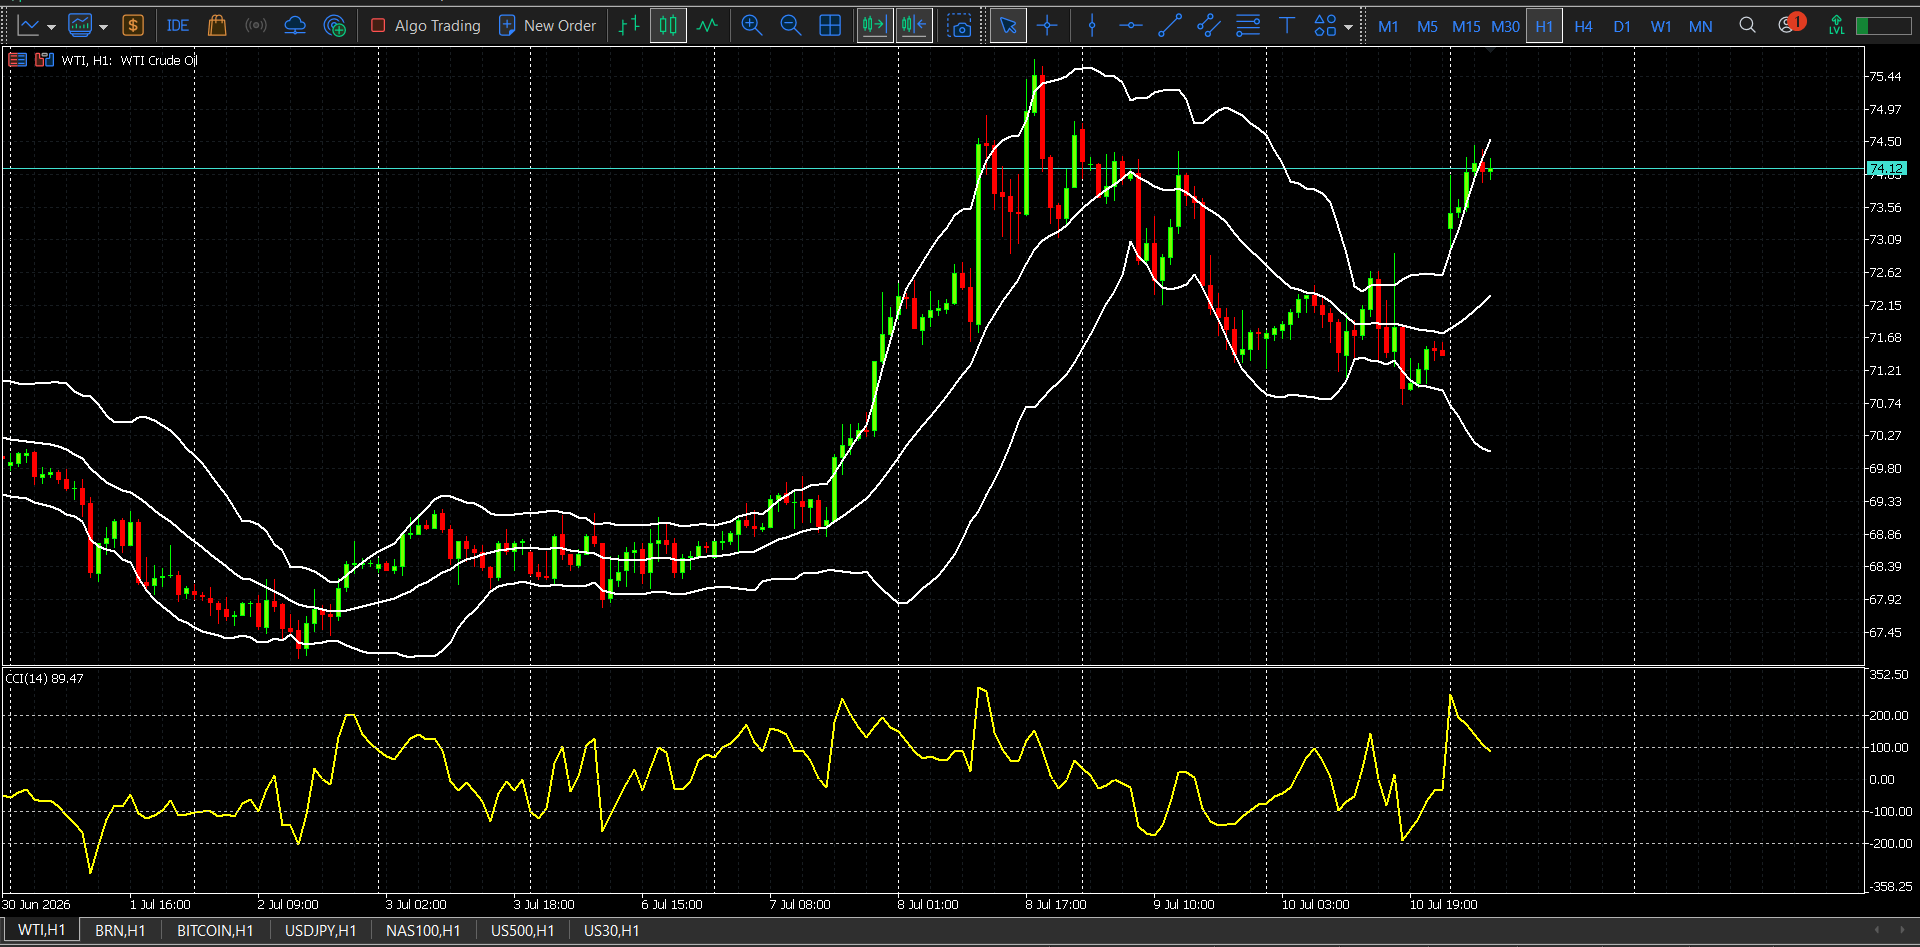
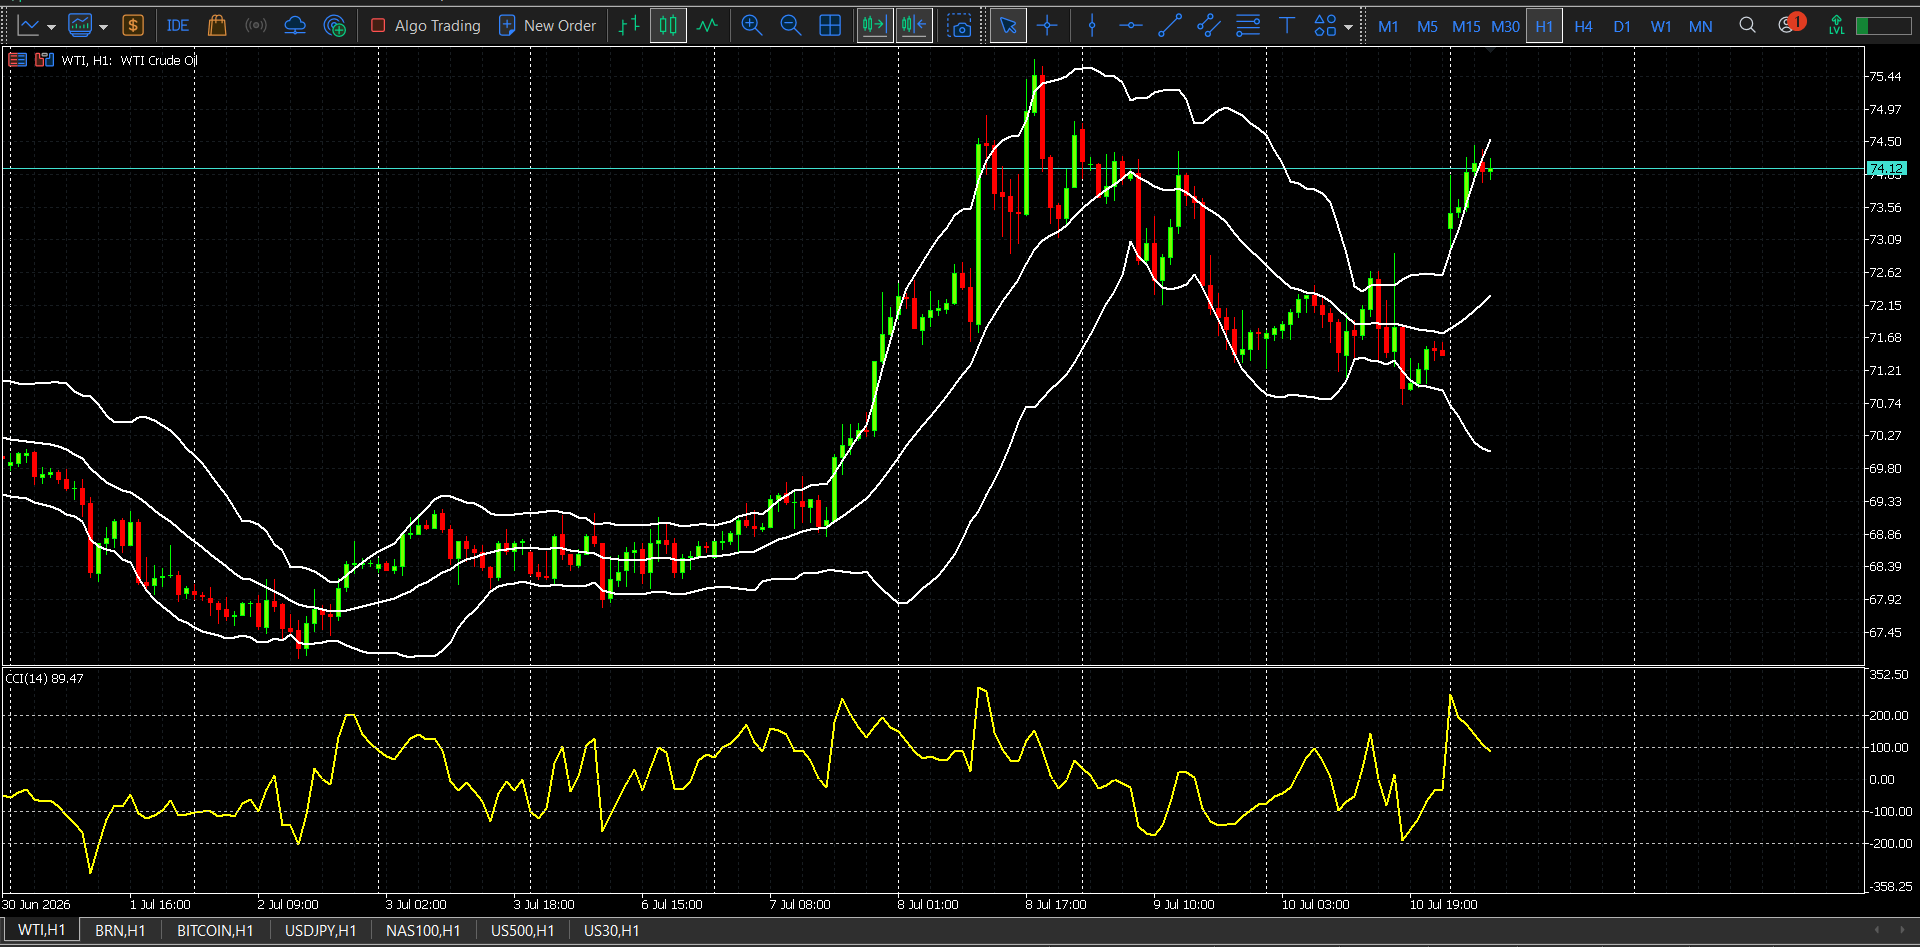
WTI is trading near $74.13 on the H1 chart after a strong breakout from the $71.20–$71.70 consolidation zone. Price has moved above the Bollinger Bands’ middle line and is holding near the upper band, confirming that buyers currently control the short-term structure.
The latest candles show consolidation immediately below $74.50, rather than a sharp rejection of the rally. This favors further upside continuation, although buying directly beneath resistance carries weaker risk-to-reward than waiting for a controlled pullback.
The CCI(14) stands near 89.47, indicating strong positive momentum without reaching an extreme overbought level. The widening Bollinger Bands also reflect rising volatility following the breakout. However, the distance between price and the middle band means that a temporary pullback cannot be ruled out.
Immediate resistance is located at $74.50, followed by $74.95–$75.00 and $75.44. Initial support sits at $74.00, followed by $73.56 and $73.09. The H1 structure remains bullish while price holds above the $73.56 breakout-support area.
BIAS: Bullish
Time Frame & Context: Robinhood is trading near $115.11, after reaching an intraday high of $117.63 and holding above the open near $112.17. The stock remains in momentum mode after Investors.com flagged Robinhood as showing a buy signal, supported by a major product launch and an analyst upgrade.
Technical Pattern: Momentum breakout / breakout retest above prior intraday base.
Entry Status Levels:
The buy setup is active inside the $112.20–$115.50 entry zone, especially while HOOD holds above the intraday base near $112.17–$112.20. The setup becomes weaker if price loses $112.20, and it is canceled below $111.50.
Targets:
Take Profit 1: $117.60
Take Profit 2: $120.00–$122.00
Scenario Violation:
The bullish scenario is invalidated if Robinhood breaks and holds below $111.50. A deeper bearish correction could develop if high-beta fintech and crypto-linked equities lose momentum again.
Exit Status Levels:
For an active long position, partial exit is reasonable near $117.60, close to the intraday high at $117.63. The main exit zone sits near $120.00–$122.00. If price moves below $111.50, the bullish trade should be fully exited because the scenario is violated.
Core Risk / Catalyst:
The main risk is a reversal in high-beta fintech and crypto-linked equities. HOOD is sensitive to both equity-market risk appetite and crypto-market volatility, so another crypto selloff or Nasdaq risk-off move would weaken the trade.
Trading Implication:
As long as Robinhood holds above $112.20 and stays within the bullish momentum structure, the upside setup remains active toward $117.60 and then $120.00–$122.00. A sustained move below $111.50 cancels the long setup and shifts focus toward a corrective structure.
BIAS: Bearish
Time Frame & Context: AUD/JPY is trading around 112.28–112.32, close to the lower end of today’s 112.27–112.79 range. The pair is below its 5-day moving average at 112.46 and 50-day moving average at 112.61, while both RSI and MACD are flagged as sell-side signals.
Technical Pattern: Moving-average breakdown / lower-range continuation.
Entry Status Levels:
The sell setup is active inside the 112.25–112.45 entry zone, especially if price remains below the 5-day MA at 112.46 and the 50-day MA at 112.61. The setup becomes weaker if price reclaims 112.45–112.61, and it is canceled above 112.80.
Targets:
Take Profit 1: 111.70
Take Profit 2: 111.20
Scenario Violation:
The bearish scenario is invalidated if AUD/JPY breaks and holds above 112.80. A stronger bullish correction could develop if renewed yen weakness pushes the pair back above the moving-average resistance zone.
Exit Status Levels:
For an active short position, partial exit is reasonable near 111.70. The main exit sits near 111.20. If price moves above 112.80, the bearish trade should be fully exited because the scenario is violated.
Core Risk / Catalyst:
The main risk to the bearish setup is renewed yen weakness. Reuters reported that the yen remains fragile and is heading for a weekly decline, while intervention risk is rising as yen crosses remain elevated.
Trading Implication:
As long as AUD/JPY stays below 112.80, the bearish structure remains active toward 111.70 and then 111.20. However, a sustained move above 112.80 cancels the short setup and shifts focus toward a bullish correction.
BIAS: Bullish
Time Frame & Context: Solana is trading around $77.97–$78.80, with CoinGecko showing a roughly 2.48% 24-hour gain and CoinMarketCap showing SOL near $78.93 with about $1.77 billion in 24-hour volume. SOL looks cleaner than BTC today because it shows stronger relative upside momentum while still trading within a liquid large-cap crypto structure.
Technical Pattern: Short-term bullish continuation / momentum retest above the $77–$78 support area.
Entry Status Levels:
The buy setup is active inside the $77.50–$78.80 entry zone if price holds above the $77–$78 support area. It becomes less attractive if price loses $77.00, and it is canceled below $75.80.
Targets:
Take Profit 1: $82.00
Take Profit 2: $85.00
Scenario Violation:
The bullish scenario is invalidated if SOL breaks and holds below $75.80. A deeper bearish correction could develop if the broader crypto market enters risk-off mode again.
Core Risk / Catalyst:
The main risk is broad crypto risk-off linked to U.S.–Iran headlines. Crypto sold off earlier this week after renewed geopolitical escalation, and Solana was among the weaker large-cap tokens during that risk-off move.
Trading Implication:
As long as SOL holds above the $77–$78 support area, the bullish setup remains active toward $82.00 and then $85.00. A sustained move below $75.80 cancels the long setup and shifts the focus toward a corrective structure.
Signal overview:
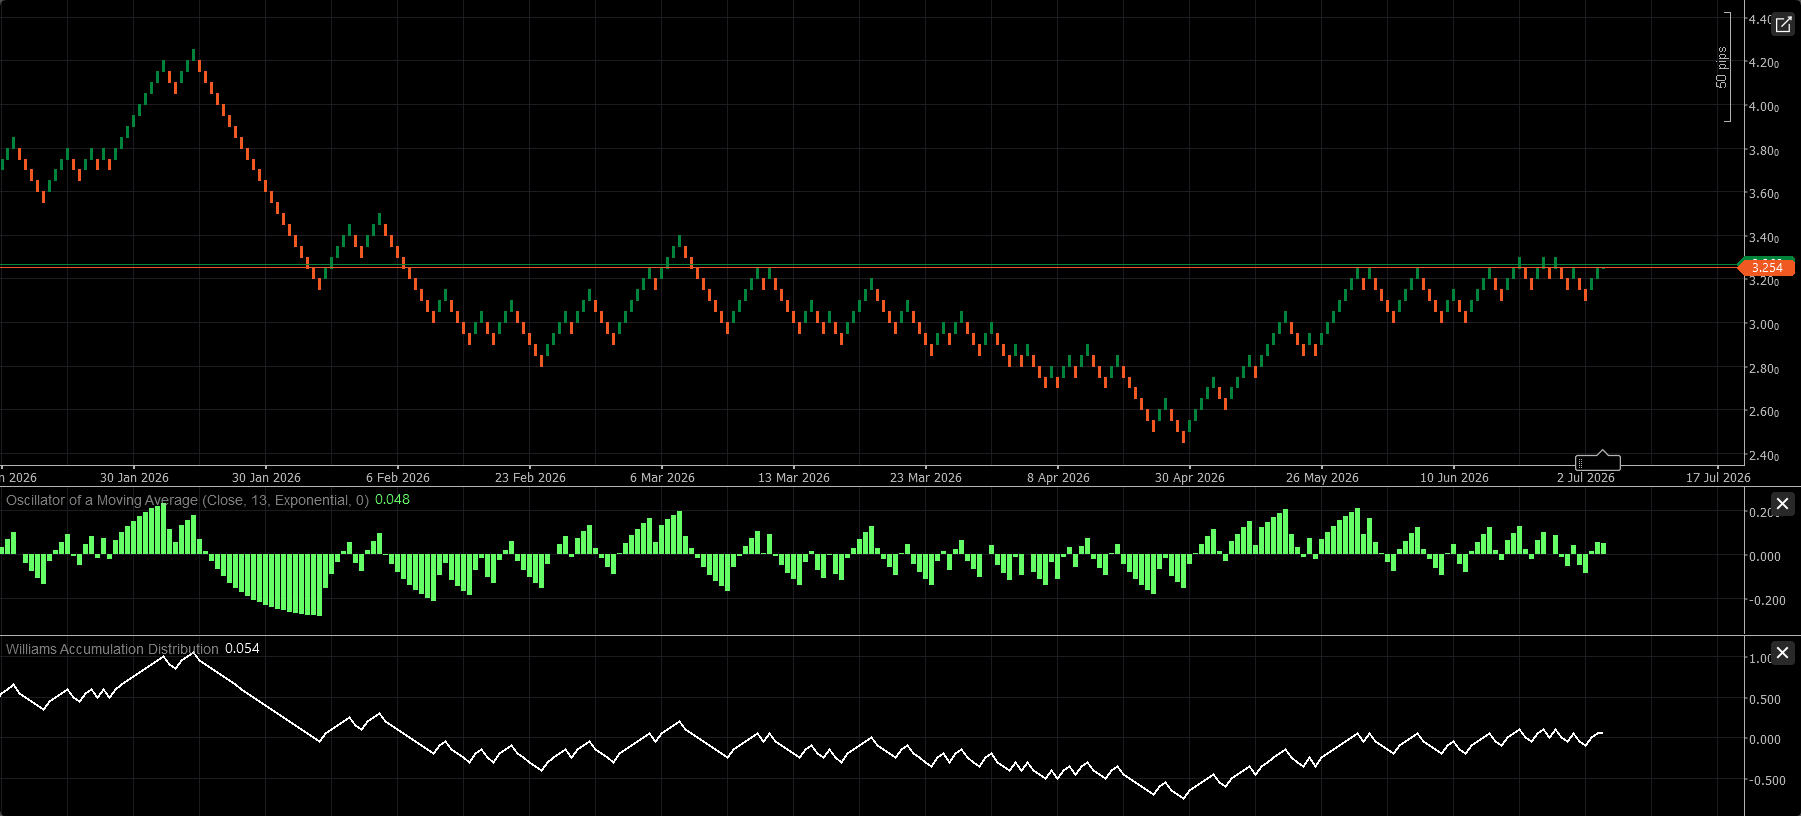
XNG/USD turns bullish only after a confirmed breakout above 3.27. If price holds above this level, the upside path opens first toward 3.40, then 3.55 in extension.
Entry status levels:
Scenario violation:
The bullish scenario is invalidated on a sustained move below 3.16. A stronger bearish shift begins only if price breaks and holds below 3.05.
Exit status levels:
For an active long position, partial exit is reasonable near 3.40. The main exit sits near 3.55. If price moves below 3.16, the bullish trade should be fully exited. A break below 3.05 fully invalidates the bullish idea and signals a deeper corrective structure.
Trading implication: Above 3.27, buyers regain control with targets at 3.40 and 3.55. Between 3.18–3.27, patience is preferred. Below 3.16, the long setup is canceled, and below 3.05, the market structure turns bearish.
Pivot / Resistance: 408.90
Downside targets: 399.36 → 393.69
Our preference:
Alternative scenario:
Scenario violation: The bearish scenario is invalidated if Tesla breaks and holds above 408.90. In that case, the setup shifts toward a bullish correction with targets at 412.00 and 415.00.
Technical notes: RSI is at 44, below the neutral 50 area, confirming weak momentum. MACD is positive but below its signal line, which supports the negative intraday configuration. Price is also below both the 20-period and 50-period moving averages, both around 406, reinforcing downside pressure.
Trading implication: As long as Tesla remains below 408.90, the bearish structure stays active toward 399.36 and 393.69. A confirmed move above 408.90 cancels the downside setup and opens the way toward 412.00/415.00.
Pivot / Resistance: 199.66
Main downside target: 189.11
Our preference:
Alternative scenario:
Scenario violation: The bearish scenario is invalidated if price breaks and holds above 199.66. A stronger bullish continuation would need confirmation from RSI breaking back above 50, opening the way toward 203.00 and 204.99.
Technical notes: RSI is below 50, showing weak momentum. MACD is positive and above its signal line, which creates a mixed setup. Price is above the 20-period moving average at 195.31 but below the 50-period moving average at 196.62, confirming a cautious, mixed structure.
Trading implication: While NVIDIA stays below 199.66, the downside scenario remains active toward 189.11. A confirmed move above 199.66, especially with RSI reclaiming 50, would cancel the bearish view and shift focus to 203.00/204.99.
Pivot: 1.4225
Signal tone: Bearish, but cautious due to mixed indicators
Our preference:
Alternative scenario:
Scenario violation: The bearish intraday scenario is invalidated if price breaks and holds above 1.4225. A stronger upside continuation would target 1.4240 and 1.4255.
Comment: Intraday technical indicators are mixed, so short positions below 1.4225 require caution and confirmation.
Trading implication: Below 1.4225, USD/CAD remains vulnerable to a move toward 1.4190 and 1.4175. However, a sustained break above 1.4225 cancels the bearish setup and shifts focus to 1.4240/1.4255.
Pivot: 162.00
Key resistance: 162.20
Our preference:
Alternative scenario:
Comment: As long as 162.20 resistance is not surpassed, USD/JPY remains under pressure, and the risk of a break below 161.50 stays high.
Trading implication: Holding below 162.00 keeps the bearish setup active toward 161.40 and 161.20. A break and hold above 162.20 would cancel the downside pressure and shift focus to 162.40/162.60.