translate English
 پارسی
English
Englishپارسی
English
Englishپارسی EnglishپارسیEnglishپارسی
Direction: Sell
Entry plan: The bearish setup is active if price rebounds weakly into the 7,520–7,528 resistance zone, or if price breaks below 7,507 on H1 and confirms downside follow-through.
Stop Loss: 7,552
Take Profit 1: 7,442
Take Profit 2: 7,367
Scenario violation: The bearish corrective scenario is invalidated if price posts an H1 close above 7,552. A stronger bullish continuation begins only if price breaks and holds above 7,552, with follow-through toward fresh highs.
Trading implication: As long as price stays below 7,552, rallies into 7,520–7,528 can be treated as potential sell zones. A break below 7,507 strengthens the bearish setup toward 7,442 and 7,367. However, an H1 close above 7,552 cancels the short idea and shifts focus back to bullish continuation.
Direction: Sell
Entry plan: The bearish setup is active if price breaks below 29,380 on H1, or if a weak rebound fails in the 29,420–29,470 resistance zone.
Scenario violation: The bearish scenario is invalidated if price posts an H1 close above 29,620. A stronger bullish correction starts only if price breaks and holds above 29,724.
Trading implication: Below 29,380, downside pressure can extend toward 29,220 and 29,120. A failed rebound under 29,420–29,470 also supports sell entries. However, an H1 close above 29,620 cancels the short setup, while a sustained break above 29,724 shifts the structure toward a stronger bullish correction.
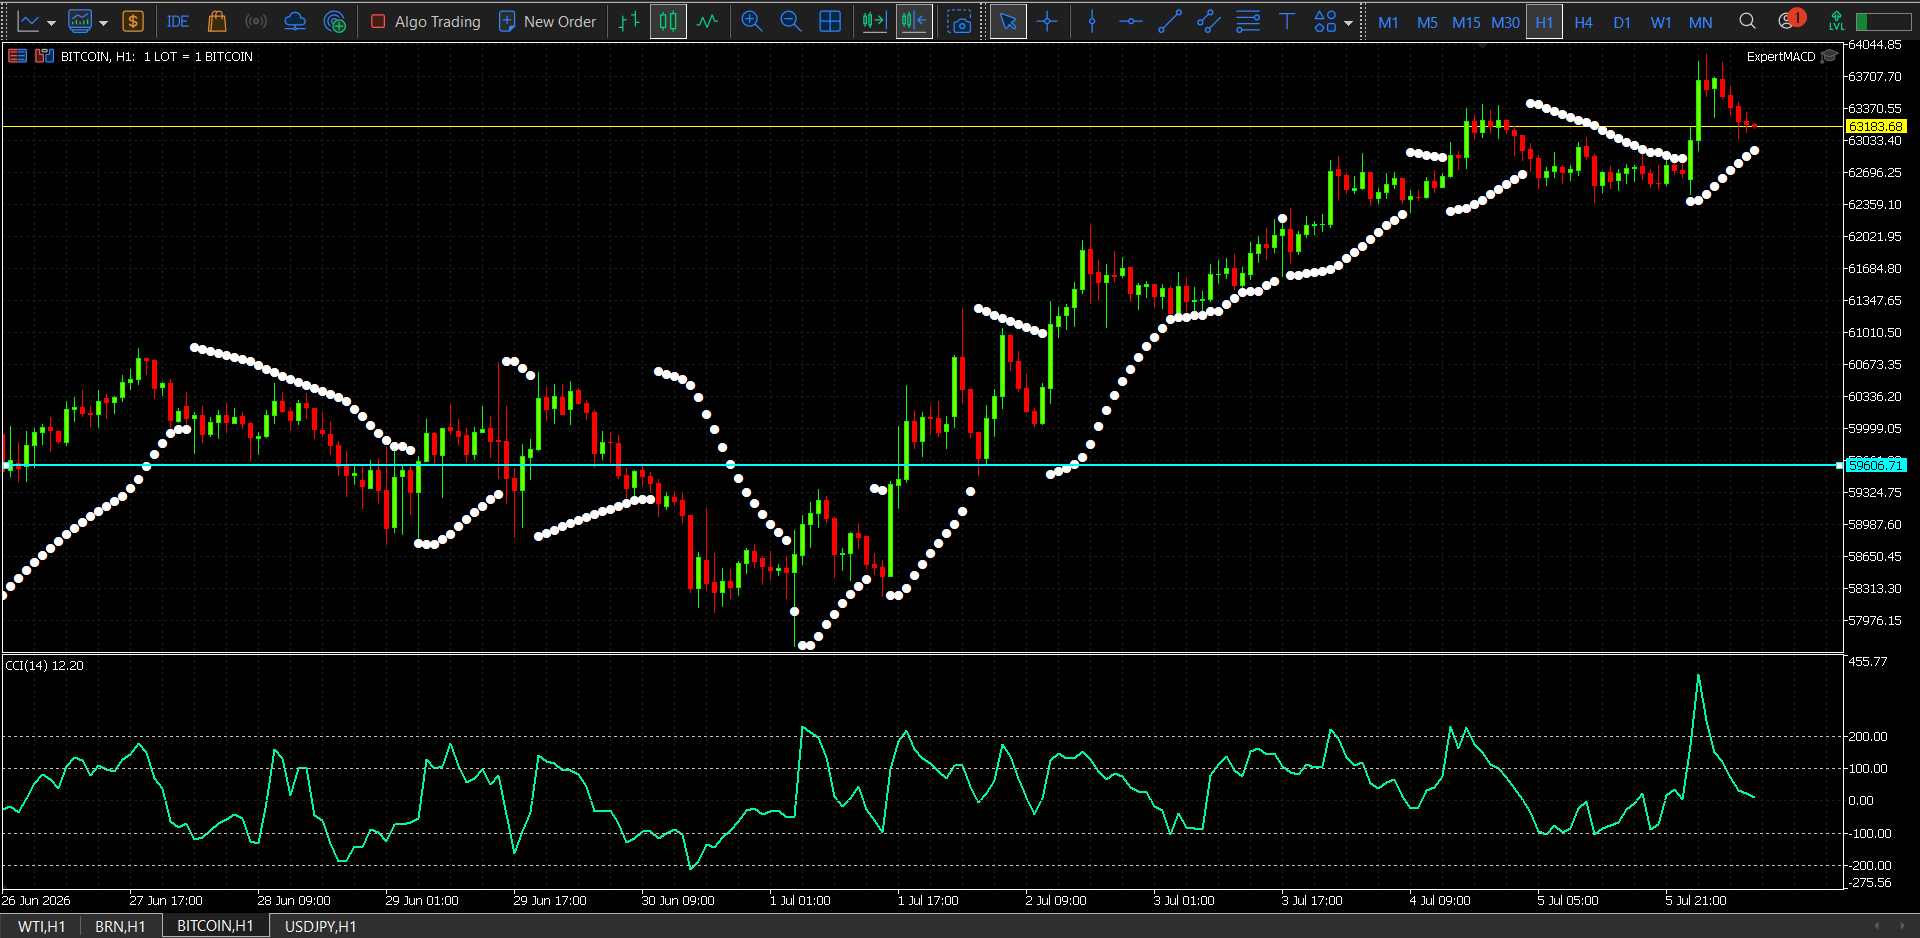
Entry: 63,150–63,250
Stop Loss: 63,480
Take Profit 1: 63,033
Take Profit 2: 62,700
Market Condition: Neutral to Mildly Bearish in the short term, constructive in the broader H1 structure
The BTC/USD H1 chart shows a market that is still technically stronger than it was at the start of July, but the latest candles point to a corrective pullback rather than a fresh impulsive breakout. Price is trading around 63,180, after failing to hold the spike toward the 64,000–64,045 area. The chart still reflects a strong recovery from the July 1 low zone near 58,000, but the immediate move has lost momentum under overhead resistance.
From a price-action perspective, the first support now sits around 63,033, followed by 62,696. A deeper pullback could expose 61,685 next. On the upside, the first resistance is the marked pivot near 63,184, followed by 63,370, with the more important breakout barrier still near 64,045. As long as price stays below 63,370–64,045, the latest recovery looks paused and vulnerable to another short-term downside test.
Momentum is not aggressively bearish, but it has clearly cooled. The CCI(14) is near 12.20, which places momentum in mildly positive but near-neutral territory rather than in a strong trend zone. In practical terms, the H1 chart is not broken structurally, but it is currently in a corrective phase after rejection from the recent high.
Scenario Violation
If price closes above 63,480, the bearish trade should be fully exited because the scenario is violated.
If price breaks above 64,045, the bearish view should be considered fully invalidated, and the chart shifts into a stronger bullish continuation structure.
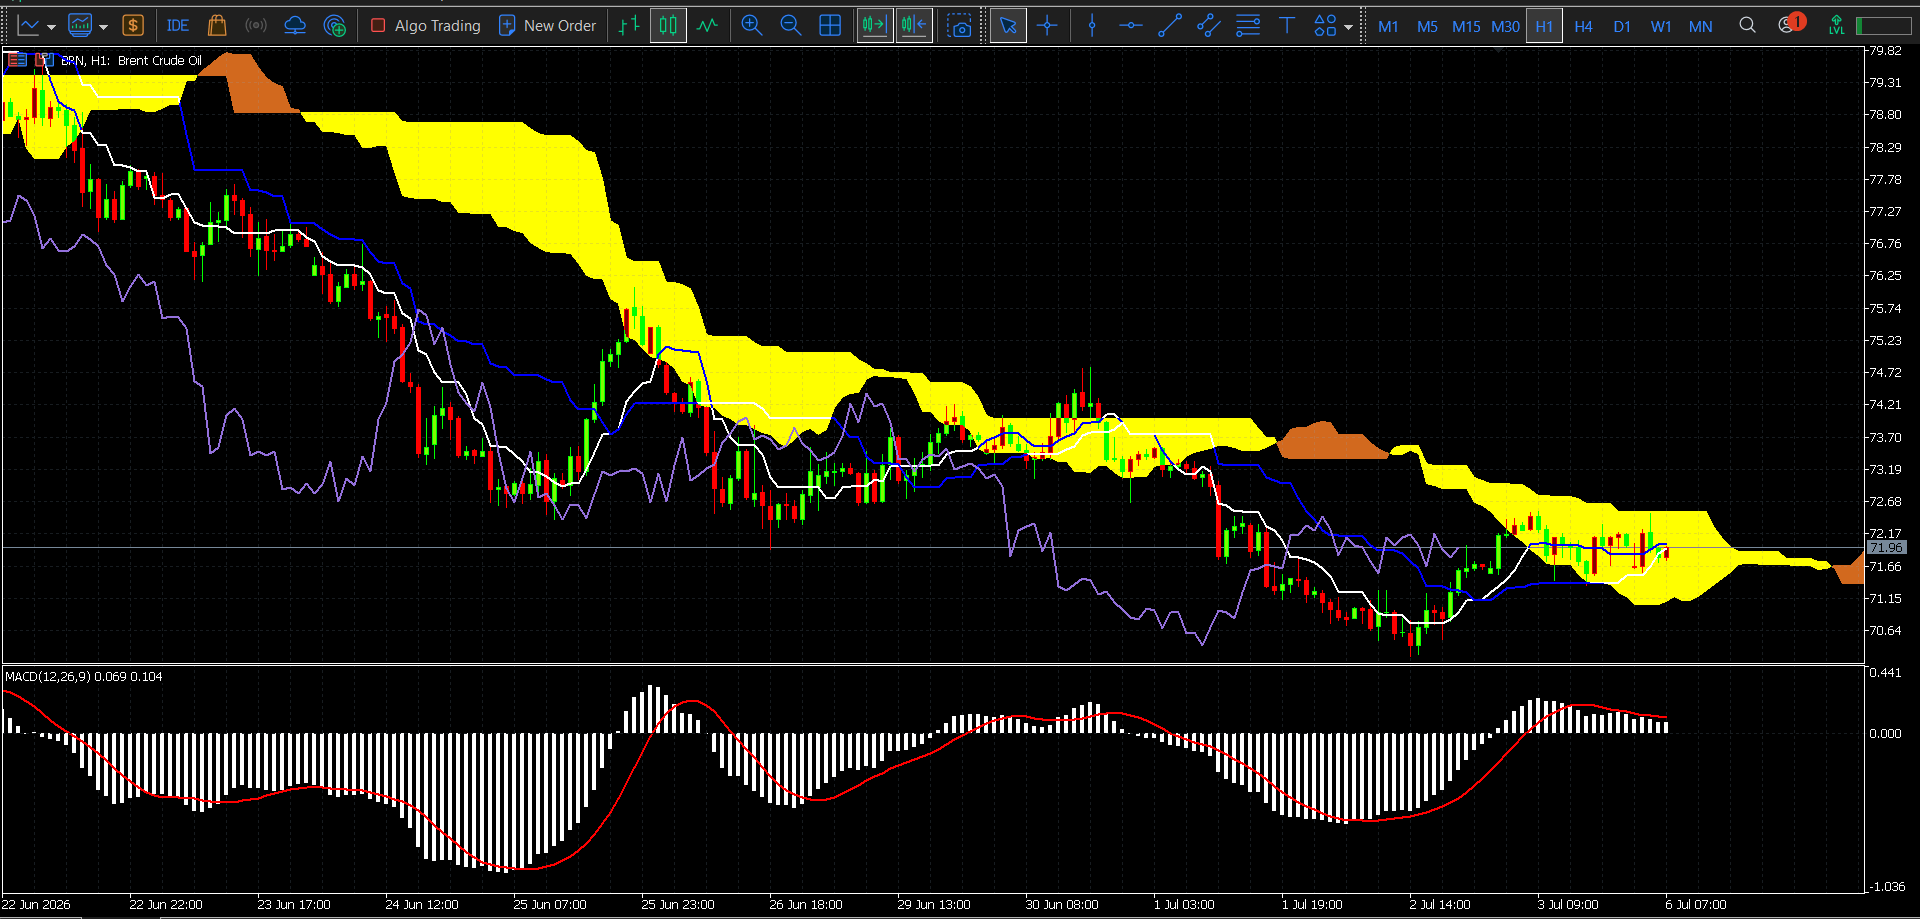
Entry: 71.60–71.70
Stop Loss: 72.22
Take Profit 1: 71.15
Take Profit 2: 70.65
Market Condition: Neutral to Mildly Bearish
The Brent Oil H1 chart shows a market that has stabilized after the late-June selloff, but the recovery still lacks strong confirmation. Price is trading around 71.66–71.96, while the structure remains capped under the overhead cloud resistance zone near 71.95–72.20. The recent candles are compressing rather than extending higher, which suggests hesitation rather than a clean bullish continuation.
Technically, the chart still carries a soft bearish bias because price is trading inside or just under the lower edge of the cloud, while the latest push higher has started to flatten. The first support comes in around 71.66, followed by 71.15, and then the deeper support zone near 70.65. On the upside, the first resistance stands at 71.95–72.00, followed by 72.20, with a stronger recovery barrier around 72.70. As long as Brent remains below 72.00–72.20, rebounds still look corrective rather than trend-changing.
Momentum is mixed. The MACD histogram remains slightly positive, but the bars are shrinking, and the MACD lines are beginning to roll over, which signals that upside momentum is fading. In practical terms, this is a market trying to hold a base, but not yet showing enough strength to confirm a sustained upside breakout.
Scenario Violation
If price closes above 72.22, the bearish trade should be fully exited because the scenario is violated.
If price breaks above 72.70, the bearish idea should be considered fully invalidated, and the chart would shift into a stronger bullish recovery structure.
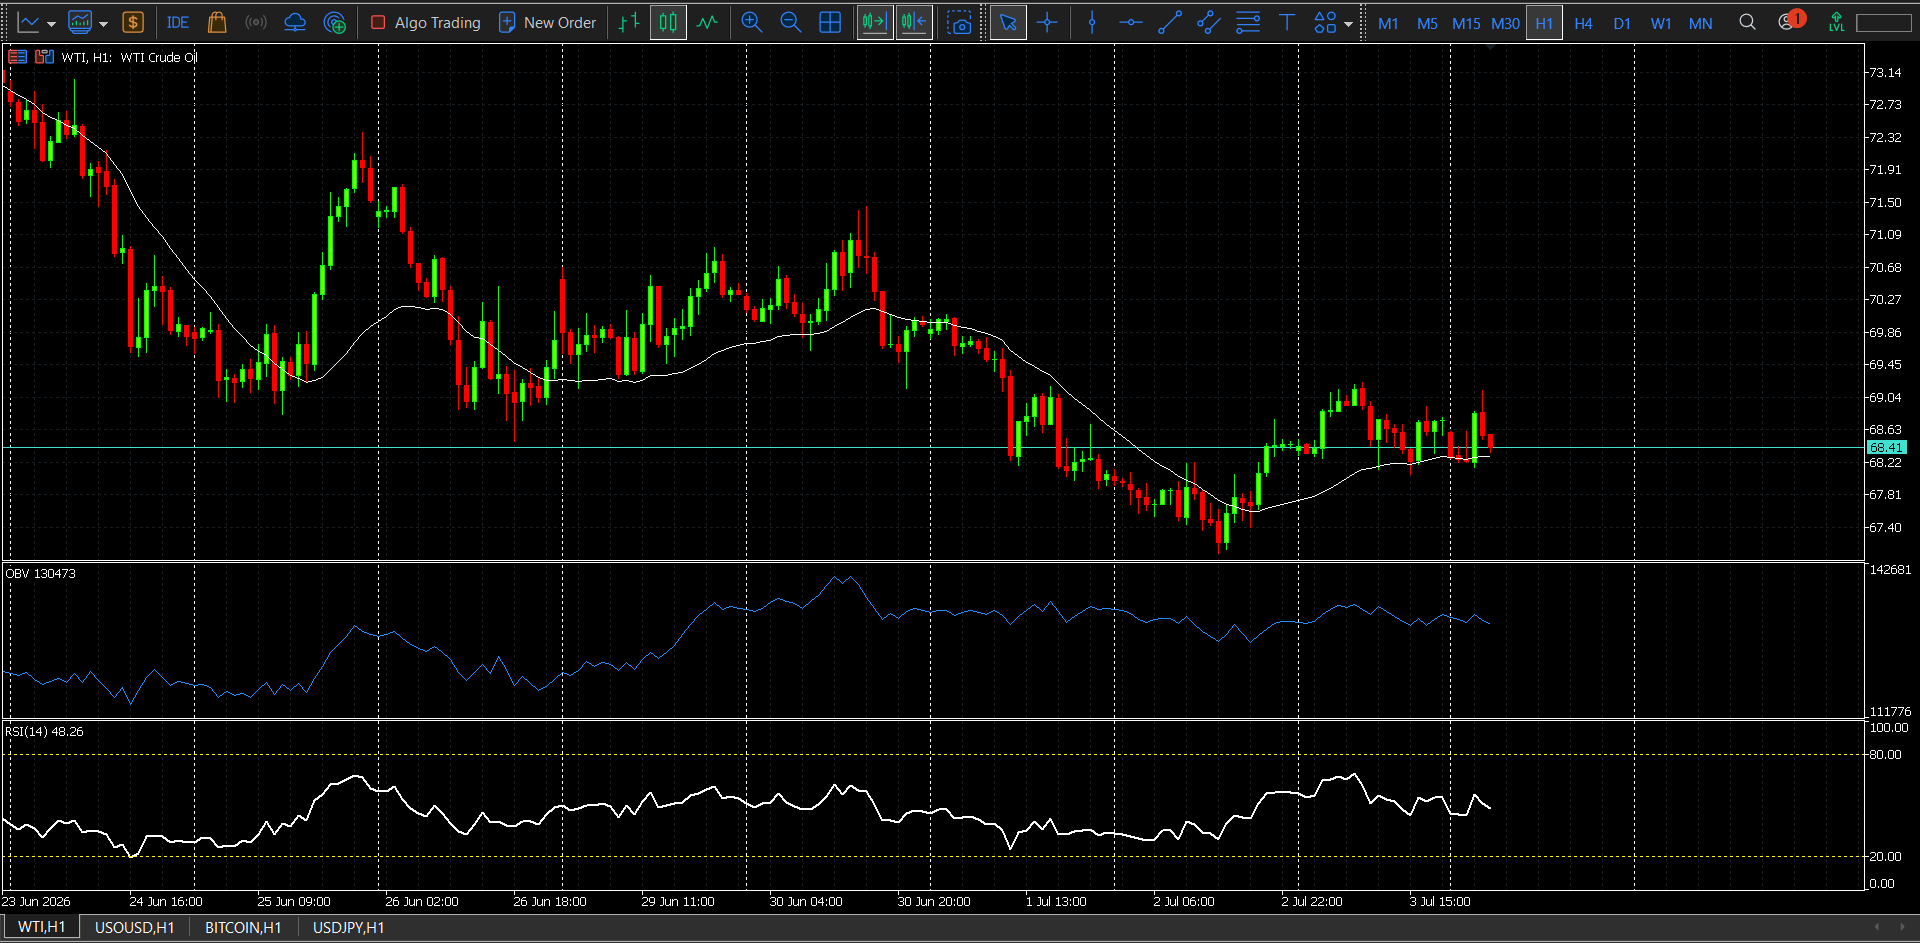
WTI on the H1 chart is trading around 68.41 and sitting directly on a key intraday pivot. The recent structure is no longer in a clean rebound phase. Price recovered from the 67.30–67.40 low zone, but repeated failures near 68.60–68.65 show that buyers are losing momentum. The short-term moving average is flattening around price, OBV is not confirming aggressive accumulation, and RSI(14) near 48.26 keeps the chart in a neutral-to-soft zone rather than a strong bullish one.
Technically, the market is now caught between a fragile support band and capped upside. The first support sits at 68.20, followed by 67.80, while the deeper bearish extension comes in at 67.35–67.40. On the upside, the first resistance remains 68.60–68.65, followed by 69.00–69.05. As long as WTI stays below 68.65, the chart favors a mild bearish bias, with rallies looking corrective rather than trend changing.
Scenario Violation:
If price closes above 68.78, the bearish trade should be fully exited because the scenario is violated.
If price breaks above 69.05, the bearish view should be considered fully invalidated, and the market shifts to a bullish recovery structure.
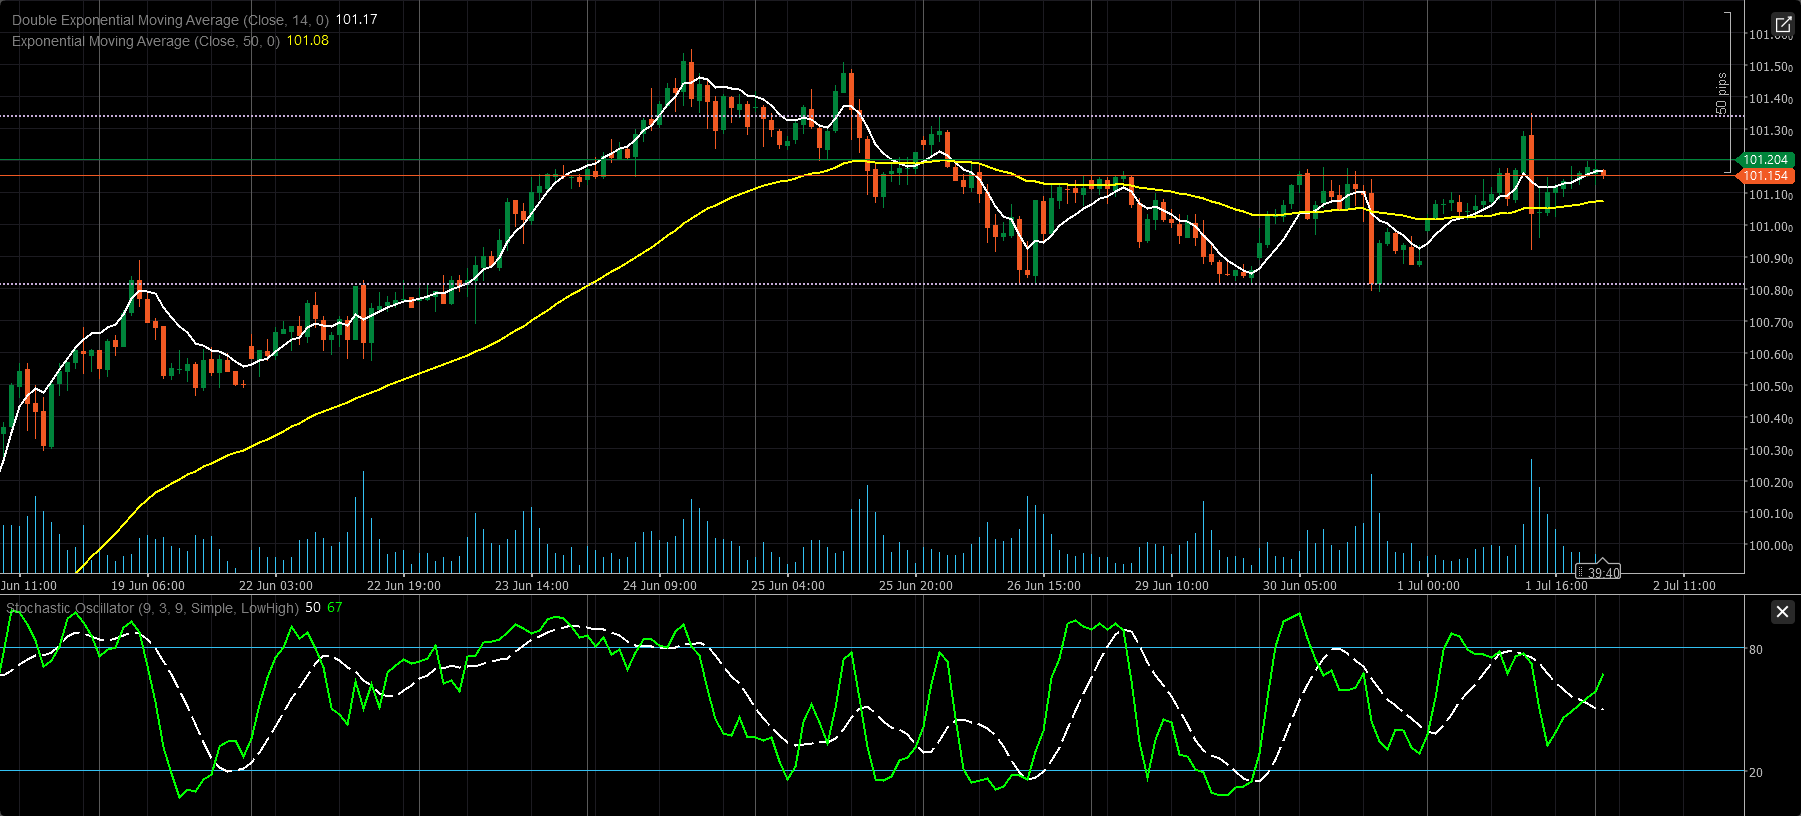
Dollar Holds Above the 50-EMA Base, but 101.20 Still Caps the Upside
Market Condition: Neutral to Buy
The USD Index H1 chart is showing a mildly constructive structure, but not a clean breakout yet. Price is trading around 101.154, with the DEMA 14 near 101.17 and the EMA 50 near 101.08. That keeps the index slightly supported above its short-term trend base, although price is still struggling to build distance above the immediate resistance band.
Technically, the first support sits at 101.08–101.00, which is the main intraday pivot area. Below that, the next support comes in around 100.85. On the upside, the first resistance is 101.20, followed by a stronger barrier near 101.35–101.40. As long as the index stays above 101.08, the structure remains constructive. But unless buyers clear 101.20 and then 101.35, this still looks more like consolidation than a full bullish continuation.
The momentum picture is mixed. Stochastic is around 50/67, which means the market is trying to recover, but the move is not strong enough yet to confirm a fresh impulsive rally. In practical terms, this is a chart where the dollar still has a slight intraday edge, but it needs a confirmed breakout to regain stronger upside momentum.
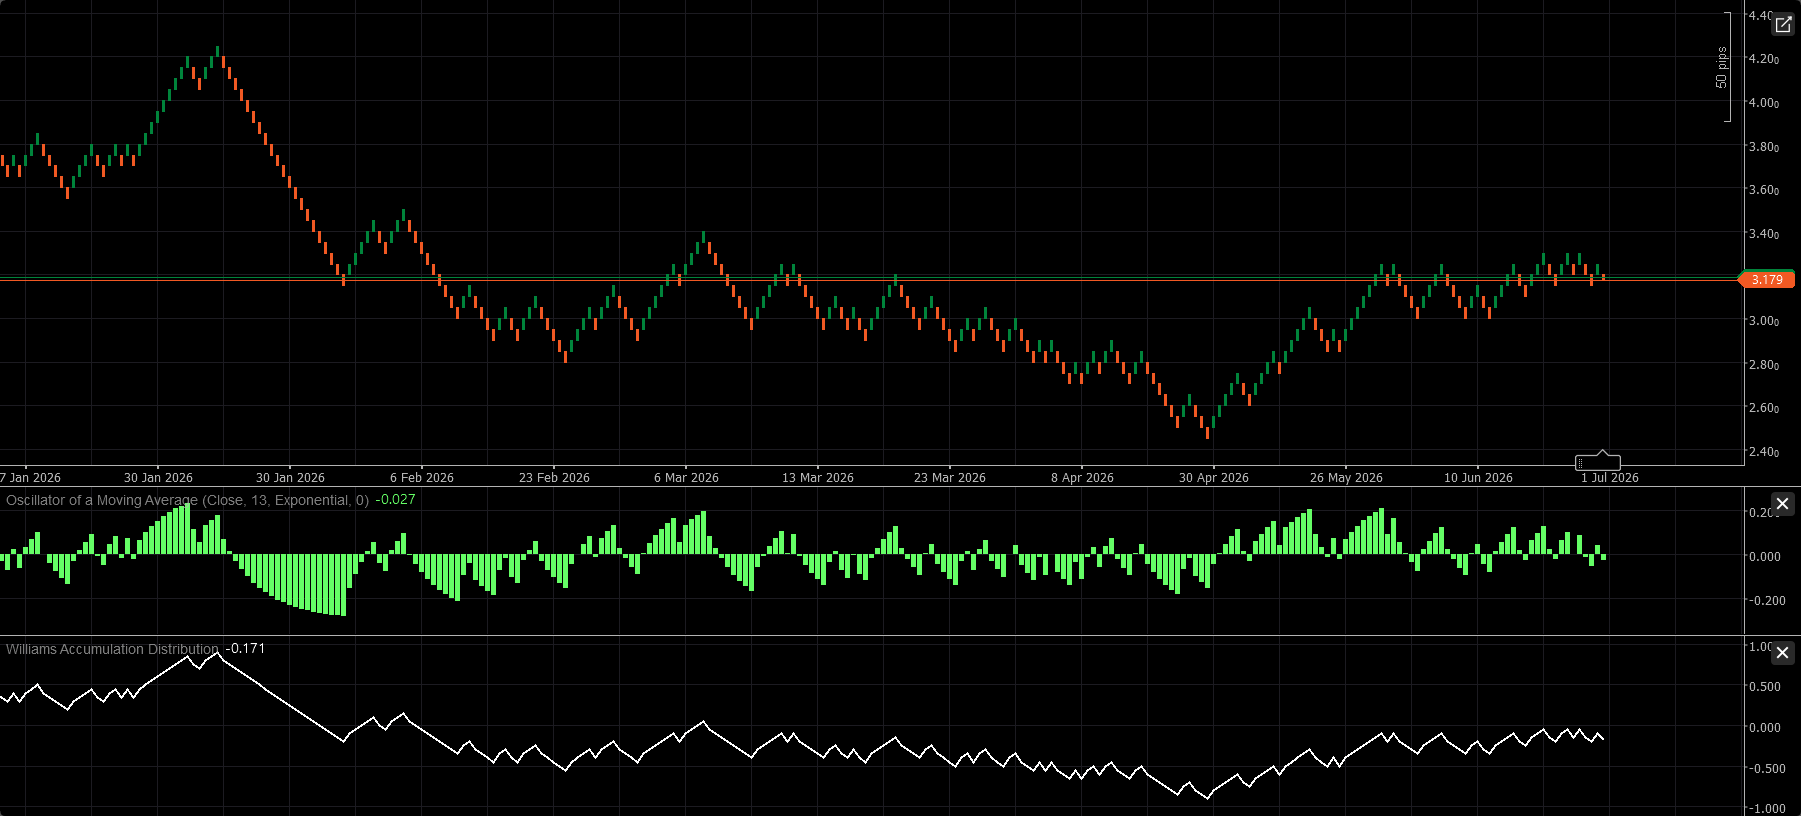
XNGUSD Renko Analysis: Natural Gas Pauses Near 3.18 as Momentum Softens Below Resistance
Market Condition: Neutral to Buy
The provided XNGUSD Renko 5 chart shows that natural gas is trading around 3.179, where the price is moving sideways after a solid recovery from the late-April low area. The broader short-term structure has improved compared with the earlier decline, but the market is now stalling just under an important resistance zone.
From a price-action perspective, the market has built a recovery leg from the 2.50–2.60 region toward the 3.18–3.20 area. However, the latest Renko bricks show that upside follow-through has slowed, and price is now consolidating rather than extending strongly higher. This puts the immediate focus on whether buyers can force a fresh breakout above the current ceiling.
The Oscillator of a Moving Average is slightly negative at around -0.027, which suggests that bullish momentum has cooled in the very short term. At the same time, the Williams Accumulation Distribution line has recovered significantly from the April weakness and is now relatively stable near -0.171, indicating that heavy selling pressure has eased, although strong accumulation is not yet fully confirmed.
Technically, the first resistance sits at 3.20, followed by 3.30 and then 3.40. On the downside, the nearest support is around 3.10, with deeper support at 3.00 and 2.80. As long as price stays above 3.10, the structure can still be viewed as a constructive consolidation. A break above 3.20–3.22 would strengthen the bullish case, while a move below 3.10 would shift the tone back toward a corrective decline.
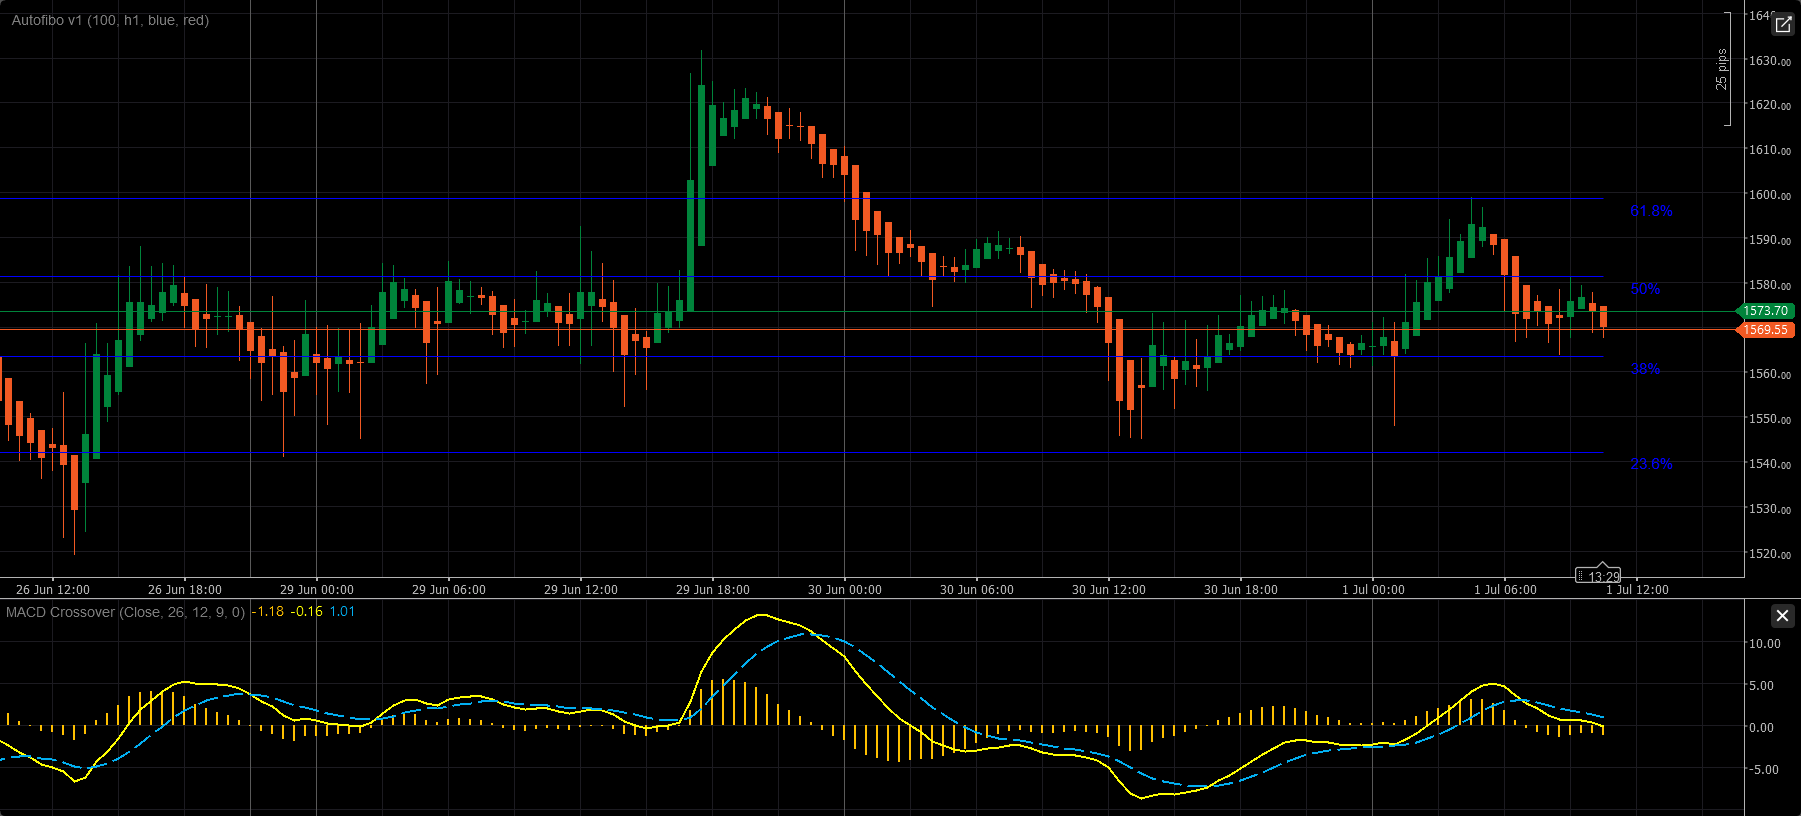
ETH/USD M30 Analysis: Ether Loses Momentum Below 1,580 as 1,563 Support Comes Into Focus
Market Condition: Sell / Intraday Bearish
ETH/USD 30-minute chart is showing a weakening short-term structure. Price is trading around 1,569.55, below the nearby recovery level at 1,573.70, while the chart is also struggling to regain the 50% Fibonacci area near 1,580. That keeps the immediate bias tilted to the downside rather than pointing to a fresh upside continuation.
From a price-action perspective, Ether has already rejected the higher retracement zone and is now slipping back toward the mid-lower part of the current range. The first support comes in around the 38.2% Fibonacci area near 1,563. If that zone breaks, the next downside level is near 1,540, which aligns with the 23.6% retracement. On the upside, the first resistance remains 1,573.70, followed by 1,580, and then the stronger recovery barrier near 1,600. As long as price stays below 1,580, rebounds still look corrective rather than trend-changing.
Momentum also supports a softer intraday tone. The MACD histogram has turned negative, and both MACD lines are rolling lower after the latest rebound attempt faded. That does not guarantee a sharp selloff by itself, but it does fit a market where buyers are losing short-term control.
Entry: 52,360
Stop Loss: 52,240
Take Profit 1: 52,480
Take Profit 2: 52,620
From a price-structure perspective, the first support sits in the 52,280–52,300 zone, where the 50-period EMA is acting as the main short-term base. As long as price remains above that area, buyers still have room to reassert control. On the upside, the first recovery barrier is 52,350, followed by 52,480–52,500. A clean push above that zone would reopen the path toward 52,620. On the downside, a break below 52,280 would weaken the bullish structure and expose 52,150 next.
Entry: 1.3248
Stop Loss: 1.3210
Take Profit 1: 1.3275
Take Profit 2: 1.3290
From a price-structure perspective, the first support sits in the 1.3215–1.3220 zone, which is where the two moving averages are clustered. As long as price remains above that base, the intraday bias stays constructive. The first resistance is the current 1.3245–1.3250 area, and if that zone gives way, the chart opens room toward 1.3275 and then the marked target area near 1.3290. On the downside, a break back below 1.3215 would weaken the recovery and expose 1.3195 next.
Entry: 4,042
Stop Loss: 4,056
Take Profit 1: 4,025
Take Profit 2: 4,000
From a price-action perspective, gold has failed to hold the earlier push into the 4,070–4,090 area and has rolled back toward the lower part of the channel. The first key support is now 4,025. A clean break below that level would expose 4,000 next, followed by 3,990. On the upside, the first resistance sits at 4,050, with a stronger recovery barrier in the 4,060–4,076 zone. As long as price stays below the channel midpoint, rebounds still look corrective rather than trend-changing.
Entry: 161.92
Stop Loss: 161.38
Take Profit 1: 162.20
Take Profit 2: 162.80
From a price-structure perspective, the pair is now pressing a very important resistance area around 161.88–162.00. A confirmed break above that zone would keep the bullish continuation in play and open the way toward 162.20 and then 162.80. On the downside, the first support sits near 161.40, followed by 161.00. A deeper pullback below 161.00 would weaken the immediate bullish setup and suggest the Renko advance is losing momentum.