 English
 پارسی


What Are Company Earnings Reports and How Can You Trade Them?
What Is an Earnings Report?
An earnings report is a periodic statement describing a company’s financial performance. Publicly traded companies generally publish earnings reports every quarter to inform shareholders and the market about revenue, expenses, profitability, cash flow, and the company’s business outlook.
An earnings report usually includes information from the three principal financial statements:
1. Income Statement
The income statement shows how much revenue the company generated, what expenses it incurred, and how much profit or loss it recorded during a specific period.
2. Balance Sheet
The balance sheet presents the company’s assets, liabilities, and shareholders’ equity at a particular point in time. This section is important for evaluating debt levels, liquidity, and overall financial strength.
3. Cash Flow Statement
The cash flow statement explains where cash entered the business and how it was used. A company may appear profitable on paper while producing weak cash flow, which is why assessing actual liquidity is essential. For U.S. companies, quarterly results are generally supplemented by a Form 10-Q, while annual results are reported through a Form 10-K. These filings provide more detailed information about financial performance, business operations, and corporate risks than the initial earnings announcement.
The Most Important Parts of an Earnings Report
Revenue
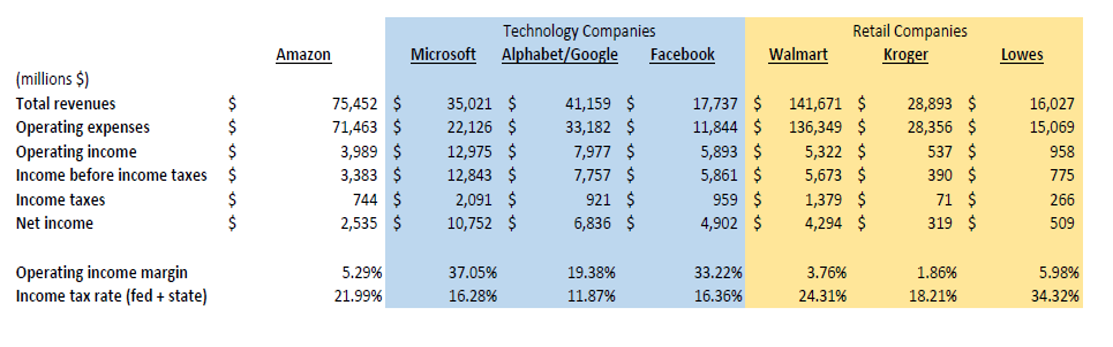
Revenue is the total amount of money a company generates from selling products or providing services. Revenue growth generally suggests that demand is increasing or that the company is gaining market share. However, revenue growth must be evaluated alongside expenses and profit margins. If revenue rises while costs increase even faster, the company’s profitability may weaken. When reviewing revenue, consider:
- Actual revenue compared with analysts’ forecasts;
- Revenue growth compared with the same period one year earlier;
- Changes compared with the previous quarter;
- Revenue contributions from individual products, regions, or business segments;
- The sustainability and quality of the company’s revenue sources.
Earnings Per Share
Earnings per share, or EPS, indicates how much of a company’s net profit is attributable to each outstanding common share.
A simplified EPS formula is:
EPS = Net Income ÷ Weighted Average Shares Outstanding
EPS is one of the most closely watched figures in an earnings report. Before the report is released, analysts usually publish a consensus EPS estimate. When reported EPS is higher than expected, the company is said to have delivered an EPS beat. When EPS is below the forecast, it is known as an EPS miss. Investors should also distinguish between reported EPS and adjusted EPS. Companies may exclude certain one-time or non-recurring expenses when calculating adjusted EPS.
Net Income
Net income is the company’s final profit after operating expenses, interest, taxes, and other costs have been deducted. Positive net income alone does not necessarily indicate high-quality performance. Investors should determine whether profit growth came from the company’s core business or from asset sales, temporary tax benefits, share buybacks, or other non-recurring factors.
Operating Income and EBIT
EBIT, or earnings before interest and taxes, measures the profitability of the company’s core operations without considering financing costs or taxes.
This measure can help investors compare companies with different debt structures or tax environments.
EBITDA
EBITDA represents earnings before interest, taxes, depreciation, and amortization.
It is commonly used to assess operating performance and compare companies within the same industry. However, EBITDA is not a substitute for cash flow and may not fully reflect capital spending requirements or other genuine business costs.
Profit Margins
Profit margins show what percentage of company revenue is converted into profit after different categories of costs are deducted. The most important margins include:
- Gross profit margin;
- Operating profit margin;
- Net profit margin.
Improving margins may indicate stronger pricing power, lower costs, or a more profitable product mix. Declining margins may result from higher raw-material costs, wages, transportation expenses, marketing spending, or greater competitive pressure.
Free Cash Flow
Free cash flow is the cash remaining after a company pays its operating expenses and capital expenditures.
Strong free cash flow allows a company to:
- Reduce debt;
- Pay dividends;
- Repurchase shares;
- Acquire other businesses;
- Or invest in new projects.
If accounting profit is rising while free cash flow is declining, the quality of the company’s earnings may require closer examination.
Debt and Liquidity
Debt levels are an important component of financial risk. High debt can place substantial pressure on a company during periods of rising interest rates, economic weakness, or falling revenue.
Important items to review include:
- Short-term and long-term debt;
- Interest expenses;
- Debt-to-equity ratio;
- Current ratio;
- Cash and short-term investments;
- Debt maturity schedules.
Dividends and Share Buybacks
An increase in dividends or the announcement of a share-repurchase program may indicate management’s confidence in future cash flow and business performance.
However, share buybacks are not always positive. If a company repurchases shares at excessively high valuations or borrows money to finance buybacks, it may reduce long-term shareholder value.
Why Is Company Guidance Important?
One of the most important parts of an earnings release is the company’s forward guidance. In this section, management presents expectations for future sales, earnings, expenses, profit margins, demand, and operating conditions. The stock market is more focused on the future than on the past. The latest earnings report explains what has already happened, while management guidance provides information about what may happen next. For this reason, a company may:
- Report revenue and EPS above expectations;
- Lower its sales forecast for the following quarter;
- And see its stock price fall after the report.
Conversely, a company may publish weak current results but receive a positive market reaction after issuing strong guidance for the next period. When evaluating guidance, consider:
- Projected revenue for the next quarter or full year;
- Expected EPS;
- Management’s margin expectations;
- Changes in customer demand;
- The impact of exchange rates, inflation, or tariffs;
- Supply-chain conditions;
- Planned capital expenditures;
- Hiring or workforce-reduction plans.
Management Discussion and the Earnings Call
Earnings reports are often accompanied by a Management Discussion and Analysis, or MD&A, section and a conference call with company executives.
During the earnings call, the chief executive officer, chief financial officer, and other senior managers explain the results and answer questions from analysts. Management’s tone may also provide useful information. Repeated references to “uncertainty,” “slowing demand,” “cost pressure,” or “near-term challenges” may indicate rising risk.
By contrast, comments about stronger orders, improving margins, customer growth, or expanding production capacity may support a more positive outlook. Nevertheless, investors should not rely only on optimistic management commentary. Executive statements should be compared with financial data, cash flow, and operating trends.
What Do Beat, Miss, and In Line Mean?
Earnings results are commonly classified into three categories:
- Beat
A beat occurs when the company’s actual result is better than analysts’ consensus estimate.
- Miss
A miss occurs when the company’s actual result is below market expectations.
- In Line
A result is considered in line when the actual figure is approximately equal to analysts’ expectations.
These comparisons are commonly made for revenue, EPS, and forward guidance.
Simplified Earnings Interpretation Matrix
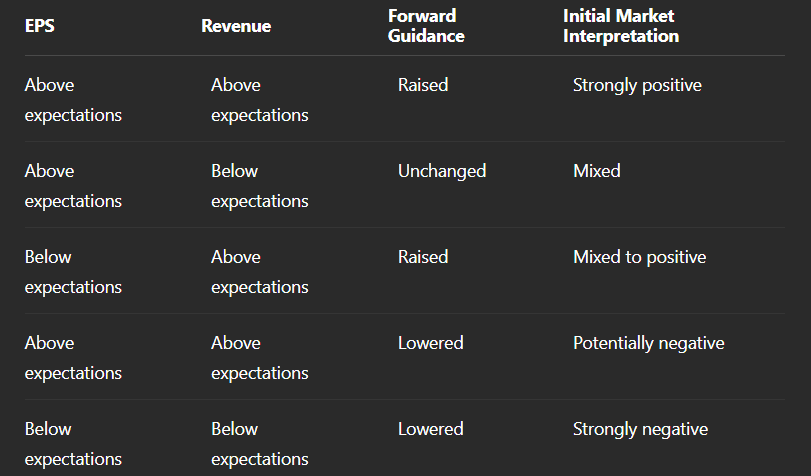
This table should only be used as an initial framework. The final price reaction also depends on the stock’s valuation, investor positioning, broader market conditions, and expectations that were already reflected in the share price.
Why Can a Stock Fall After a Good Earnings Report?
One of the most common questions among investors is why a company’s stock can decline after apparently strong results.
The main reasons include:
- The Results Were Already Priced In
If traders expected exceptionally strong results before the release, the stock may have already risen substantially. In this situation, even a good report may fail to meet the market’s elevated expectations.
- Forward Guidance Was Weak
Past results may have been positive, but management may have issued a weaker outlook for upcoming quarters.
- Earnings Quality Was Poor
Higher EPS may have resulted from a reduction in the number of outstanding shares, one-time income, or a temporary tax benefit rather than genuine growth in the core business.
- Profit Margins Declined
The company may have generated more sales while earning less profit from each unit of revenue because operating costs increased.
- Traders Took Profits
After a strong advance before the earnings release, some traders may sell immediately after the announcement to secure profits. This is often described as “buy the rumor, sell the news.”
How to Analyze a Company’s Earnings Report
- Step 1: Confirm the Release Date and Time
Check the exact date and time of the earnings release through the company’s official investor-relations website or a reliable earnings calendar. Determine whether the report will be published:
- Before the market opens;
- During trading hours;
- Or after the market closes.
The timing can affect liquidity, spreads, price gaps, and order execution.
- Step 2: Record Market Expectations
Before the report is released, note the consensus estimates for revenue and EPS.
Knowing the actual figure is not enough. You must understand what the market expected.
- Step 3: Compare the Headline Results
After the release, first examine:
- Actual EPS compared with expected EPS;
- Actual revenue compared with expected revenue;
- Year-over-year revenue growth;
- Year-over-year profit growth;
- Changes in profit margins;
- Free cash flow.
- Step 4: Review Business-Segment Performance
Identify which parts of the business improved and which weakened. Strong performance in one segment can sometimes conceal deterioration in another. For multinational companies, regional performance is also important. Sales may rise in one geographic market while falling in another.
- Step 5: Analyze Forward Guidance
Determine whether management:
- Raised its forecast;
- Lowered its forecast;
- Or maintained its previous outlook.
- Step 6: Examine Cash Flow and the Balance Sheet
Check whether earnings growth was accompanied by stronger cash flow. Also review changes in debt, inventories, accounts receivable, and cash holdings.
- Step 7: Follow the Earnings Call
Management commentary and answers to analysts’ questions may reverse or strengthen the market’s initial reaction.
- Step 8: Compare the Price Reaction with the Technical Structure
Even a strong report may fail to push the share price above a major long-term resistance level. Similarly, a weak report may attract buyers near an important support area.
Fundamental analysis of the report should therefore be combined with the price chart, trading volume, support, resistance, and the broader market trend.
How to Trade Earnings Reports
Trading around earnings releases involves significant volatility, price gaps, order slippage, and wider spreads. Traders therefore need a clearly defined strategy.
Strategy 1: Trading Before the Earnings Release
In this approach, the trader opens a position before the report based on expectations about the results.
This method carries very high risk because even a detailed analysis cannot reliably predict either the report or the market’s reaction.
The principal danger is a price gap. After the report, the stock may open far below the trader’s stop-loss level, causing a loss larger than originally planned.
This method is generally more suitable for traders who:
- Have a high tolerance for risk;
- Significantly reduce their position size;
- And accept the possibility of losing more than the intended stop-loss amount.
Strategy 2: Trading the Initial Reaction
In this method, the trader enters immediately after the earnings figures are released.
The main risk is that the initial reaction may be incomplete or misleading. Algorithms often process the headline numbers first, but the direction may reverse several minutes later when guidance is published or executives begin speaking.
Strategy 3: Waiting for Price Stabilization
For many traders, this is a more disciplined approach. The trader waits until:
- The initial volatility decreases;
- A trading range develops;
- Support or resistance levels become clearer;
- And the market direction receives confirmation.
A position may then be opened based on a breakout, retest, or continuation setup.
Strategy 4: Trading the Price Gap
After an earnings report, a stock may open with a significant bullish or bearish gap.
In this situation, traders should determine:
- Whether the gap formed with strong volume;
- Whether the price is holding above resistance or below support;
- Whether the move is continuing;
- Or whether the gap is being filled.
Not every gap is filled. Attempting to trade against a powerful earnings gap can produce substantial losses.
Strategy 5: Trading the Multi-Day Post-Earnings Trend
In many cases, the best opportunity does not appear immediately after the report. An earnings release can begin a new trend that continues for several days or weeks.
If the stock:
- Breaks above a major resistance level after the report;
- Shows an increase in trading volume;
- And holds above the breakout level during a retest;
A lower-risk opportunity may develop in the direction of the new trend.
The Role of Technical Analysis in Earnings Trades
Technical analysis cannot predict the contents of an earnings report, but it can help manage entries, exits, and risk.
Before the release, identify:
- Recent price highs and lows;
- Major support and resistance levels;
- Important moving averages;
- Previous price gaps;
- The upper and lower boundaries of the multi-month range;
- Volume concentrations near key price levels.
After the report, determine whether the stock has established itself above resistance or below support, or whether the initial movement has quickly reversed.
Earnings Pulse: Live Results & Market Reaction
Risk Management During Earnings Season
- Reduce Position Size
Earnings-related volatility can be several times greater than normal daily volatility. Using the same position size as an ordinary trade can sharply increase account risk.
- Do Not Rely Exclusively on a Standard Stop-Loss
When a gap occurs, a stop-loss order may be executed at a substantially worse price than expected.
- Avoid Excessive Leverage
The combination of high leverage and an earnings gap can produce severe losses.
- Do Not Make Decisions Based on One Number
Better-than-expected EPS does not necessarily mean the report is positive. Revenue, margins, cash flow, debt, and guidance must also be reviewed.
- Consider Broader Market Conditions
In a bearish market, a positive report may produce only a limited price increase. In a strong bull market, a relatively ordinary report may still attract buyers.
- Define the Risk Before Entering
Before opening a trade, determine:
- The maximum acceptable loss;
- The scenario-invalidation level;
- The first and second profit targets;
- And the conditions that would justify closing the position early.
Hypothetical Example of Earnings Analysis
Assume that a technology company reports the following results:
- Actual EPS: $2.20;
- Expected EPS: $2.00;
- Actual revenue: $15 billion;
- Expected revenue: $15.5 billion;
- Profit margin: Lower than one year earlier;
- Next-quarter sales guidance: Below market expectations.
At first glance, EPS exceeded expectations. However, weaker-than-expected revenue, declining margins, and soft guidance suggest that the overall quality of the report is not particularly strong.
If the stock had already risen substantially before the announcement, the probability of post-earnings selling would increase. In this situation, a trader should not automatically open a long position simply because EPS exceeded expectations.
Earnings Report Analysis Checklist
Before making a decision, answer the following questions:
- How did actual EPS compare with expectations?
- Was actual revenue above or below the forecast?
- How did revenue and profit change from one year earlier?
- Did profit margins improve or decline?
- What happened to free cash flow?
- How did debt and interest expenses change?
- Was forward guidance raised or lowered?
- Which business segments performed best?
- What risks did management discuss?
- How much had the stock risen or fallen before the report?
- Was the price reaction supported by strong volume?
- Where is the trading scenario invalidated?
Common Trading Mistakes
- Focusing Only on EPS
Earnings per share is only one part of the report. Revenue, profit margins, and future guidance may be more important.
- Buying After an Extreme Price Surge
Entering emotionally after a rapid increase can leave the trader trapped near a short-term price peak.
- Trading Against the Market Reaction
A trader may believe the report is positive while the market is selling the stock for other reasons. The final price reflects the collective judgment of market participants and should not be opposed without sufficient confirmation.
- Using an Oversized Position
Even a logically sound trade can generate a large loss because of extreme earnings volatility.
- Ignoring the Earnings Call
The initial reaction may be positive, but comments from the chief executive officer or chief financial officer can completely reverse the direction of the stock.
Conclusion
Earnings reports are among the most important sources of information for evaluating a company’s financial health, profitability, and prospects. Revenue, EPS, net income, EBIT, EBITDA, profit margins, cash flow, debt, and forward guidance each reveal a different part of the company’s overall condition. The central point is that markets move according to expectations. Good absolute results are not enough. The figures must be compared with analysts’ forecasts, investor expectations, and the stock’s existing valuation.
For traders, earnings reports can create substantial opportunities, but they also involve high volatility and price-gap risk. Reducing position size, avoiding excessive leverage, waiting for price stabilization, and combining fundamental analysis with technical structure can improve decision-making.
No earnings report should be analyzed using only one number. The strongest assessment comes from examining historical performance, earnings quality, future guidance, valuation, and the actual market reaction together.
Frequently Asked Questions
What is a company earnings report?
An earnings report is a periodic statement of a company’s financial performance. It provides information about revenue, expenses, profit, earnings per share, cash flow, and the company’s future outlook.
How often are earnings reports published?
Most publicly traded companies publish earnings reports quarterly, approximately once every three months. An annual report is also released after the end of the company’s fiscal year.
What is EPS?
EPS, or earnings per share, shows how much of a company’s net profit is attributable to each outstanding common share. It is calculated by dividing net income by the weighted average number of outstanding shares.
What is the difference between revenue and profit?
Revenue is the total amount generated from selling products or services. Profit is the amount that remains after expenses, taxes, interest, and other costs have been deducted.
Why can a stock fall after a positive earnings report?
The results may have failed to meet the market’s elevated expectations, management may have lowered forward guidance, profit margins may have declined, or traders may have taken profits after a prior rally.
What does an earnings beat mean?
An earnings beat occurs when a company’s actual revenue or EPS is higher than analysts’ consensus estimate.
What is an earnings miss?
An earnings miss occurs when a company’s actual revenue, profit, or another key metric is below market expectations.
What is forward guidance?
Forward guidance is management’s forecast for future revenue, earnings, expenses, and operating conditions. It often has a significant influence on the stock-price reaction.
Is trading before an earnings report advisable?
Trading before an earnings release carries high risk because a price gap may occur and a stop-loss order may be executed at a substantially worse price than expected. This strategy is not suitable for every trader.
When is the best time to trade after an earnings report?
For many traders, waiting for the initial volatility to decline and for support, resistance, or a consolidation range to form is less risky than entering immediately after the release.
Is better-than-expected EPS enough reason to buy a stock?
No. Revenue, profit margins, cash flow, debt, forward guidance, and the stock’s valuation must also be considered.
What is a Form 10-Q?
A Form 10-Q is a quarterly filing submitted by U.S. public companies. It provides detailed information about financial statements, operating performance, and business risks.
What is a Form 10-K?
A Form 10-K is a comprehensive annual filing submitted by U.S. public companies. It contains more extensive financial and operational information than a quarterly report.
Why is free cash flow important?
Free cash flow shows how much cash remains after operating expenses and capital expenditures. It can be used to reduce debt, invest in growth, pay dividends, or repurchase shares.
How can investors find the earnings release date?
The release date is usually available through the investor-relations section of the company’s official website, exchange earnings calendars, or reputable financial platforms.
Comments