 English
 پارسی


Gann Theory and Trading Strategies: A Practical Guide to Price, Time, and Market Angles
Gann Theory: How to Trade Price, Time, and Market Angles
Gann Theory is a technical-analysis methodology that studies the relationship between price, time, and geometric structure.
The method is traditionally associated with American trader and market theorist William Delbert Gann. Gann believed that market movements were not completely random and that price behavior could be evaluated through mathematical relationships, geometric angles, historical patterns, and recurring time cycles. Unlike conventional trendlines, which connect two or more price points, Gann angles project forward from a significant high or low at a predefined rate of price movement relative to time.
These angles are used to evaluate:
- Trend direction
- Trend strength
- Dynamic support and resistance
- Potential breakout points
- Possible reversal zones
- The relationship between price and elapsed time
Gann analysis should not, however, be treated as a guaranteed forecasting system. Its results are highly sensitive to chart scale, anchor-point selection, market volatility and timeframe. For this reason, Gann tools are generally more useful when combined with price action, volume, momentum indicators and disciplined risk management.
What Is Gann Theory?
Gann Theory attempts to forecast or interpret market behavior by analyzing three fundamental dimensions:
- Price
- Time
- Pattern
According to the theory, a meaningful market movement can be better understood when these three elements are evaluated together.
A price level may be technically important, but its importance may increase when the market reaches that level during a significant time cycle or near a major Gann angle.
The approach therefore asks more than whether price is rising or falling. It examines:
- How far price has moved
- How long the movement has continued
- Whether the movement follows a recognizable geometric structure
- Whether the current pattern resembles previous market behavior
- Whether price and time are approaching a potential balance point
The Three Main Components of Gann Analysis
1. Price Analysis
Price analysis identifies significant highs, lows, breakout levels, support zones, and resistance zones.
Gann traders often begin with an important market turning point and project angles or geometric structures from that location.
Relevant price points may include:
- A major historical low
- A major historical high
- A confirmed swing low
- A confirmed swing high
- The beginning of a strong trend
- A breakout from a long consolidation
The quality of the anchor point can materially affect the usefulness of the entire analysis.
2. Time Analysis
Time analysis studies how long a market movement, correction, or consolidation has continued.
Gann-based traders may monitor:
- The number of trading days in a move
- The duration of the previous correction
- Repeating weekly or monthly cycles
- Anniversary dates of major highs or lows
- Ratios between trending and corrective periods
- Periods in which price and time appear balanced
The underlying idea is that markets may become vulnerable to acceleration or reversal after completing a significant time interval. A time cycle does not determine whether the market must rise or fall. It identifies a period in which traders should watch more closely for confirmation of a change.
3. Pattern Analysis
Pattern analysis examines recurring market structures and investor behavior.
Gann traders may evaluate:
- Double tops
- Double bottoms
- Triple tops
- Triple bottoms
- Consolidation ranges
- Trend continuation patterns
- Breakouts from multiweek highs or lows
- Expanding corrections
- Changes in price and time symmetry
Patterns are generally more useful when confirmed by trend structure, volume, momentum, or a significant Gann level.
What Are Gann Angles?
Gann angles are diagonal lines projected from a major high or low. Each angle represents a particular relationship between units of price and units of time.
The best-known Gann angle is the 1×1 angle.
A 1×1 angle represents one unit of price movement for every one unit of time. It is traditionally described as a 45-degree angle, but this description is accurate only when the chart is scaled so that one price unit and one time unit are visually equal. This scaling issue is extremely important. On a charting platform, changing the vertical scale, horizontal zoom, or price unit can change the apparent angle of the line. Therefore, a visually drawn 45-degree line is not automatically a valid 1×1 Gann angle. The angle must be based on a defined price-to-time ratio.
Common Gann Angles
The most frequently used Gann angles include:
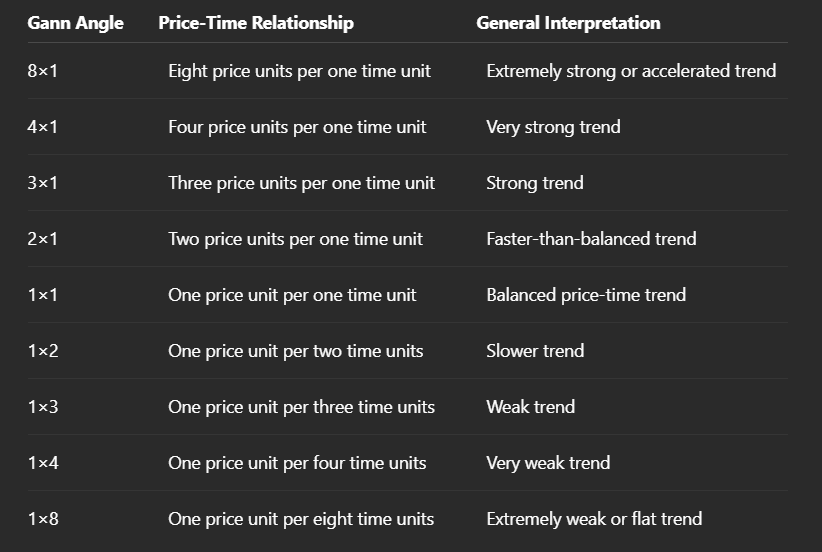
When projected upward from a major low, these angles may act as dynamic support.
When projected downward from a major high, they may act as dynamic resistance.
Understanding the 1×1 Gann Angle
The 1×1 angle is the central reference line in many Gann systems. When price remains above a rising 1×1 angle, the market is generally considered to have a constructive or bullish structure. When price breaks below a rising 1×1 angle, the trend may be losing strength, and price may move toward the next lower Gann angle.
Similarly:
- Price below a descending 1×1 angle suggests bearish control.
- A breakout above a descending 1×1 angle may indicate weakening bearish momentum.
- Repeated reactions around the 1×1 angle can confirm its importance.
- A brief intraday breach is less meaningful than a confirmed close accompanied by follow-through.
The 1×1 angle should not be treated as an automatic entry signal. It is better understood as a dynamic structural reference.
What Is a Gann Fan?
A Gann Fan is a group of Gann angles projected from one significant market high or low.
The fan visually divides the chart into zones of different trend strength.
A bullish Gann Fan is normally projected upward from a major low. A bearish Gann Fan is normally projected downward from a major high.
The primary lines commonly include:
- 1×8
- 1×4
- 1×3
- 1×2
- 1×1
- 2×1
- 3×1
- 4×1
- 8×1
As price moves from one angle to another, traders may interpret the transition as a change in market momentum. For example, if price breaks below a rising 1×1 angle, the next slower angle—such as 1×2—may become the next potential support zone. If price breaks above a descending 1×1 angle, the next higher angle may become a potential target or resistance zone.
How to Draw a Gann Fan Correctly
Step 1: Select an Important High or Low
Choose a structurally important turning point rather than a minor intraday fluctuation.
A suitable anchor may be:
- The lowest point before a major rally
- The highest point before a major decline
- A long-term swing high or low
- A confirmed breakout origin
- A major reversal supported by volume
Step 2: Choose the Correct Timeframe
The anchor and strategy should match the trading horizon.
- Long-term investors may use weekly or monthly charts.
- Swing traders may use daily or four-hour charts.
- Intraday traders may use hourly or shorter charts.
Angles drawn on a higher timeframe generally carry more structural significance than those drawn on a very short timeframe.
Step 3: Define the Price-Time Scale
The selected ratio should make economic and technical sense for the instrument. For example, one price unit could represent:
- One dollar
- Ten index points
- One percentage point
- One average daily range
- Another standardized price increment
The same numerical scale will not be suitable for every market. A $1 movement has a very different meaning for a $10 stock, a $500 stock, Bitcoin, gold, or a stock index.
Step 4: Project the Fan
Project the Gann Fan from the selected anchor in the direction of the trend.
Step 5: Wait for Price Confirmation
Observe whether price:
- Respects an angle
- Closes beyond an angle
- Retests the broken angle
- Forms a reversal candle
- Shows increasing or declining volume
- Confirms the move with momentum
A Gann line becomes more meaningful when actual price behavior repeatedly reacts around it.
Gann Angles as Support and Resistance
One of the most practical uses of Gann angles is identifying dynamic support and resistance. In an uptrend:
- Rising angles may function as support.
- A steeper angle indicates stronger upward momentum.
- A break below a steep angle may move price toward a slower angle.
- Several reactions around one angle strengthen its technical relevance.
In a downtrend:
- Descending angles may function as resistance.
- Price rejection from an angle can confirm bearish control.
- A breakout above an important descending angle may signal a change in momentum.
- The next angle can become a potential target.
The process is similar to trendline analysis, but Gann angles add a predefined rate of price movement relative to time.
Gann Theory and Trend Strength
Gann angles can help classify trend strength.
Strong Bullish Structure
A bullish structure is stronger when:
- Price remains above the rising 1×1 angle.
- Pullbacks hold above faster angles.
- Higher highs and higher lows continue.
- Breakouts are supported by volume.
- Momentum indicators remain constructive.
Weakening Bullish Structure
The trend may be weakening when:
- Price breaks below the 1×1 angle.
- A former support angle becomes resistance.
- Corrections become longer and deeper.
- Price forms a lower high.
- Momentum diverges negatively.
Strong Bearish Structure
A bearish structure is stronger when:
- Price remains below a descending 1×1 angle.
- Rallies fail near faster descending angles.
- Lower highs and lower lows continue.
- Downside breakouts receive volume confirmation.
Weakening Bearish Structure
Bearish pressure may be weakening when:
- Price breaks above a descending 1×1 angle.
- A former resistance angle becomes support.
- The latest decline is shorter or weaker.
- Price forms a higher low.
- Momentum develops positive divergence.
Traditional Gann Market Rules
Several market observations are traditionally attributed to Gann-based trading. These rules should be considered historical heuristics rather than universal laws. Their usefulness can vary considerably between instruments, timeframes, and market regimes.
Weekly Timing Rules
Traditional observations include:
- A weekly high formed on Friday may be followed by higher prices during the next week.
- A weekly low formed on Friday may be followed by lower prices during the next week.
- In some bullish weeks, the weekly low may occur near Tuesday.
- During a strong primary downtrend, the weekly high may occur near Wednesday.
These day-of-week rules require independent testing. Changes in electronic trading, global liquidity, and 24-hour markets may reduce their reliability.
Breakout Rules
Common Gann-style breakout observations include:
- A break above the previous four-week high may support further upside.
- A break below the previous four-week low may support further downside.
- A break above the previous three-day high may signal stronger prices on the following day.
- A break below the previous three-day low may signal further weakness.
These principles resemble modern trend-following and breakout systems.
Moving-Average Rule
A traditional rule states that when price in an uptrend breaks below its 30-day moving average and remains below it for at least two consecutive sessions, the market may be entering a deeper correction. The inverse can be applied during a downtrend. The moving-average break becomes more relevant when it is accompanied by:
- A break in market structure
- Higher volume
- Weak momentum
- A close below a Gann angle
- Failure to recover the moving average
Time-Ratio Rules
- Some Gann-based observations compare the duration of directional moves and corrections. Examples include:
- After five consecutive rising sessions, a three-session correction may become more likely.
- After nine consecutive rising sessions, a five-session correction may become more likely.
- Ratios such as 5:3 and 9:5 may be monitored as possible time relationships.
These ratios are not deterministic forecasts. They identify periods in which traders may watch for a behavior change.
Correction and Trend-Change Rule
A correction may indicate a more meaningful trend change when it becomes both:
- Larger in price than the preceding correction
- Longer in time than the preceding correction
This is one of the more practical principles in Gann analysis because it evaluates deterioration in both price structure and time structure.
Long-Term Pattern Rules
Traditional Gann analysis may also monitor:
- Double bottoms
- Triple bottoms
- Double tops
- Triple tops
- Breakouts from three-month highs or lows
- Volume expansion during consolidation
A major breakout from a quarterly range may provide an early indication of a structural trend change, especially when supported by volume and broader market confirmation.
A Practical Gann Trend-Continuation Strategy
Bullish Setup
A possible bullish Gann strategy may require:
- A confirmed market uptrend
- A Gann Fan drawn from a major swing low
- Price holding above the rising 1×1 or 1×2 angle
- A pullback toward the relevant angle
- A bullish reversal candle or market-structure break
- Momentum or volume confirmation
Entry
Enter after price confirms support and closes above the reversal trigger.
Stop-Loss
The stop can be placed:
- Below the recent swing low
- Below the supporting Gann angle
- Below the invalidation candle
- At a volatility-adjusted distance
Profit Targets
Targets may include:
- The previous swing high
- The next Gann angle
- A measured price objective
- A major horizontal resistance level
- A predetermined risk-to-reward ratio
Scenario Violation
The bullish scenario may be invalidated when:
- Price closes decisively below the supporting angle.
- The latest swing low is broken.
- The retest of the broken angle fails.
- Market structure changes from higher highs and higher lows to lower highs and lower lows.
A Practical Gann Bearish Strategy
Bearish Setup
A possible bearish strategy may require:
- A confirmed downtrend
- A Gann Fan projected from a major swing high
- Price remaining below the descending 1×1 or 1×2 angle
- A rally toward the relevant angle
- Bearish rejection or a lower-high formation
- Momentum or volume confirmation
Entry
Enter after price confirms rejection and breaks below the relevant trigger level.
Stop-Loss
The stop may be placed:
- Above the recent swing high
- Above the resisting Gann angle
- Above the rejection candle
- At a volatility-adjusted distance
Profit Targets
Possible targets include:
- The previous market low
- The next descending angle
- A major horizontal support level
- A measured price objective
- A predefined risk-to-reward target
Scenario Violation
The bearish scenario may be invalidated when:
- Price closes decisively above the resistance angle.
- The latest lower high is broken.
- The broken angle holds as support.
- Market structure shifts to higher highs and higher lows.
Gann Breakout Strategy
A breakout strategy can combine Gann angles with horizontal market structure.
Bullish Breakout Conditions
- Price is testing a significant resistance level.
- A descending Gann angle is limiting the advance.
- Volume increases during the breakout.
- Price closes above both horizontal resistance and the Gann angle.
- The breakout level holds during a retest.
Bearish Breakout Conditions
- Price is testing important support.
- A rising Gann angle is supporting the market.
- Selling volume increases.
- Price closes below both horizontal support and the angle.
- The broken level becomes resistance during a retest.
A breakout should not be traded merely because price briefly crosses a line. Closing confirmation and follow-through are important.
Gann Reversal Strategy
Gann analysis can also be used to identify potential reversal periods. A higher-quality reversal setup may combine:
- A significant Gann angle
- A major horizontal support or resistance level
- Completion of an important time cycle
- RSI or momentum divergence
- A reversal candlestick pattern
- Abnormal volume
- A break in short-term market structure
The time cycle identifies when a reversal may become more likely. Price action determines whether the reversal is actually occurring.
Combining Gann Theory With Other Indicators
Gann tools are usually more effective when combined with independent confirmation.
Moving Averages
Moving averages can confirm the broader trend. For example:
- Price above a rising 50-day moving average supports a bullish Gann setup.
- Price below a falling 50-day moving average supports a bearish Gann setup.
Relative Strength Index
RSI can identify momentum conditions and divergences. A bullish reversal near a rising Gann angle becomes more meaningful when RSI forms a positive divergence.
Volume
Volume can help distinguish genuine breakouts from false breaks. A breakout through a Gann angle accompanied by increasing volume has stronger confirmation than a low-volume crossing.
Average True Range
ATR can help determine:
- Stop-loss distance
- Position size
- Whether a breakout is sufficiently large
- Whether volatility is expanding or contracting
Horizontal Support and Resistance
The strongest zones often occur when a Gann angle overlaps with a major horizontal level. This creates confluence between geometric structure and observed market behavior.
Multi-Timeframe Gann Analysis
A practical approach is to use several timeframes.
Higher Timeframe
Use the weekly or daily chart to identify:
- Primary trend
- Major swing points
- Structural Gann angles
- Long-term support and resistance
- Major time cycles
Trading Timeframe
Use the four-hour or one-hour chart to identify:
- Pullbacks
- Breakouts
- Retests
- Entry triggers
- Scenario invalidation
Lower Timeframe
Use a lower timeframe only when necessary to refine execution. The lower timeframe should not override the direction and structure of the higher timeframe without strong evidence.
Risk Management for Gann Trading
No Gann angle or cycle can guarantee a market outcome.
Risk management should therefore define the maximum acceptable loss before entry.
Position Sizing
Position size should be based on:
- Account size
- Stop-loss distance
- Maximum percentage risk
- Market volatility
- Correlation with existing positions
Stop-Loss Placement
A stop should be placed where the original trading thesis is no longer valid, not at an arbitrary distance.
Risk-to-Reward Ratio
Before entry, determine whether the potential reward justifies the risk. A visually attractive Gann setup may still be unsuitable when the next resistance or support level is too close.
Avoid Excessive Leverage
Because Gann angles can generate false breakouts, excessive leverage may turn a normal analytical error into a major account loss.
Monitor Economic Events
Gann geometry cannot reliably protect a position from unexpected central-bank decisions, geopolitical shocks, earnings announcements, or sudden liquidity events. The economic calendar and market context should always be reviewed.
Common Mistakes When Using Gann Theory
- 1. Assuming Every 45-Degree Line Is a 1×1 Angle
A valid 1×1 angle depends on the chart’s price-time scale.
- 2. Choosing Arbitrary Anchor Points
Angles drawn from insignificant highs or lows often produce unreliable signals.
- 3. Changing the Chart Scale After Drawing
Changing chart scale may distort the visual meaning of the angle.
- 4. Using Gann Theory Alone
Gann levels should be confirmed by actual price behavior.
- 5. Treating a Time Cycle as a Directional Signal
A time cycle indicates when a change may occur, not whether price must rise or fall.
- 6. Ignoring Market Volatility
The same price-time ratio cannot be applied identically to every instrument.
- 7. Overfitting the Chart
Drawing many fans from numerous points can create a line near almost every price movement.
- 8. Entering Before Confirmation
Price can temporarily cross an angle and then return to the previous structure.
- 9. Ignoring Fundamental Catalysts
Major news can invalidate even a well-constructed technical setup.
- 10. Failing to Define Scenario Violation
Every trade should specify the condition that proves the original analysis wrong.
Advantages of Gann Theory
Potential advantages include:
- Integrating price and time
- Providing dynamic support and resistance
- Helping evaluate trend strength
- Supporting multi-timeframe analysis
- Identifying possible reversal periods
- Combining effectively with price action
- Creating objective scenario-invalidation levels
Limitations of Gann Theory
Important limitations include:
- Sensitivity to chart scaling
- Dependence on anchor selection
- Subjectivity in selecting cycles
- Potential inconsistency across markets
- False breakouts
- Limited value without confirmation
- Risk of overfitting
- Difficulty in standardizing price units
- No guarantee that historical relationships will repeat
Related Gann Tools
The Gann Fan is only one part of the wider Gann analytical framework.
Other tools commonly associated with Gann methodology include:
- Gann Grid
- Gann Box
- Square of Nine
- Price squares
- Time squares
- Seasonal and anniversary cycles
- Percentage retracement levels
These tools attempt to organize price and time into structured mathematical relationships. However, each requires consistent rules and independent testing before it is included in a trading system.
Practical Gann Trading Checklist
Before entering a Gann-based trade, confirm that:
- A meaningful anchor point has been selected.
- The chart scale is appropriate.
- The primary trend is clear.
- The relevant Gann angle has produced visible price reactions.
- Horizontal support or resistance supports the analysis.
- Volume or momentum confirms the setup.
- The entry trigger is clearly defined.
- The stop-loss reflects scenario invalidation.
- The expected reward justifies the risk.
- Major economic events have been reviewed.
- Position size is consistent with account risk.
- The setup has been tested on the relevant instrument and timeframe.
Conclusion
Gann Theory offers a distinctive approach to technical analysis by combining price, time, and geometric structure. Its most recognizable tools—Gann angles and Gann Fans—can help traders evaluate trend strength, dynamic support and resistance, breakout conditions and possible reversal periods. The 1×1 angle plays a central role by representing a balanced relationship between price and time. Faster and slower angles can then be used to evaluate acceleration, deceleration and changes in market momentum.
However, Gann Theory is not a mechanical prediction machine. Its effectiveness depends on correct chart scaling, meaningful anchor points, confirmation from actual price behavior, and disciplined risk management. The most practical use of Gann analysis is not attempting to predict every market turn. It is constructing structured scenarios:
- Where is the current trend supported?
- Which angle or price level must hold?
- Where could momentum accelerate?
- What confirms a breakout or reversal?
- Which price movement invalidates the scenario?
When these questions are answered clearly, Gann tools can become a useful component of a broader technical trading framework.
Frequently Asked Questions
1. What is Gann Theory?
Gann Theory is a technical-analysis approach that studies relationships among price, time, geometric angles and repeating market patterns to evaluate trend direction, support, resistance and possible reversal periods.
2. Who developed Gann Theory?
The methodology is associated with American trader and market theorist William Delbert Gann, who used mathematical, geometric, and time-cycle concepts in market analysis.
3. What is a Gann angle?
A Gann angle is a diagonal line representing a defined rate of price movement relative to time. It is projected from a significant market high or low.
4. What does the 1×1 Gann angle mean?
The 1×1 angle represents one unit of price movement for every one unit of time. It is traditionally associated with a balanced market trend.
5. Is the 1×1 Gann angle always 45 degrees?
No. It appears as a 45-degree line only when the chart is correctly scaled so that one unit of price equals one unit of time visually. Changing chart scale may change the apparent angle.
6. What is a Gann Fan?
A Gann Fan is a group of price-time angles projected from an important high or low. Its lines may act as dynamic support, resistance, and trend-strength references.
7. How should a Gann Fan anchor point be selected?
The fan should normally begin from a meaningful swing high, swing low, major reversal point, or breakout origin rather than a minor price fluctuation.
8. Can Gann angles predict exact market prices?
Gann angles identify potential support, resistance, and trend paths. They do not guarantee that price will reach or reverse at an exact level.
9. Which timeframe works best for Gann Theory?
Gann tools can be used on several timeframes, but angles drawn on daily, weekly, and monthly charts generally have greater structural importance. The appropriate timeframe depends on the trading horizon.
10. Can Gann Theory be used for intraday trading?
Yes, but short-term charts contain more noise. Intraday Gann analysis should be aligned with higher-timeframe structure and supported by strict confirmation and risk controls.
11. What indicators work well with Gann angles?
Moving averages, RSI, volume, ATR, candlestick patterns, and horizontal support and resistance can provide useful confirmation.
12. How is a bullish Gann signal confirmed?
A bullish signal may be confirmed when price holds above a rising angle, forms a higher low, produces bullish price action and receives support from momentum or volume.
13. How is a bearish Gann signal confirmed?
A bearish signal may be confirmed when price remains below a descending angle, forms a lower high, produces bearish rejection and receives confirmation from momentum or volume.
14. What invalidates a bullish Gann scenario?
A decisive close below the supporting angle, a break of the latest swing low, or a shift to lower highs and lower lows can invalidate the bullish scenario.
15. What invalidates a bearish Gann scenario?
A decisive close above the resistance angle, a break of the latest lower high, or a shift to higher highs and higher lows can invalidate the bearish scenario.
16. Are traditional Gann day-count rules always reliable?
No. Rules involving specific weekdays or fixed numbers of rising and falling sessions are historical observations. Their effectiveness varies and should be tested independently.
17. Is Gann Theory scientifically proven?
Gann Theory should be treated as a technical framework rather than a scientifically certain forecasting model. Its signals require testing, confirmation, and risk management.
18. What is the biggest risk of using Gann Theory?
The biggest risks are incorrect chart scaling, subjective anchor selection, overfitting, and treating geometric lines as guaranteed market predictions.
-----------------------------------------------------------
Educational Risk Disclaimer
This article is provided exclusively for educational and informational purposes. It does not constitute investment research, personalized financial advice, an investment recommendation, or an offer to buy or sell any financial instrument.
Technical-analysis methods, including Gann Theory, cannot guarantee future market performance. Trading and investing—particularly through leveraged products—involve substantial risk and may result in the loss of part or all invested capital.
Historical price behavior, geometric relationships and previous market cycles do not guarantee that similar patterns will occur in the future. Every trader remains responsible for evaluating personal financial circumstances, objectives, and risk tolerance before making any trading decision.
Comments