 English
 پارسی


What the Video
Global Economy Weekly Review
Resilient U.S. Growth, Fragile Europe, Selective China Stabilization, and Renewed Persian Gulf Risk
The global economy ended the week with a mixed but important message: growth has not broken, but the recovery remains uneven and highly exposed to inflation, oil, and geopolitical shocks. The U.S. economy remained the strongest major-market anchor, China showed selective stabilization, Japan stayed sensitive to yen intervention and softer wage momentum, Europe remained fragile, and emerging economies continued to diverge sharply.
The dominant global market driver was the renewed escalation between the U.S. and Iran around the Strait of Hormuz and the Persian Gulf, which kept oil, gold, equities, and currencies highly reactive. Markets started the week pricing hopes of a peace framework, but later developments revived concerns over energy security and inflation risk.
United States: Resilient Growth, Cooling Labor, Mixed Fed Signal
The U.S. economy remained the most resilient part of the global macro picture. The strongest signal was that the Atlanta Fed GDPNow estimate for Q2 stayed at 3.7%, showing solid real-time growth momentum.
The labor market also held up better than expected. Nonfarm Payrolls rose by 115K, beating the 65K forecast, while the unemployment rate held at 4.3%. Weekly jobless claims stayed low, with initial claims at 200K, below the 205K forecast, and continuing claims at 1.766M, better than expected.
However, the labor market is cooling. Wage pressure softened, with Average Hourly Earnings rising 0.2% MoM, below the 0.3% forecast, and annual wage growth at 3.6%, below the 3.8% forecast. U6 unemployment rose to 8.2%, and manufacturing payrolls fell by 2K.
Consumer signals were mixed. Consumer credit jumped by $24.86B, well above the $12.50B forecast, showing active household borrowing. But Michigan Consumer Sentiment fell to 48.2, below forecast, while current conditions dropped sharply to 47.8. Inflation expectations remained elevated, with NY Fed 1-year expectations rising to 3.6%, while Michigan 1-year inflation expectations eased to 4.5% and 5-year expectations to 3.4%.
Assessment: The U.S. economy is still expanding, but the composition is less clean. Growth is firm, labor is resilient, but consumers are less confident, and wage pressure is cooling. The Fed has no clear reason to cut quickly, but also no clean case for aggressive new tightening.
USD Sentiment: Neutral to Buy Bias
Wall Street: AI Strength Meets Geopolitical Risk
Wall Street reached record highs during the week as AI optimism, strong technology earnings, and lower oil prices supported risk appetite. The S&P 500 closed at 7,365.12, the Nasdaq Composite at 25,838.94, and the Dow Jones at 49,910.59 during the strongest session.
But the rally faded as U.S.-Iran tensions returned. By Thursday, the S&P 500 fell 0.4% to 7,335.66, the Nasdaq slipped 0.1% to 25,806.20, and the Dow dropped 0.6% to 49,596.60.
AI remained the strongest equity theme. AMD, Alphabet, Corning, Arm, TSMC, and other AI-linked names kept investor attention on data centers, cloud infrastructure, semiconductors, and optical connectivity. Nasdaq resilience showed that investors still prefer growth and AI exposure over traditional cyclicals.
Assessment: Wall Street remains supported by AI and U.S. growth, but geopolitical risk and oil-price volatility can quickly cap upside.
S&P 500 Sentiment: Neutral to Buy Bias
Nasdaq 100 Sentiment: Buy Bias
Dow Jones Sentiment: Neutral to Sell Bias
Europe: Weak Growth, Higher Producer Inflation, and Uneven Recovery
Europe delivered one of the weakest major-economy signals of the week. Eurozone private-sector activity slipped back into contraction, with the Services PMI falling to 47.6 and the Composite PMI dropping to 48.8.
The most concerning inflation signal was producer prices. Eurozone PPI rose 3.4% MoM, slightly above forecast, while annual PPI turned positive at 2.1% YoY, a major reversal from the previous -3.0%. This creates a difficult ECB setup: weak activity but renewed upstream inflation pressure.
Germany remained fragile. Factory orders jumped 5.0% MoM, but industrial production fell 0.7% MoM, and the trade surplus narrowed to €14.3B, below forecast. France showed a better industrial print, with industrial production up 1.0% MoM, but its trade and current-account deficits worsened. Italy performed relatively better, with the Composite PMI rising to 50.5 and retail sales up 0.8% MoM. Spain showed mixed but constructive data, including lower unemployment and industrial production growth of 1.8% YoY.
Construction was the weakest sector. The Eurozone Construction PMI fell to 41.7, with Germany, France, and Italy all in contraction.
Assessment: Europe is not collapsing, but the recovery is fragile, fragmented, and vulnerable to inflation shocks. The ECB cannot turn aggressively dovish while producer inflation is rebounding.
EUR Sentiment: Neutral to Sell Bias
United Kingdom: Services Hold Up, Housing and Construction Struggle
The UK economy showed a narrow, services-led expansion. The Composite PMI rose to 52.6, beating the forecast, while the Services PMI improved to 52.7, confirming that services remain the main growth engine.
However, rate-sensitive sectors remained under pressure. The Construction PMI fell sharply to 39.7, far below the 45.8 forecast. The Halifax House Price Index fell 0.1% MoM, while annual house-price growth slowed to 0.4%. Mortgage rates stayed high at 6.60%, keeping affordability under pressure.
Assessment: The UK is still expanding, but the recovery is not broad. Services are carrying the economy, while housing and construction remain weak.
GBP Sentiment: Neutral
China: Selective Stabilization, Not Broad Reacceleration
China’s weekly data was moderately positive. The strongest signal came from services, with the RatingDog Services PMI rising to 52.6, above the 52.0 forecast and the previous 52.1. This suggests service activity is still expanding.
China’s external buffer improved, with FX reserves rising to $3.411T from $3.342T. That supports confidence in China’s ability to manage yuan volatility.
However, the recovery still looks selective. The data does not yet confirm a strong rebound in property, household confidence, employment, or broad private-sector activity. Hong Kong also provided a strong growth signal, with Q1 GDP up 5.9% YoY, but retail-sales momentum cooled.
Assessment: China is stabilizing, but not yet fully reaccelerating. Services and reserves are supportive, but the recovery needs broader confirmation.
CNY Sentiment: Neutral to Buy Bias
Chinese Equities Sentiment: Neutral to Buy Bias
Japan: Yen Intervention and Softer Domestic Momentum
Japan’s week was dominated by reported FX intervention. Tokyo reportedly stepped into the market during Golden Week after USD/JPY crossed 160, with estimates suggesting intervention may have reached around ¥5 trillion, or about $32B. By Friday, USD/JPY was near 156.85.
Domestic data softened. Wage growth slowed, with employee wage income rising 2.7% YoY, below the 3.2% forecast and down from 3.4%. Services also cooled, with the Services PMI falling to 51.0 and the broader PMI easing to 52.20. Both remain above 50, but momentum weakened.
Japanese equities were the opposite story. The Nikkei 225 surged nearly 6% to a record high of around 63,000, led by AI and semiconductor-linked shares.
Assessment: Japan is still expanding, but the wage and services momentum has cooled. Intervention can cap yen weakness, but durable yen strength requires more than currency operations.
JPY Sentiment: Neutral
USD/JPY Sentiment: Neutral to Sell Bias
Nikkei Sentiment: Buy Bias
Emerging Markets: Divergence Is the Main Theme
Emerging economies were highly mixed.
China showed stabilization, India had strong domestic credit growth but lower FX reserves, Brazil showed stronger industrial production and a wider trade surplus, and Mexico saw inflation cool while Banxico cut rates to 6.50%.
Brazil’s industrial production rose 4.3% YoY, and its trade surplus widened to $10.54B, but IGP-DI inflation jumped 2.41% MoM and auto-sector data weakened. Mexico’s inflation cooled to 4.45% YoY, supporting policy easing, but the rate cut reduces carry support for MXN.
Turkey remained vulnerable. Industrial production fell 1.1% YoY, gross FX reserves declined to $56.60B, and the Treasury cash deficit remained large despite narrowing to TRY -251.242B. Russia also showed pressure, with the budget deficit widening to -2.50% of GDP and reserves falling to $757.5B.
South Korea looked stronger externally, with its current-account surplus widening to $37.33B and FX reserves rising to $427.88B.
Assessment: Emerging markets remain investable, but selectivity is essential. External buffers, inflation paths, oil sensitivity, and central-bank direction matter more than broad EM beta.
EM FX Sentiment: Neutral
Weekly Global Economic Outlook — Week 20: May 11–17, 2026
Inflation, Consumers, and Hormuz Risk Will Drive the Week
The week ahead will be dominated by one macro question: Is the recent oil shock from the U.S.-Iran conflict feeding into broader inflation and consumer weakness? Markets enter Week 20 with U.S. growth still resilient, but consumer confidence weak, wage pressure cooler, and geopolitical risk around the Strait of Hormuz still active.
The biggest event is the U.S. April CPI report on Tuesday, May 12. The BLS schedule confirms the April CPI release at 8:30 a.m. ET, and this report will be the key test for whether higher energy prices are spreading into core inflation. A hot CPI print would support the dollar and Treasury yields, while pressuring equities and gold-sensitive risk assets. A softer CPI print would support the “soft landing” trade and may help Wall Street recover momentum.
On Wednesday, May 13, the focus shifts to U.S. PPI, another important inflation checkpoint. If producer prices confirm stronger pipeline pressure, markets may price a more cautious Federal Reserve. If PPI softens, it would reduce fears that the energy shock is becoming a broader cost problem.
Thursday, May 14, will be the busiest day. The U.S. will release retail sales and import/export prices, while the UK publishes Q1 GDP and March monthly GDP. U.S. retail sales will show whether consumers are still spending despite high gasoline prices and weak sentiment. UK GDP will test whether the UK’s services-led recovery is strong enough to offset weak housing and construction.
China will also stay in focus, with markets watching inflation, credit, retail, and industrial signals following last week’s improvement in services. The key issue is whether China’s recovery remains selective or broadens into stronger domestic demand.
U.S. Economy Weekly Review:
Resilient Growth, an acceptable Labor Market, and a Cautious Fed Outlook
I see the latest U.S. economic picture as resilient, but increasingly uneven. The economy is still expanding, the labor market has not broken, and real-time growth tracking remains strong. However, the details show a clear cooling process: wage pressure moderated, consumer confidence weakened, manufacturing employment softened, and inflation expectations stayed too high for the Federal Reserve to declare victory. In my view, this is not a recessionary setup, but it is also not a clean growth story. It is a soft-landing environment, but important inflation and policy risks remain.
The labor market delivered the most important signal of the week. April Nonfarm Payrolls rose by 115K, beating the 65K forecast, but slowing sharply from the previous 185K. Private payrolls increased by 123K, also better than expected, but below the prior 190K. The unemployment rate held steady at 4.3%, which confirms that the labor market remains stable. Still, I would not call the report strong across the board. Average Hourly Earnings rose only 0.2% month-over-month, below the 0.3% forecast, while the participation rate slipped to 61.8% and the broader U6 unemployment rate rose to 8.2%. Manufacturing payrolls fell by 2K, and government payrolls declined by 8K. This tells me that hiring is still positive, but labor demand is no longer as broad or as powerful as before.
Weekly jobless claims also supported the “cooling but not breaking” narrative. Initial claims came in at 200K, below the 205K forecast, while continuing claims fell to 1.766 million, better than expected. The four-week average eased as well. However, Challenger job cuts rose to 83.387K, showing that companies are still announcing more layoffs even if those cuts are not yet fully visible in claims. For the Fed, this labor mix reduces pressure for additional tightening, but the payroll beat prevents markets from pricing an aggressive dovish pivot.
Growth remains the strongest part of the macro story. The Atlanta Fed GDPNow estimate for Q2 stayed at 3.7%, which is a powerful signal that the U.S. economy continues to expand at a healthy pace. Construction spending also improved, rising 0.6% in March, above the 0.3% forecast. This matters because strong real-time growth keeps recession fears limited. At the same time, it also means the Fed has less reason to rush toward rate cuts. A solid economy gives policymakers room to stay patient.
The consumer sector is more complicated. Consumer credit jumped by $24.86 billion in March, far above the $12.50 billion forecast and the previous $8.85 billion increase. That suggests household activity remains active, but it also raises a warning flag: spending may be relying more heavily on borrowing. Consumer sentiment weakened further, with the Michigan Consumer Sentiment Index falling to 48.2, below both forecast and the previous reading. Current conditions dropped sharply to 47.8, although expectations improved slightly to 48.5. I read this as a fragile consumer backdrop. Americans are still spending, but they are not feeling confident about current economic conditions.
Inflation signals were mixed. On the positive side, labor-cost pressure cooled. Wage growth slowed on a monthly basis, Unit Labor Costs rose 2.3%, below the 2.6% forecast and far below the previous 4.6%, while Nonfarm Productivity improved to 0.8%. This is helpful for the inflation outlook because stronger productivity and softer labor costs reduce pressure on business margins and prices.
However, inflation expectations remain uncomfortable. The NY Fed one-year inflation expectations rose to 3.6% from 3.4%. Michigan one-year expectations eased to 4.5%, and five-year expectations slipped to 3.4%, but both remain too high for a central bank targeting price stability. This is why I do not see the Fed becoming clearly dovish yet. Actual wage pressure is cooling, but inflation psychology is still sticky.
The external sector also showed mixed signals. The trade deficit widened to $60.30 billion from $57.80 billion, even though it was slightly better than the $61.00 billion forecast. Exports improved to $320.90 billion, but imports rose even more strongly to $381.20 billion. This does not point to recession, but if the deficit keeps widening, it could become a drag on GDP.
Housing was uneven. Building permits fell to 1.363 million, below forecast and down sharply from 1.538 million, with permits falling 11.4% month-over-month. That shows pressure on future supply. But new home sales improved to 682K, beating the 652K forecast and rising from 583K. I see housing as constrained by high mortgage rates, but not collapsing. Demand still exists where inventory and affordability allow transactions.
Business activity remains expansionary, but momentum is cooling. The ISM Non-Manufacturing PMI came in at 53.6, still above 50 but slightly below expectations. New orders fell to 53.5, and employment stayed below the expansion line at 48.0. S&P Global Services PMI improved to 51.0, while the Composite PMI reached 51.7. Services are still expanding, but weaker new orders and soft employment make the outlook less clear.
Energy data was mixed, but geopolitics remains the bigger risk. Crude inventories fell by 2.313 million barrels, less than expected, while gasoline inventories dropped more than forecast. Any renewed U.S.-Iran tension around the Strait of Hormuz could quickly lift oil prices, inflation expectations, and market volatility.
Overall, I see the U.S. economy as resilient but cooling. Growth remains firm, payrolls beat expectations, and claims are low. But softer wages, weak confidence, elevated inflation expectations, and uneven services activity argue for Fed patience. My market view is USD Neutral to Buy Bias. The dollar is supported by solid growth and labor resilience, but weaker sentiment and cooling wages limit a stronger bullish signal. Equities can stay supported by growth and lower labor-cost pressure, while bonds may remain volatile as markets balance strong GDP momentum against softer inflation inputs.
U.S. Economy Week Ahead:
Inflation, Consumers, and the Fed’s Patience Test
I see the week of May 11–15 as one of the most important U.S. macro weeks of the month because it brings a concentrated sequence of inflation, consumer, housing, labor, trade-price, and industrial data. The key question for markets is whether the U.S. economy is still strong enough to absorb higher energy prices, or whether inflation is now starting to damage real consumption, household confidence, and growth momentum.
My base case is that the U.S. economy remains stable, but more sensitive to inflation shocks. The labor market is not weak enough to force the Federal Reserve into a dovish pivot, but households are becoming more vulnerable to higher gasoline prices, tighter credit conditions, and weaker real purchasing power. That makes this week’s CPI, PPI, retail sales, import prices, jobless claims, and industrial production critical for Treasury yields, the U.S. dollar, equities, gold, and oil-linked inflation expectations.
Before the data, the economy still carries a soft-landing profile. April Nonfarm Payrolls rose by 115,000, the unemployment rate held at 4.3%, and average hourly earnings increased 3.6% year over year. Job creation remained positive, especially in health care, transportation and warehousing, and retail trade. However, this is not a booming labor market. It is a slower labor market that still gives the Fed enough room to stay patient rather than rush toward rate cuts.
The bigger problem is inflation. March CPI already showed clear energy pressure, with headline CPI rising 0.9% month over month, the energy index jumping 10.9%, gasoline prices rising 21.2%, and headline inflation reaching 3.3% year over year. Core CPI was more contained at 0.2% month over month and 2.6% year over year, but the April report will show whether the energy shock is temporary or spreading into services, transportation, goods, and inflation expectations.
Consumer confidence is already warning that households are under pressure. The University of Michigan’s preliminary May consumer sentiment index fell to 48.2 from 49.8, while current conditions dropped sharply to 47.8. I read this as an important signal: consumers are still participating in the economy, but they are becoming less comfortable with current conditions. Higher fuel prices, borrowing costs, and weaker real-income expectations are beginning to matter more.
The first important release comes on Monday, May 11, with April Existing Home Sales. Housing remains a sensitive part of the U.S. economy because mortgage rates, affordability pressures, and cautious buyers continue to limit activity. March data showed 3.98 million existing home sales, a median sales price of $408,800, and 4.1 months of inventory. I will watch whether April confirms a stronger spring housing season or another sign of rate-sensitive demand weakness.
Tuesday, May 12, is the most important day of the week because the April CPI and real earnings will be released. I will not focus only on headline CPI, because energy and gasoline can distort the top-line number. The cleaner market signal will come from core CPI, shelter, transportation services, airfares, vehicles, household furnishings, medical services, and real wage growth.
The inflation risk is that higher crude oil prices and Middle East tensions are beginning to pass through more visibly. The working estimate points to headline CPI rising 0.63% month over month, lifting annual inflation to 3.8%. Energy goods could rise around 6% on the month, while food-at-home inflation may strengthen as transportation, fuel, and fertilizer costs increase. Core CPI is expected to rise 0.50% month over month and 2.9% year over year, driven mainly by core services, airfares, shelter effects, and a rebound in used vehicle prices.
On Wednesday, May 13, the April PPI report will show whether producer-level inflation is also heating up. March PPI already increased 0.5%, with goods prices rising 1.6% and final-demand prices up 4.0% year over year. A hotter PPI would increase the risk that companies either pass higher costs to consumers or accept weaker margins. Both outcomes matter for equities.
Thursday, May 14, is the broadest macro day. April retail sales will be crucial, but I will treat the headline carefully because retail sales are reported nominally. If sales rise because gasoline prices are higher, that does not mean real consumption is stronger. The estimate points to a 0.7% increase in total retail sales, but after adjusting for goods inflation, real retail sales may be weak or even negative. I will focus on control-group sales, autos, restaurants, online sales, and discretionary categories.
The same day also brings import and export prices, which are highly relevant because they capture energy, tariff, and supply-chain pass-through. Weekly jobless claims will also matter after claims rose to 200,000 for the week ending May 2 but remained historically low.
On Friday, May 15, industrial production and capacity utilization will provide the main read on manufacturing, mining, utilities, and energy-linked output. I will also watch Fed leadership headlines, because any uncertainty around policy transition or Fed independence could affect bond pricing after a heavy inflation-data week.
Overall, this week is a Fed patience test. The next FOMC meeting on June 16–17 includes updated projections, so this inflation and consumer data sequence will directly shape the June policy debate. My view is simple: the Fed can tolerate slower growth if the labor market remains stable, but it cannot easily tolerate another broad inflation acceleration.
For markets, my bias is USD Neutral to Buy, especially if CPI, PPI, and import prices confirm sticky inflation. Treasury yields may stay supported if inflation surprises higher, while equities could become more selective. Gold and oil remain highly sensitive to geopolitical risk, especially if energy prices keep feeding inflation expectations.
USD and Wall Street Outlook:
Inflation Data, AI Momentum, and Iran Risk Define the Next Market Move
I see the U.S. dollar and Wall Street entering the week ahead in a sensitive but still fundamentally supported position. The dollar has softened slightly, while equities moved from record highs into a more cautious close as geopolitical risk returned to market pricing. The key message is that the U.S. macro backdrop remains resilient, but confidence is being tested by inflation risk, oil volatility, U.S.-Iran tensions, and uncertainty around the Federal Reserve’s next policy direction. For me, this is not a bearish market setup yet, but it is a clear valuation and Fed-repricing test.
My current market view is USD: Neutral-to-Buy and Wall Street: constructive but vulnerable. Nasdaq and AI leaders remain the strongest part of the equity market, but they are crowded and highly sensitive to Treasury yields. Dow and cyclical stocks are more exposed to consumer pressure and margin risk, while small caps remain vulnerable if yields rise again. The next move will depend heavily on CPI, PPI, import/export prices, retail sales, jobless claims, industrial production, and oil-linked inflation expectations.
The U.S. Dollar Index weakened modestly during the past week, trading around 97.70, down about 0.16% in European trade on Friday. The dollar came under pressure as markets continued to price some hope for a broader U.S.-Iran peace framework, even after renewed tensions around the Strait of Hormuz. Normally, military escalation can support the dollar through safe-haven demand, but this time the reaction was limited because investors were balancing escalation risk against the possibility of continued negotiations. In my view, the dollar is soft, but not broken.
The labor market still gives the dollar some support. April payrolls rose by 115,000, while the unemployment rate held at 4.3%. Initial jobless claims remained low at 200,000, below the 205,000 forecast, and continuing claims fell to 1.766 million. These figures do not support an immediate Fed easing cycle. However, the report was not strongly hawkish either. Average hourly earnings rose only 0.2% month over month, below forecast. Annual wage growth slowed to 3.6%, the U6 unemployment rate rose to 8.2%, and manufacturing payrolls fell by 2,000. This is a cooling labor market, but not a breaking one.
For the Federal Reserve, the message is patience. The latest U.S. data do not justify an urgent rate cut, but they also do not clearly support another tightening cycle. Wage growth has cooled, unit labor costs slowed to 2.3%, consumer sentiment weakened, manufacturing employment softened, and broader labor-market slack increased slightly. That means the Fed is likely to wait for stronger evidence from inflation data, oil prices, wages, and consumption before changing its tone.
This makes the week ahead extremely important. The April CPI report on Tuesday, May 12, is the most important release for the dollar, Treasury yields, growth stocks, and Fed expectations. PPI follows on Wednesday, May 13, while import/export prices and retail sales arrive on Thursday, May 14. This is a full inflation-pipeline week. A hot CPI report would likely support the dollar by reducing the probability of Fed cuts and lifting front-end yields. For equities, however, the same report could be negative if investors read inflation as a threat to valuation multiples, profit margins, and consumer demand.
The key issue is not only the headline CPI. Gasoline and energy can push headline inflation higher, but I will focus more on core services, shelter, transportation, medical services, goods prices, and import-sensitive categories. If inflation spreads beyond energy, the Fed will have very little room to sound dovish. In that scenario, the dollar can strengthen, but Wall Street may face renewed pressure through higher yields.
Wall Street’s backdrop remains fundamentally constructive, but more fragile than before. Equities started the week strongly, supported by AI optimism, resilient jobs data, lower oil prices, strong earnings, and hopes for progress in U.S.-Iran talks. Momentum faded later as renewed Hormuz tensions and reports of an alleged U.S. attack on an Iranian oil tanker reminded investors that geopolitical shocks can quickly feed into oil, inflation expectations, and Fed policy.
Earnings are still the strongest support for equities. According to FactSet figures, 89% of S&P 500 companies had reported Q1 results, with 84% beating EPS estimates. The blended Q1 earnings growth rate rose to 27.7%, up from 13.1% at the end of the quarter. That is a powerful earnings backdrop and helps explain why equities remain resilient despite macro and geopolitical risk. Technology, communication services, AI infrastructure, semiconductors, and large-cap growth continue to lead the market. Information Technology earnings growth stood at 50.7%, with Nvidia and Micron among the major contributors.
The risk is valuation. A strong earnings cycle can support equities, but only if Treasury yields do not rise too aggressively. If CPI and PPI come in hot, growth stocks may face pressure because higher yields reduce the value of future earnings. Nasdaq and AI-linked names can still outperform, but after a strong rally, they are more vulnerable to profit-taking.
Retail sales will be the second major test for equities. Consumer sentiment has weakened sharply, with the University of Michigan index falling to 48.2 from 49.8, while high gasoline prices continue to pressure household budgets. I will not treat a strong headline retail sales number as automatically bullish. If sales rise mainly because gasoline prices are higher, that points to inflation pressure rather than healthy real demand. The cleaner signal will come from control-group sales, online spending, restaurants, autos, and discretionary categories.
My scenario map is straightforward. Hot CPI plus strong retail sales is bullish for USD but mixed for equities. Hot CPI plus weak retail sales is initially USD-positive but bearish for equities because it raises stagflation risk. Soft CPI plus stable retail sales would be the best outcome for Wall Street and would likely weaken the dollar. Soft CPI plus weak retail sales would hurt the dollar but create a mixed equity reaction, as rate-cut hopes would compete with growth concerns.
Sector-wise, I still favor technology, AI, semiconductors, and communication services, but I would watch yield sensitivity closely. Consumer discretionary is more fragile because gasoline prices and weak confidence can damage real spending. Financials can benefit from higher yields, but credit quality matters. Industrials need confirmation from industrial production. Energy remains supported by Middle East risk, but higher oil prices can hurt broader market sentiment. Small caps remain the weakest group if financing costs rise.
Overall, I see the week ahead as a Fed-repricing week for the dollar and a valuation stress test for Wall Street. The USD remains Neutral-to-Buy as long as inflation risk keeps the Fed cautious. Wall Street remains constructive, but it needs inflation to stay controlled. If CPI cools and retail sales remain stable, the rally can continue. If inflation is hot and consumers weaken, defensive positioning will become more attractive.
US Dollar Index Technical Analysis
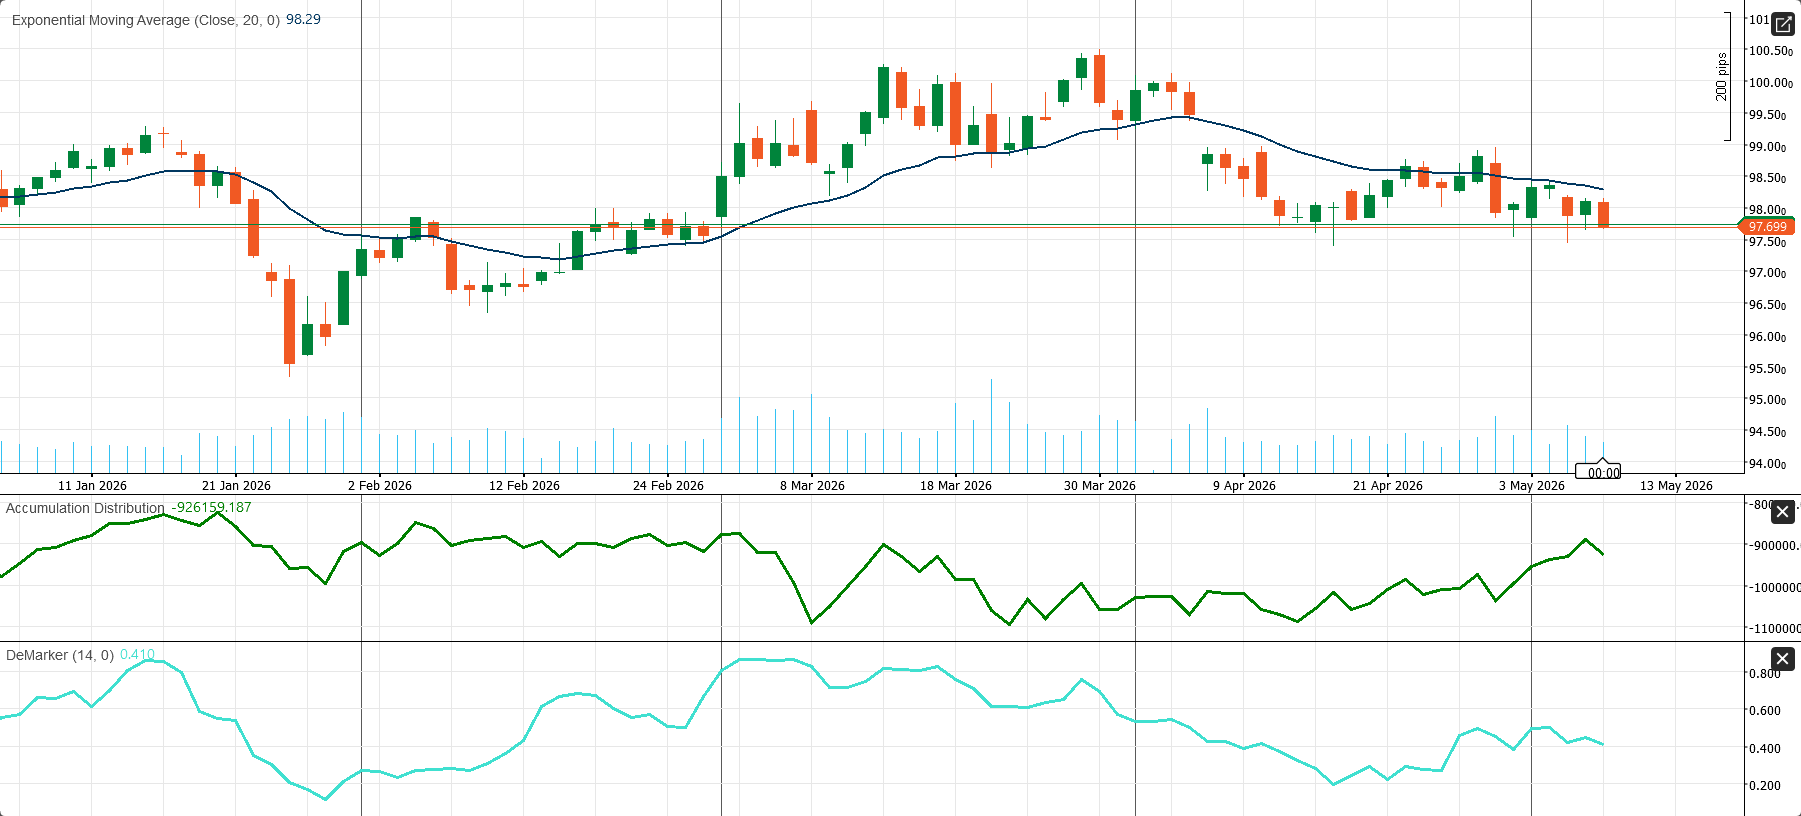
The daily U.S. Dollar Index (DXY) chart has weakened again after failing to hold above its short-term trend line. Price is trading around 97.699, below the 20-day EMA at 98.29, which gives the near-term structure a mild bearish tilt. The chart is no longer in a clear recovery phase; instead, it has rolled back into a fragile consolidation with sellers holding the edge while price remains under the EMA.
The key technical level now is 97.70. This area is acting as immediate support, but the market is sitting on it rather than bouncing decisively from it. If DXY breaks below 97.70, the next downside zone comes in around 97.00, followed by the broader support area near 96.00. On the upside, the first recovery barrier is the 20-day EMA near 98.29, and above that, the next meaningful resistance sits around 98.80–99.00.
The supporting indicators also point to a soft structure rather than a strong reversal. Accumulation/Distribution has improved from recent lows, which suggests selling pressure has eased somewhat, but it has not yet turned into a strong accumulation breakout. At the same time, the DeMarker reading near 0.41 shows momentum is neither oversold nor convincingly bullish. In practical terms, this is a weak daily chart that still needs a move back above 98.29 to stabilize meaningfully.
Nasdaq-100 Technical Analysis
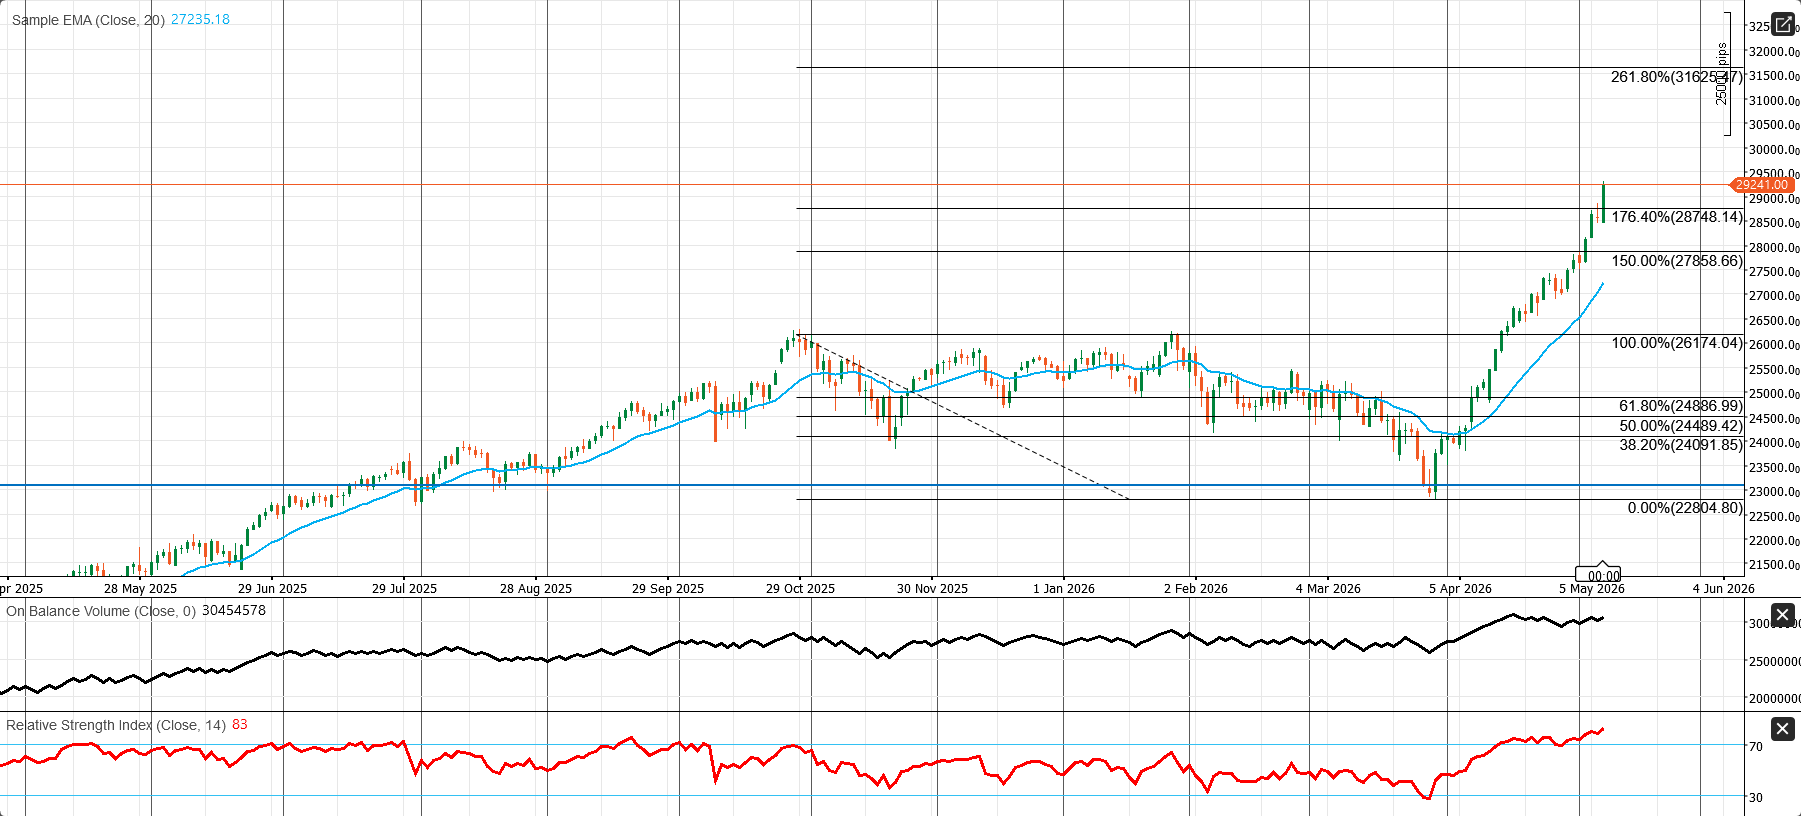
The Nasdaq 100 daily chart remains firmly bullish. Price is trading around 29,241.00, well above the 20-day EMA at 27,235.18, which confirms that the latest upside leg is still in control. The rebound from the early-April base near 22,804.80 has now extended aggressively through the key Fibonacci levels at 24,091.85, 24,489.42, 24,886.99, and 26,174.04, and the index has also pushed through the higher extension levels near 27,858.66 and 28,748.14.
That leaves the chart in a strong trend, but also in a stretched state. The next visible resistance is the current high zone around 29,241, while the broader extension target on the chart comes in near 31,625.47. On the downside, the first meaningful support is the 28,748–27,859 area, followed by the 26,174 level. As long as the price stays above those zones, the broader bullish structure remains intact.
Momentum is very strong, but the overheating risk is now clear. RSI is at 83, which places the market deep in overbought territory. On-Balance Volume is still rising, which confirms that the rally has been supported by strong participation rather than by a weak drift higher. In practical terms, this is a bullish trend, but not a cheap one. The chart now favors either a controlled pullback or a consolidation before the next leg, unless buyers can keep forcing a clean breakout higher.
UK Economy Weekly Review:
Services Hold Recovery Together, but Housing and Construction Stay Under Pressure
I see the UK economy ending the week with a clear but uneven message: growth is still alive, but it is not broad-based. The services sector remains the main engine of expansion, while housing, construction, real estate, and other rate-sensitive areas continue to struggle under the weight of high borrowing costs. For me, this is not a stagnant economy, but it is also not a balanced recovery. The UK is expanding through services, while the parts of the economy most exposed to interest rates remain fragile.
The strongest signal came from the April PMI data. The S&P Global UK Composite PMI rose to 52.6, beating the 52.0 forecast and improving sharply from the previous 50.3. This matters because the composite index moved further above the 50 expansion line, confirming that overall private-sector activity improved. In a market environment where investors are still watching for recession risks, this was a constructive growth signal.
The services sector was the main driver. The S&P Global UK Services PMI increased to 52.7, also above the 52.0 forecast and stronger than the previous 50.5. As a financial market analyst, I treat this as the most important positive part of the week because the UK economy is heavily services-driven. Stronger service activity suggests that demand, business conditions, and output are still holding up, even with high mortgage rates, tight credit conditions, and uneven household confidence.
However, I would not describe the UK economy as strong across the board. The PMI improvement reduces near-term recession risk, but it does not remove the structural weakness in rate-sensitive sectors. The economy is growing, but the expansion depends heavily on services. That makes the recovery vulnerable if the momentum slows later in the year.
The weakest data point came from construction. The S&P Global Construction PMI fell sharply to 39.7 in April, far below the 45.8 forecast and down from 45.6 previously. A reading below 40 is a serious contraction signal. It shows that high financing costs, weaker housing demand, tighter project economics, and caution around new investment are still weighing heavily on the sector.
This construction weakness is important because it does not stay isolated. It can affect housing, building materials, real estate activity, employment, infrastructure investment, bank lending, and business confidence. Even if services remain resilient, a deeply contracting construction sector reduces the quality of the UK recovery. For me, construction is the clearest warning sign in the latest UK data.
The housing market also remained soft. The Halifax House Price Index fell 0.1% month over month in April, weaker than the 0.0% forecast, although better than the previous 0.5% monthly decline. On an annual basis, house prices rose only 0.4% year over year, below the 0.6% forecast and down from 0.8% previously. This tells me that the housing market is not collapsing, but it is clearly losing momentum.
The weakness is consistent with the mortgage-rate backdrop. The UK mortgage rate stayed at 6.60% in April, unchanged from the previous reading. Stability in mortgage rates may look positive at first glance, but the absolute level remains restrictive. At 6.60%, affordability is still under pressure, especially for first-time buyers, households refinancing loans, and highly leveraged borrowers. This limits housing turnover and keeps pressure on consumer confidence.
For households, the problem is not only whether mortgage rates rise further. The problem is that they are already high enough to restrict activity. High borrowing costs reduce disposable income, limit housing demand, and make consumers more cautious. That is why I see mortgage conditions as a continuing drag on domestic growth, even without a new rate increase.
For the Bank of England, the latest data create a difficult policy mix. Stronger services and composite PMI readings reduce the urgency for aggressive rate cuts because they show that the economy is still expanding. At the same time, weak construction, soft house prices, and high mortgage rates show that restrictive monetary policy is still passing through the real economy.
This means the BoE is likely to remain cautious. I do not think this data gives policymakers a clean dovish signal, because the momentum is still positive. But it also warns against keeping policy too tight for too long, especially if housing and construction weakness starts to feed into employment, credit conditions, and household spending.
For sterling, the signal is mixed. The stronger services PMI supports the pound because it confirms economic resilience. However, construction weakness, soft housing data, and elevated mortgage rates prevent a stronger bullish call. My overall market sentiment for GBP is Neutral. I would not chase a strong buy signal from this data alone, but I also would not treat the UK economy as weak enough to justify a bearish sterling view.
For UK assets, I expect sector divergence to remain important. Services, consumer platforms, and companies linked to resilient domestic activity may perform better. Homebuilders, real estate, construction materials, and mortgage-sensitive financials may stay under pressure. In bonds, weak housing and construction data can support future BoE easing expectations, but stronger services activity limits a clean rally in gilts.
Overall, I see the UK economy as an uneven expansion. Services are keeping growth alive, and the composite PMI confirms that private-sector momentum improved. But the recovery is narrow. Construction is contracting sharply, house-price growth is slowing, and mortgage rates remain high. The main conclusion is simple: the UK is still expanding, but the expansion depends heavily on services while housing and construction remain under clear stress.
UK Economic Outlook:
GDP, Inflation, Gilts, and the Bank of England’s Policy Test
I see the UK economy entering the week ahead with a difficult but important macro setup. Growth has improved, but inflation risk is rising again. The Bank of England is still cautious; political risk has not fully disappeared, and the gilt market remains sensitive to energy prices, fiscal credibility, and policy communication. For me, this is a growth-confirmation week for the UK economy and a policy-pricing week for sterling and gilts.
The most important event will be on Thursday, May 14, the GDP package, which includes the monthly GDP for March 2026, the first quarterly GDP estimate for Q1 2026, services output, industrial production, construction output, and UK trade. This data set will show whether the UK entered the second quarter with real economic momentum or whether February’s strong growth was partly temporary.
My base case is stable but fragile UK growth. The economy is not in recession, and February’s data showed a better growth pulse. Monthly real GDP grew 0.5% in February, after 0.1% growth in January and 0.1% growth in December 2025. In the three months to February, real GDP also rose 0.5%, supported by services and production, while construction remained weaker. That improvement matters because the UK had been stuck in a low-growth environment. A strong March GDP reading would support the idea that the economy is stabilizing; a weak print would suggest February was more of a temporary rebound.
Inflation is the bigger problem. UK CPI rose to 3.3% year over year in March, up from 3.0% in February, while monthly CPI increased 0.7%. The Bank of England has already warned that inflation is above its 2% target and may rise further because the Middle East war has lifted energy costs. Higher energy prices can pass through to transport, utility bills, business costs, wages, and final consumer prices. This is why I do not see the BoE in a clean easing cycle.
The BoE held Bank Rate at 3.75% on April 30, and the next decision is due on June 18, 2026. The policy message is clear: the Bank can tolerate weaker growth if inflation persistence becomes the bigger danger. That makes this week’s GDP data important, but not enough on its own to change the policy outlook. The BoE will also need clearer evidence on inflation, wages, energy pass-through, and second-round effects.
Monday, May 11, has no major UK macro release, but I will still watch the gilt market. The Bank of England’s APF gilt sales calendar shows a £725 million medium-maturity gilt sale operation. This is not a classic growth indicator, but gilt supply matters because long-end UK yields remain sensitive to fiscal risk, inflation expectations, and political headlines. Recent moves in 30-year and 10-year gilt yields showed that political reassurance can calm markets, but the underlying sensitivity remains.
Tuesday brings foreign direct investment and business-investment-related data. These releases are unlikely to move markets sharply, but they matter for the medium-term UK growth story. The UK needs stronger private investment, better regional productivity, and services-export strength to escape the low-growth cycle. For sterling and gilts, Tuesday may function more as a positioning day before Thursday’s GDP package.
Wednesday has a quiet domestic calendar, but global inflation spillover still matters. The UK is highly exposed to imported energy costs, so U.S. PPI, oil prices, and global risk sentiment can move UK assets even without a domestic data release. If global inflation fears rise, UK yields may move higher, and sterling may become more volatile.
Thursday is the key macro day. The market will first focus on whether March GDP confirms or reverses February’s 0.5% monthly expansion. The expectation is for March GDP to contract by around 0.2%, while Q1 growth still lands near 0.5%, broadly in line with recent BoE projections. If March surprises positively, markets may treat it cautiously because some household and business activity may have been pulled forward. If March is weak, it would reinforce the BoE’s wait-and-see stance.
Services will be the core signal because the UK is a services-led economy. A strong services print would support sterling and domestically exposed equities, while weakness would suggest that higher prices, borrowing costs, and weaker confidence are starting to slow real activity. Production will show whether industrial activity is improving or still constrained by energy costs and weak manufacturing momentum. Construction output will be important for homebuilders, banks, commercial real estate, and the FTSE 250 because housing and construction remain highly rate-sensitive. Trade data will also matter: a wider deficit alongside weak GDP would be negative for sterling, while stronger external demand would support the recovery narrative.
Friday should be a market-digestion day after Thursday’s data, but Bank of England communication could still matter. Any comments from BoE officials, especially on inflation persistence, wage-price dynamics, energy pass-through, or the June meeting, may affect GBP and gilt pricing.
My final view is that the UK economy is stabilizing, but the recovery is not strong enough to absorb a prolonged energy shock easily. Sterling has a Neutral-to-Buy bias if GDP is firm, services hold up, gilts remain stable, and the BoE keeps a cautious tone. However, if growth disappoints while inflation risk stays elevated, the UK faces a more uncomfortable mix: weak activity, sticky inflation, cautious monetary policy, and fragile gilt sentiment.
GBPUSD Technical Analysis
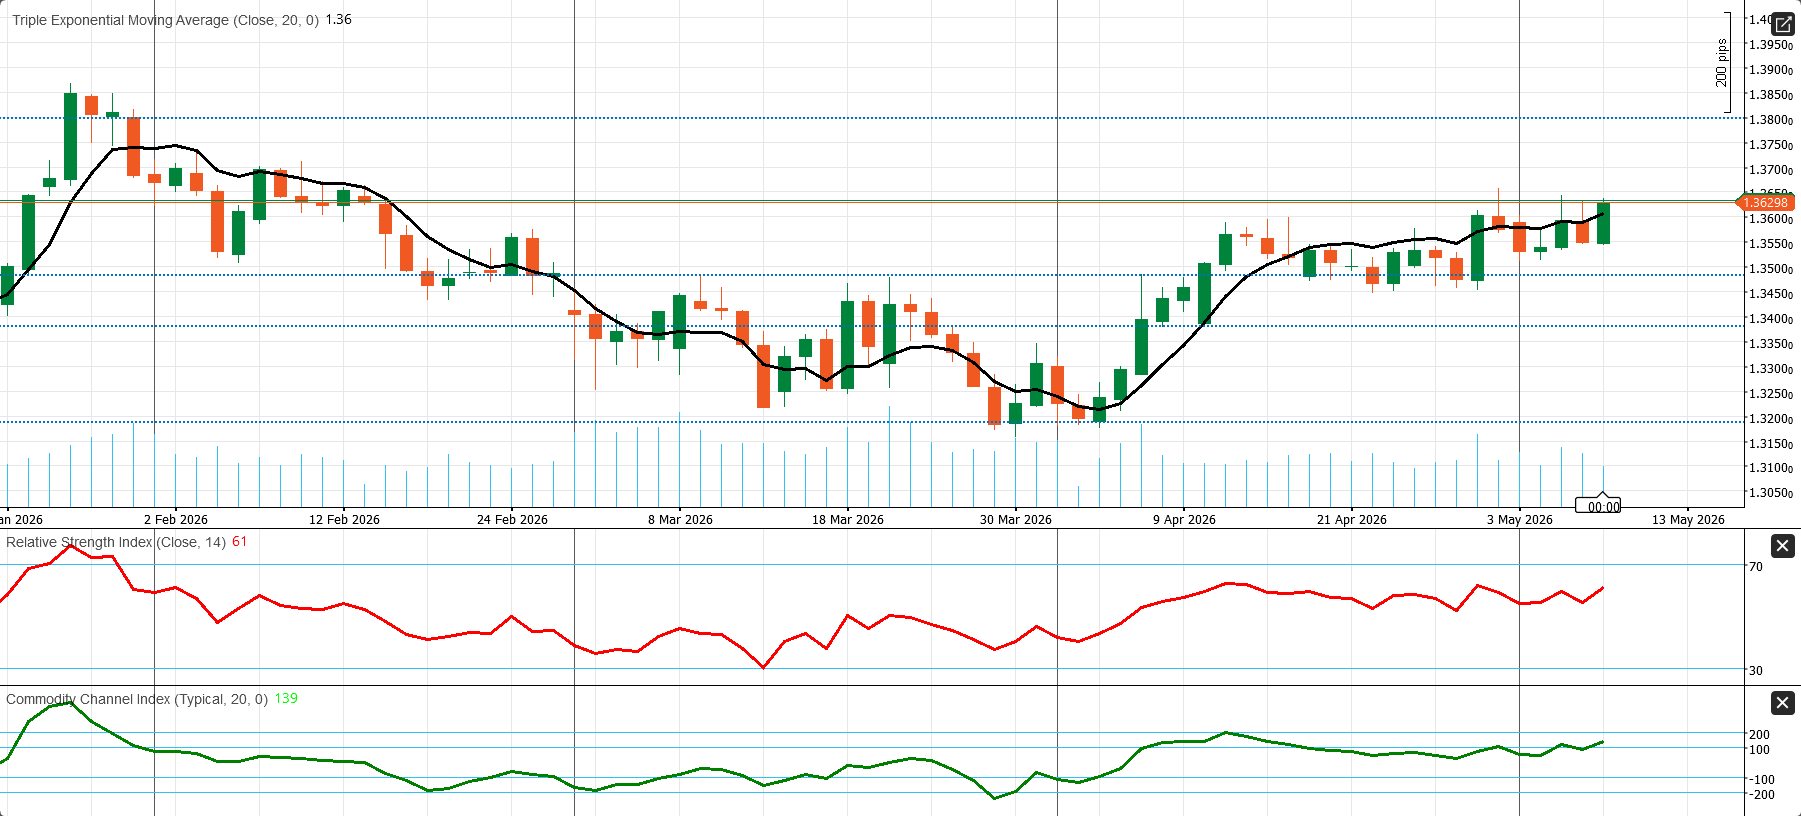
The daily GBP/USD chart shows a constructive recovery structure. Price is trading around 1.36298, above the 20-period Triple Exponential Moving Average near 1.36, which indicates that short-term trend support is still intact. The pair has also built a sequence of higher lows since the late-March base near the 1.3200 zone, confirming that buyers have regained control of the broader daily structure.
That said, the pair is now pressing a key resistance band rather than trading in open upside space. The immediate barrier sits around 1.3630, while the next important upside level is near 1.3800. A clean daily close above 1.3630 would strengthen the bullish continuation case and open room toward the 1.3800 zone. On the downside, first support comes in around 1.3500, followed by 1.3400, while the broader floor remains near 1.3200.
Momentum still leans positive. The RSI is at 61, which keeps it above the neutral 50 line and points to firm upside pressure without yet signaling an extreme overbought condition. The CCI near 139 also shows strong positive momentum, although it suggests the market is no longer cheap and may need either consolidation or a confirmed breakout before extending much further. In practical terms, the trend is constructive, but the pair now needs a decisive move through resistance to keep the rally clean.
Gold Market Condition and Weekly Outlook:
Safe-Haven Demand Supports the Rally, but CPI and Real Yields Will Decide the Next Move
I see gold entering the week ahead with a Neutral-to-Buy bias, supported by geopolitical risk, a softer U.S. dollar, central-bank demand, and uncertainty around the Federal Reserve’s next policy direction. The metal ended last week stronger, with spot gold trading around $4,720 per ounce and U.S. gold futures near $4,730.70, after gaining about 2.3% for the week. This confirms that gold remains well supported, but I would not treat the current setup as a simple one-way bullish market. The next major move depends heavily on U.S. inflation data, real yields, the dollar, and developments around U.S.-Iran tensions in the Persian Gulf.
The most important point for me is that gold is not rising only because of classic safe-haven demand. The current market is more complex. Investors are pricing gold through several channels at the same time: inflation risk, Fed expectations, real yields, the U.S. dollar, Middle East tensions, oil volatility, and central-bank reserve diversification. That makes gold constructive, but also vulnerable to sharp short-term reactions if inflation data push Treasury yields higher.
Geopolitical risk remains a key support. Renewed U.S.-Iran tensions, attacks around Hormuz, reported tanker incidents, and missile or drone interceptions in the region have kept defensive demand active. Even when oil prices fell earlier on peace hopes, gold did not lose its support completely because uncertainty remained high. This tells me that investors are still using gold as protection against geopolitical shocks, policy uncertainty, and energy-driven inflation volatility.
At the same time, peace headlines can cap gold’s upside. If markets believe a U.S.-Iran agreement is becoming more realistic, part of the safe-haven premium can fade. But the reaction is not always straightforward. Lower geopolitical risk can also reduce oil-driven inflation fears, weaken the dollar, and revive rate-cut expectations. That could still support gold through the rates channel, even if the safe-haven channel weakens. So the real question is not only whether tensions rise or fall; it is whether those developments push oil prices, inflation expectations, and Fed pricing higher or lower.
The main event for gold this week is the U.S. CPI report on Tuesday, May 12. CPI will decide whether markets focus more on inflation protection or higher interest-rate risk. If headline CPI is hot mainly because of energy, but core inflation remains controlled, gold may stay supported because investors will still want protection against inflation uncertainty and geopolitical risk. However, if core CPI, services inflation, shelter, transportation, and import-sensitive goods all come in strong, the market could price higher Treasury yields and a stronger dollar. That would be a near-term headwind for gold.
This is why I see real yields as the biggest macro risk for gold. Inflation itself is not always negative for the metal. In many cases, inflation uncertainty can increase demand for gold. The problem begins when inflation forces the Fed to stay restrictive for longer and pushes real yields higher. Since gold does not pay income, higher real yields increase the opportunity cost of holding it. A hot CPI and strong PPI combination would therefore be more dangerous for gold than an energy-driven headline inflation surprise alone.
The Fed outlook remains central. The U.S. labor market is cooling but not breaking, which gives the Fed room to wait. Softer wage pressure and weaker consumer sentiment reduce the case for more aggressive tightening, but resilient employment and elevated inflation expectations prevent a clean dovish pivot. This policy uncertainty keeps gold supported because investors do not have a clear path for rates, inflation, or growth.
Retail sales on Thursday, May 14, will be the second major test. Retail sales matter for gold because they help define the Fed's path. If retail sales remain strong while inflation is hot, markets may price a more restrictive Fed, which could pressure gold through higher yields and a stronger dollar. If retail sales weaken while inflation remains sticky, stagflation concerns could support gold as a defensive asset. For gold, the most bullish consumer-data mix would be weaker real demand combined with persistent inflation anxiety.
Physical demand remains mixed, but the long-term structural story is still supportive. High prices have limited Indian demand, while Chinese premiums remain firm. More importantly, China’s central bank increased its gold reserves for the 18th consecutive month in April. This reinforces gold’s long-term floor through central-bank buying, reserve diversification, and demand for protection against currency debasement and geopolitical risk.
Overall, I remain constructive on gold, but I prefer a buy-on-dips approach rather than chasing strength aggressively. The broader backdrop still supports the metal: geopolitical risk is high, central-bank demand is firm, the dollar has softened, and Fed uncertainty remains elevated. However, if U.S. inflation data push real yields higher, gold may correct first before the broader bullish structure resumes.
XAUUSD Technical Analysis
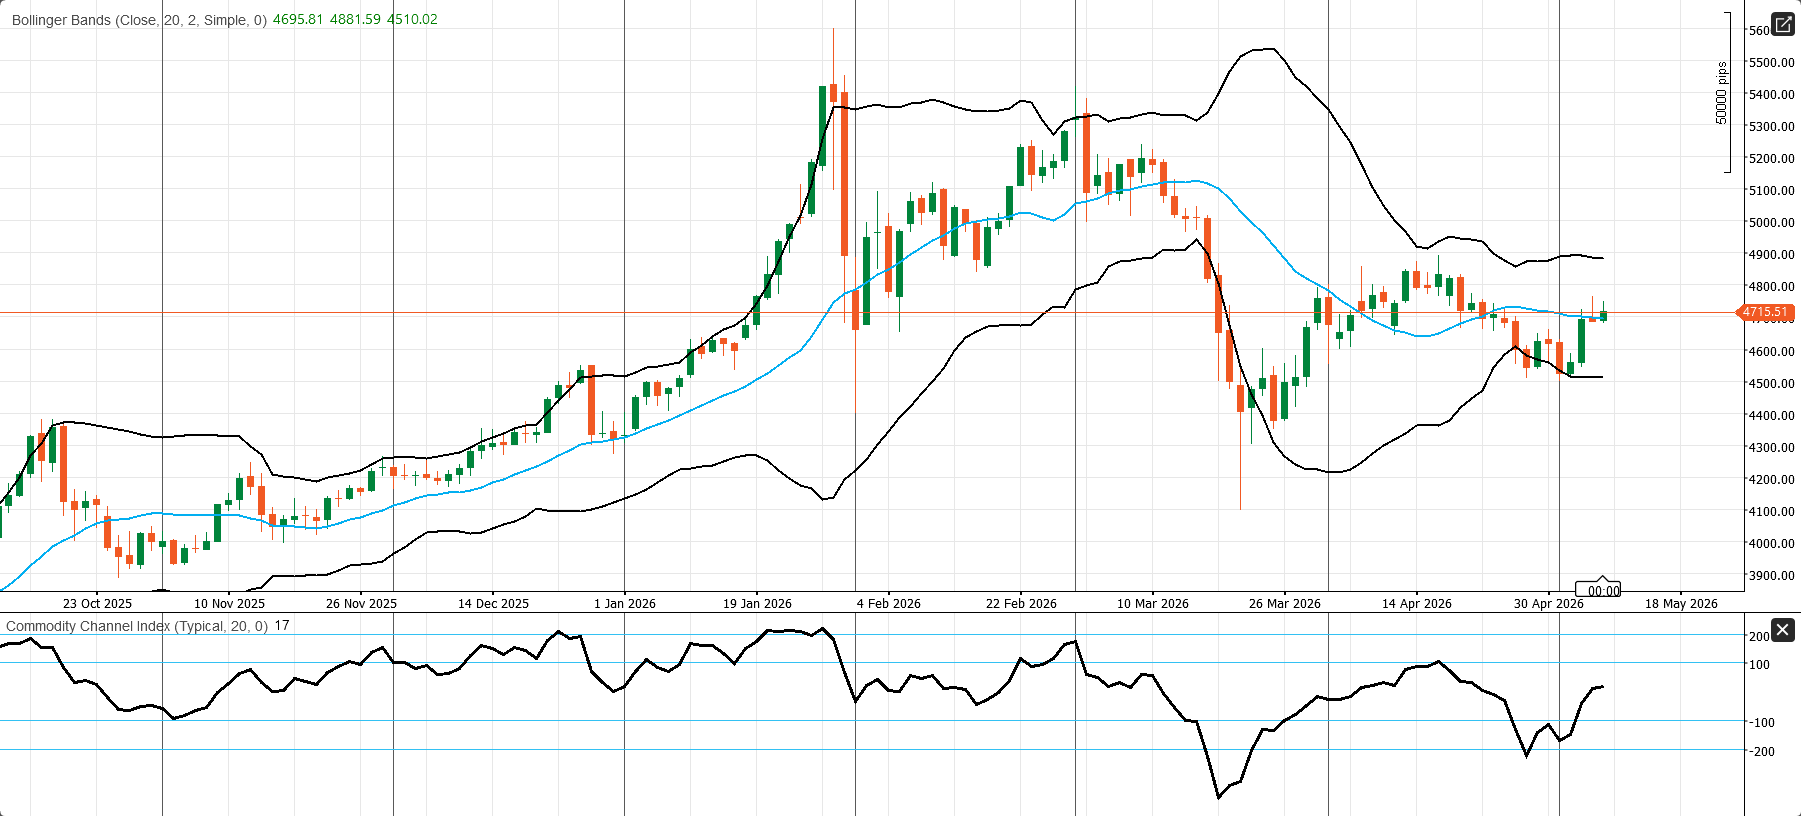
The daily XAU/USD chart shows that gold has moved into a stabilization phase after the late-March rebound and the subsequent pullback. Price is trading around 4,715.51, slightly above the Bollinger middle band at 4,695.81, while still below the upper band at 4,881.59 and comfortably above the lower band at 4,510.02. That positioning suggests the market is no longer in a sharp corrective slide, but it has also not yet regained a clean bullish breakout structure.
From a price-structure perspective, the market is holding the mid-band area as near-term support. That keeps the immediate tone balanced and mildly constructive. The first upside barrier is the 4,750–4,800 zone, while the more important resistance level is the upper Bollinger band near 4,881.59. A clean daily close above that area would strengthen the bullish continuation case and reopen the way toward 5,000 first. On the downside, the first key support sits at the middle band near 4,695.81, followed by the lower band near 4,510.02.
Momentum is neutral rather than aggressive. The CCI is near 17, which indicates that upside momentum exists, but it is not strong enough to signal a fresh impulse move. In practical terms, this is a market trying to base above support, not yet a market in a confirmed breakout trend.
Energy Market and WTI Weekly Outlook:
Diplomacy Versus Disruption Keeps Oil Volatile
I see the energy market entering the week of May 11–16, 2026, in a volatile Neutral-to-Buy condition. Oil is still supported by geopolitical risk, restricted shipping through the Strait of Hormuz, falling U.S. petroleum inventories, and tight refined-product markets. However, this is not a clean bullish breakout because traders are also pricing the possibility of U.S.-Iran de-escalation, demand destruction from high prices, and weaker global consumption. In my view, WTI remains fundamentally supported, but the next move depends heavily on whether diplomacy removes the war premium or Hormuz risk keeps supply fears alive.
Oil had a highly volatile week. Brent and WTI fell sharply when markets began pricing a possible U.S.-Iran peace framework. Brent moved below the $110 area and at one point traded near the low $100s, while WTI dropped toward the $95–$96 range. The previous settlement showed the scale of the selloff: Brent settled at $101.27, down $8.60, or 7.83%, while WTI settled at $95.08, down $7.19, or 7.03%. By Friday, WTI settled at $95.42, up 0.64% on the day, while Brent settled at $101.29, up 1.23%. Still, both benchmarks posted weekly losses of more than 6%, confirming how sensitive the market is to peace headlines and Hormuz-related shipping news.
The core driver remains the Strait of Hormuz. Earlier in the week, oil sold off as traders assumed that a peace framework could eventually normalize commercial shipping and reduce the immediate war-risk premium. But the downside was not clean because the strait remained effectively restricted, and military risks kept returning. Iran reportedly introduced a new tanker protocol requiring ships to complete a “Vessel Information Declaration” before transiting the strait. That increased uncertainty for shipping, insurance, and energy flows, especially for non-compliant vessels.
The security situation also remained unstable. Reports of U.S. military responses to Iranian attacks on three U.S. warships, a disabled Iranian-flagged tanker in the Persian Gulf region, and UAE missile and drone interceptions kept the geopolitical premium active. This is why I do not think oil can fully price a normal supply environment yet. Diplomacy may still be alive, but the physical market cannot remove Hormuz risk until shipping routes become more reliable.
U.S. inventory data gave WTI additional support, although geopolitics remained the dominant driver. U.S. commercial crude inventories fell by 2.3 million barrels to 457.2 million barrels in the week ending May 1. Gasoline inventories dropped by 2.5 million barrels, and distillate stocks fell by 1.3 million barrels. Total commercial petroleum inventories declined by 5.9 million barrels. This matters because crude is not being supported only by geopolitical fear; the U.S. physical market also shows signs of tightening.
The product market is especially important. Gasoline inventories are around 4% below the five-year average, while distillate inventories are about 11% below the five-year average. That keeps refined-product markets tight and supports crude demand through refinery margins. Total products supplied averaged 20.3 million barrels per day over the latest four-week period, up 2.6% from the same period last year. Motor gasoline supplied averaged 9.0 million barrels per day, up 1.0%, and distillate supplied averaged 3.8 million barrels per day, up 3.5%. However, jet fuel supplied was down 6.2% year over year, showing that aviation disruption and high fuel costs are still pressuring part of the demand base.
The biggest bearish counterweight is global demand destruction. The IEA’s April Oil Market Report projected that global oil demand would contract by 80,000 barrels per day in 2026, a major downgrade from the previous expectation of 730,000 barrels per day growth. The IEA also estimated that global demand fell by 800,000 barrels per day year over year in March and by 2.3 million barrels per day in April, as high prices, conflict disruption, and reduced fuel availability hit consumption. This is the main reason I would not chase WTI aggressively at every rally. A supply shock is bullish, but if prices rise too fast and damage consumption, the market starts to price weaker demand.
The EIA’s latest Short-Term Energy Outlook also shows how large the disruption risk remains. It is estimated that production shut-ins in Iraq, Saudi Arabia, Kuwait, the UAE, Qatar, and Bahrain reached 7.5 million barrels per day in March and were expected to rise to 9.1 million barrels per day in April, before falling to 6.7 million barrels per day in May if Strait of Hormuz traffic gradually resumes. The EIA also expects Brent to peak around $115 per barrel in Q2 2026 before easing later as shut-ins slowly decline.
U.S. supply is not responding aggressively enough to remove the premium. Baker Hughes reported that the total U.S. oil and gas rig count rose by one to 548, while oil rigs rose by two to 410, their highest level since mid-April. This is mildly bearish at the margin, but the total rig count is still 30 rigs, or 5%, below the same period last year. The supply response remains too small to offset Persian Gulf risk.
For the week ahead, I will watch U.S. CPI on Tuesday, May 12, PPI on Wednesday, May 13, and retail sales plus import/export prices on Thursday, May 14. These releases matter because oil is now directly linked to inflation expectations, Fed pricing, the U.S. dollar, Treasury yields, and consumer demand.
My final view is that WTI remains in volatile consolidation with upside risk. As long as WTI holds above $92–$90, the broader structure stays constructive. A break above $100 would confirm renewed bullish momentum, especially if Hormuz tensions escalate. A break below $90 would suggest the market is removing geopolitical premium faster than expected.
WTI Technical Analysis
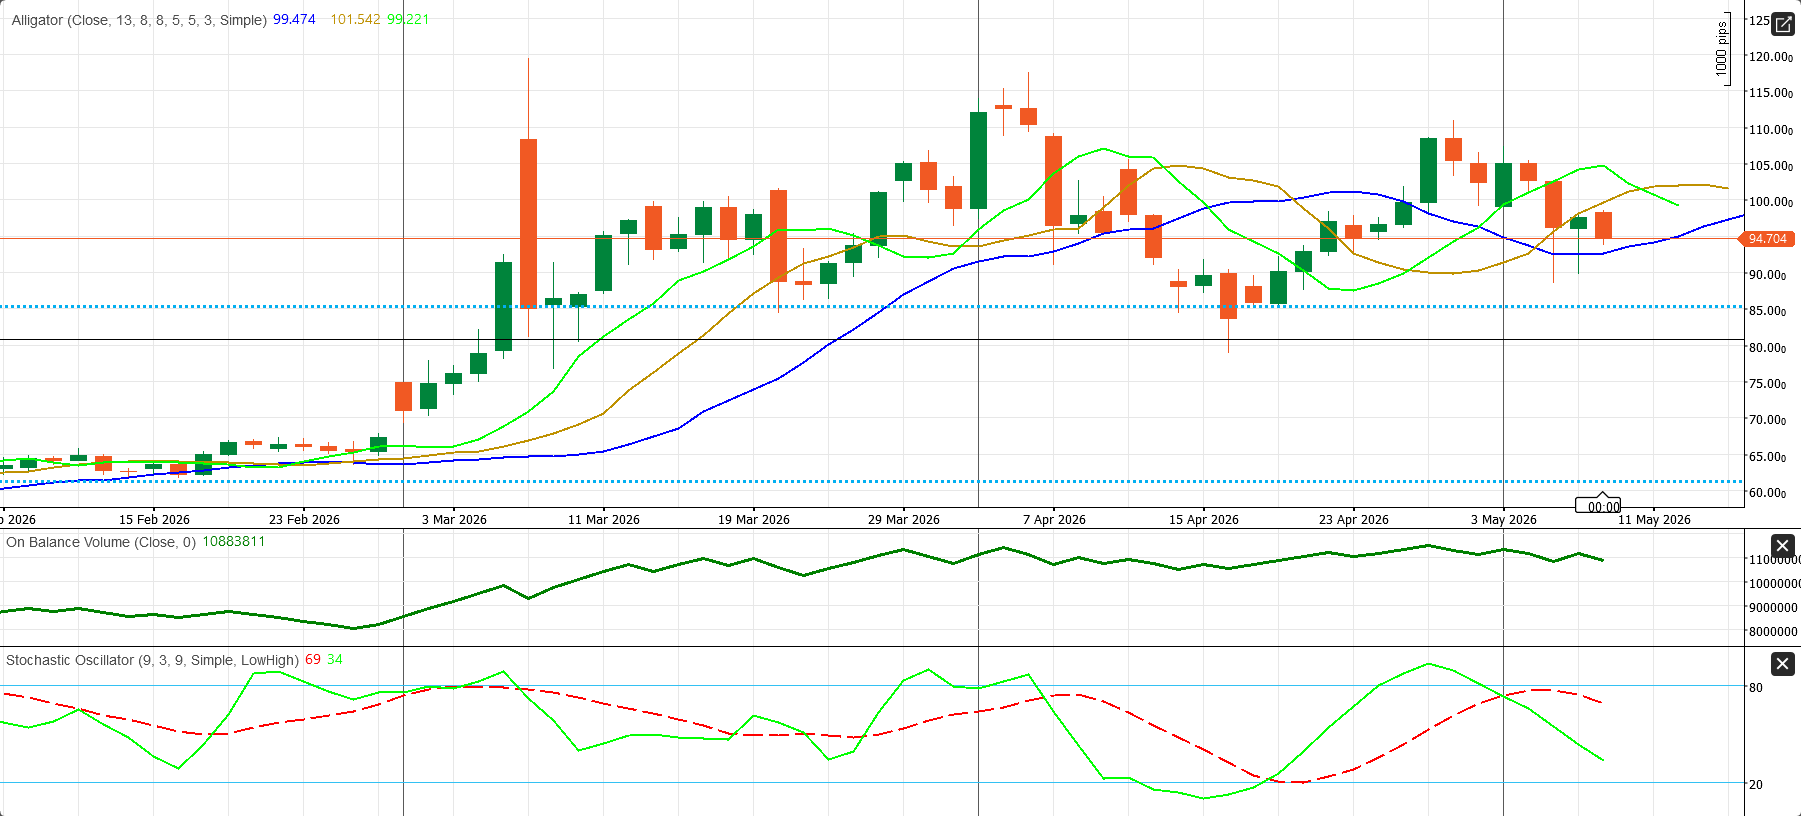
The daily WTI chart shows a market that has lost the cleaner recovery structure seen earlier and is now trading back below its main dynamic trend guides. Price is around 94.70, while the Alligator jaw sits near 99.47, the teeth near 101.54, and the lips near 99.22. With price below all three lines, the immediate structure remains weak, and rallies are still vulnerable to selling pressure.
From a price-structure perspective, the market has rebounded from the 85.00 area but has so far failed to re-establish itself above the broader 99.00–101.50 resistance cluster. That keeps 94.70–95.00 as the immediate pivot zone. If WTI cannot build above that area, the chart keeps pointing toward 90.00 first, followed by the more important support zone near 85.00–86.00. On the upside, the first real barrier remains the Alligator cluster, and only a sustained move back above 99.20 would materially improve the technical picture.
The supporting indicators argue for caution rather than conviction on the long side. On-Balance Volume remains elevated compared with the January base, but it has flattened and rolled over from the recent highs, which suggests that accumulation has cooled. At the same time, the stochastic oscillator is rebounding, with the fast line above the signal line, but the move still looks more like a recovery attempt inside a weak structure than a confirmed bullish reversal. In practical terms, the chart favors a mildly bearish stance unless price can reclaim the Alligator resistance band.
Crypto Market Condition Weekly Outlook:
Bitcoin Holds the Trend, but CPI, ETF Flows, and Hormuz Risk Will Decide the Next Move
I see the crypto market entering the week of May 10–16 in a Neutral but improving condition, with Bitcoin still holding a constructive medium-term trend but facing a more fragile short-term sentiment setup. Bitcoin has defended the psychologically important $80,000 area, but the market is no longer trading with a clean risk-on structure. The next major move will depend on four main drivers: U.S. inflation data, ETF flows, broader risk appetite, and U.S.-Iran geopolitical headlines around the Strait of Hormuz and the Persian Gulf.
Bitcoin finished the previous week with a mixed but still resilient profile. BTC fell on Friday as renewed U.S.-Iran tensions pressured high-beta assets, trading around $79,840–$79,899 and briefly slipping below $80,000. However, despite that daily pullback, Bitcoin still gained about 1.3% for the week, marking its sixth consecutive weekly gain. That matters because it shows that buyers are still defending the broader uptrend, even when short-term sentiment weakens.
My current Bitcoin view is Neutral-to-Buy, but not a clean momentum breakout. BTC is trading around $80,136, while ETH is near $2,307. As long as Bitcoin holds above key support around the $80,000 area, I would treat dips as opportunities rather than signs of a confirmed breakdown. However, I would avoid chasing Bitcoin aggressively near resistance unless ETF inflows recover and U.S. CPI supports a lower-yield, weaker-dollar environment.
The main support for Bitcoin continues to come from institutional demand, ETF inflows, and improving regulatory sentiment. Bitcoin gained nearly 12% in April, its best monthly performance in a year, helped by capital inflows into U.S.-listed spot Bitcoin ETFs. SoSoValue data showed net ETF inflows of $1.97 billion in April, the strongest monthly inflow since October 2025. This is an important bullish signal because it confirms that institutional investors remain willing to allocate capital to Bitcoin during pullbacks.
However, ETF demand is supportive, not one-way. Farside data showed strong inflows earlier in the week, including $467.3 million on May 5 and $46.2 million on May 6, before flows turned negative with $268.5 million of outflows on May 7 and another $20.9 million outflow on May 8. CoinShares also reported $117.8 million of inflows into digital asset investment products, marking a fifth consecutive positive week, but participation narrowed, and sentiment weakened late in the week. Bitcoin led with $192.1 million of inflows, while Ethereum saw $81.6 million of outflows.
This creates a mixed institutional picture. Capital is still entering the crypto market, but momentum is no longer broad or automatic. Bitcoin needs renewed ETF inflows to challenge the $80,000–$82,000 resistance zone more convincingly. If ETF outflows continue, traders may treat the recent move above $80,000 as a failed breakout attempt.
The biggest macro event for crypto this week is the U.S. CPI report on Tuesday, May 12. CPI matters because Bitcoin is still trading like a high-beta macro asset, not a pure safe haven. A soft CPI print would likely support BTC by lowering Treasury yields, weakening the U.S. dollar, and reviving the idea that the Federal Reserve can eventually ease policy. A hot CPI print, especially in core services, shelter, and sticky inflation categories, would be negative because it could push yields higher, strengthen the dollar, and reduce appetite for speculative assets.
The market will also watch PPI on Wednesday, import/export prices and retail sales on Thursday, and broader Wall Street sentiment. If inflation stays hot while retail sales weaken, crypto could face a difficult stagflation-style setup: higher yields, weaker consumption, and lower risk appetite. If CPI cools and retail sales remain stable, Bitcoin and crypto equities could benefit from a renewed soft-landing narrative.
Geopolitics is another major driver. Renewed U.S.-Iran tensions around the Strait of Hormuz and the Persian Gulf hit crypto sentiment late in the week. Bitcoin and altcoins traded like risk assets, not safe havens. This is important because it confirms that crypto remains sensitive to liquidity, equity sentiment, oil prices, and macro risk. If tensions ease, crypto can recover quickly because ETF demand and regulatory progress remain supportive. But if tensions escalate and oil prices rise sharply, crypto could face renewed selling as investors reduce exposure to speculative assets.
Altcoins remain weaker than Bitcoin. Ether traded near $2,284.75, down around 1.96%, while XRP was near $1.3838, down around 2.69%. Solana traded around $88.4, and Cardano was near $0.2635. Dogecoin fell around 4%, showing that memecoins remain more vulnerable when risk appetite weakens. My altcoin view is Neutral-to-Sell Bias until Bitcoin breaks higher with stronger volume and ETF confirmation.
Regulation produced both positive and negative signals. On the positive side, Circle Internet Group surged 16.1% after investors welcomed a bipartisan compromise on stablecoin legislation. The framework looks restrictive but not destructive, and it could improve institutional confidence in stablecoin issuers, payment rails, and compliant exchanges. Coinbase also benefited from the stablecoin momentum.
On the negative side, Binance returned to the center of regulatory risk. The U.S. Treasury reportedly demanded stronger compliance with a monitoring program linked to Binance’s 2023 sanctions and anti-money-laundering violations. Reports that more than $1 billion in crypto allegedly moved through Binance to Iran-linked entities in 2024 and 2025 added pressure. BNB fell around 1.6%–1.7% near $638, and I see BNB with a Sell Bias until compliance risk clears.
Company-specific risks also matter. Strategy purchased $2.54 billion worth of Bitcoin, but its first-quarter operating loss of $14.47 billion, driven mainly by unrealized digital-asset losses, raised concerns. The company held 818,334 Bitcoin as of May 3, with a market value of $64.14 billion and an average cost of around $75,537. Michael Saylor’s comment that Strategy may sell some Bitcoin to fund dividends also reduced the strength of the bullish narrative.
Overall, I see crypto as Bitcoin-led resilience with rising short-term risk. BTC remains constructive above $80,000, but the market needs soft CPI, renewed ETF inflows, and calmer geopolitical conditions to extend the rally. My strategy is to buy on dips above key support but avoid chasing near resistance until macro and ETF confirmation improves.
BTCUSD Technical Analysis
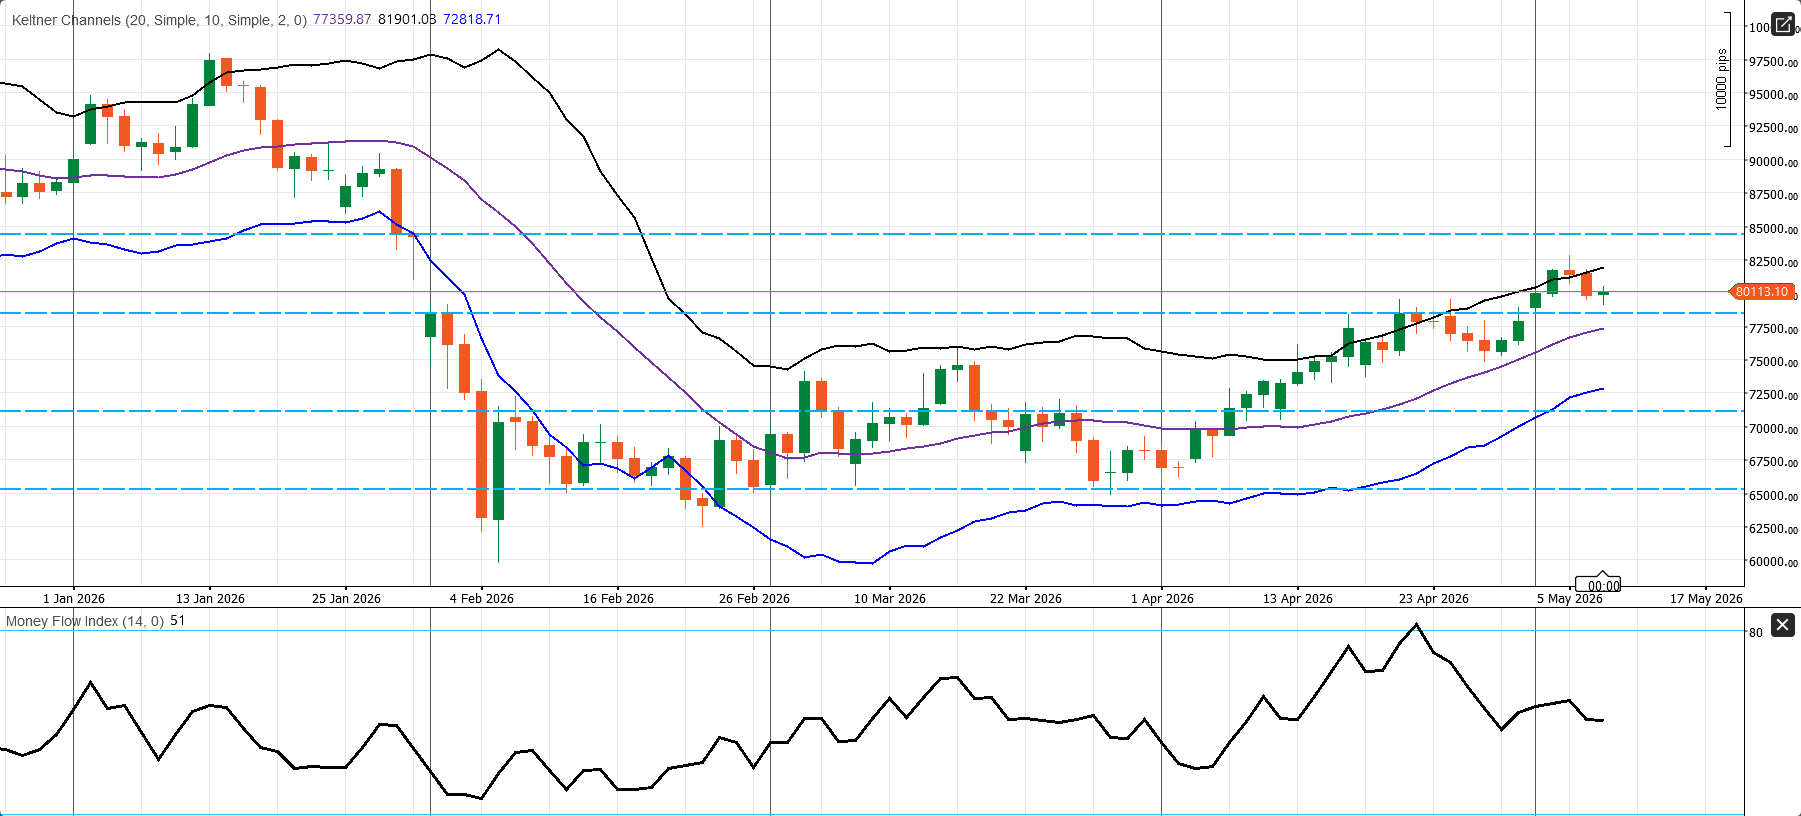
The daily BTC/USD chart remains constructive, but the market is no longer in an early-stage recovery. Price is trading around 80,113.10, above the Keltner middle line at 77,359.87 and well above the lower band at 72,818.71, while still below the upper band at 81,901.08. This positioning shows that bitcoin is still trading in the upper half of its recent trend channel, which keeps the broader bias positive.
The chart structure also shows a strong rebound from the late-March and early-April base, followed by a push back into the 80,000–82,000 area. That zone is now the immediate resistance band. A clean daily break above 81,900–82,000 would strengthen the bullish continuation case and open room toward 85,000 first. On the downside, the first important support is the 77,300–77,500 region around the Keltner midline, while the broader support zone remains closer to 72,800.
Momentum is supportive, but not aggressive. The Money Flow Index is at 51, which suggests that buying pressure is still present, yet no longer overheated. In practical terms, the chart favors a cautiously bullish stance, but it also says that the market needs a confirmed push through overhead resistance rather than a blind chase under it.
Comments