 English
 پارسی


Watch the Analytical Video
USA
This week’s data echoed the familiar theme of an economy still powered by high-tech and AI-linked investment, but with growing signs that momentum may be spreading more broadly; at the same time, trade flows look less supportive, underscoring that not every sector is moving in lockstep. Consumer confidence likely ticked up in February from January’s decade low as cooler inflation and a steadier job market offered some relief, even though high living costs and geopolitical risks continue to weigh on sentiment. Construction spending likely firmed into year-end, but the composition remains uneven—data-center projects are still doing most of the heavy lifting, while residential building and broader structures investment are expected to stay soft as elevated interest rates and uncertainty constrain activity.
U.S. Week in Review
The past week’s data painted a more nuanced U.S. picture: headline growth cooled, inflation stayed uncomfortably firm, and the investment cycle showed early signs of broadening beyond AI, even as trade became less supportive.
Growth and GDP: a downshift on the surface, steadier domestic demand underneath. Fourth-quarter GDP printed at 1.4% (QoQ saar)—well below consensus—reflecting drags from government spending and a trade mix that was less helpful to the headline. But the more stable “core” domestic demand signal—real final sales to private domestic purchasers—held up at ~2.4% (saar) in Q4, suggesting the underlying engine is closer to last year’s pace once you strip out volatile components like government, inventories, and net exports.
Investment and production: AI is still the centerpiece, but it’s no longer the only story. Equipment investment strength has been heavily concentrated in information processing (computers/communications/semiconductors), masking softness in more traditional capex categories. This week, however, incremental signals hinted that the imbalance may be easing: core capital goods orders stabilized, and shipments improved, and manufacturing output accelerated to its strongest monthly pace in roughly a year—importantly, output excluding high-tech also logged its best gain in about 12 months. The implication is constructive: a broader capex cycle would make growth less dependent on a single sector carrying the load.
Trade: shifting from tailwind to mild headwind, but the headline is noisy. December trade data showed a wider deficit, driven by higher imports and softer exports—mechanically a negative for growth arithmetic as imports normalize. That said, a meaningful portion of the deterioration was tied to non-monetary gold flows, which are excluded from GDP accounting and often reflect portfolio/asset reallocation rather than end-demand. Even after adjusting for those distortions, the broader takeaway remains: trade looks less supportive than it has been, and ongoing tariff/legal uncertainty keeps the external backdrop a swing factor rather than a steady tailwind.
Consumers: still spending, but composition looks more defensive—and confidence may be stabilizing. Real consumption growth in Q4 ran ~2.4% (saar), driven mainly by services, while goods were softer. Within services, resilience appears concentrated in more non-discretionary categories (healthcare, housing & utilities, financial services), while more discretionary segments lagged—consistent with a consumer that’s holding up, but becoming more selective. In that context, consumer confidence likely ticked up modestly in February from January’s decade low as inflation cooled at the margin and the labor backdrop stayed supportive—though high living costs and geopolitical risks remain a persistent drag.
Inflation: “sticky” in the Fed’s preferred gauge. The most market-relevant inflation signal this week was the re-acceleration in core PCE to +0.4% MoM / 3.0% YoY, with headline PCE also running hot. Adding to the discomfort, the GDP price index remained elevated even as growth was marked down—an awkward mix for a clean disinflation narrative and a key reason the “higher-for-longer” policy frame retains credibility.
Labor and activity: tight at the margin, but the pulse cooled a bit. Initial jobless claims stayed low (around 206K), consistent with limited near-term layoff pressure, while activity surveys stayed in expansion territory even as they eased. Flash PMIs remained above 50, and the Philadelphia Fed headline improved, though internals (notably employment) were mixed—consistent with a slower, uneven normalization rather than a sharp deterioration.
Housing and construction: activity firmed, demand signals choppy. Housing starts and permits surprised to the upside, but forward demand indicators were less clean—pending sales slipped, and new home sales eased after a prior surge. Construction spending likely improved into year-end, yet remains uneven under the hood: data-center projects continue to do most of the heavy lifting, while residential and broader structures spending stays constrained by high rates and uncertainty.
Energy: large inventory draws add an inflation-sensitive wrinkle. Weekly petroleum data showed sizable draws across crude and products alongside lower imports and higher refinery utilization—supportive for oil and potentially relevant for near-term inflation psychology. Rig counts were broadly flat, implying no clear near-term acceleration in supply growth from the rig data alone.
Policy, rates, and flows: higher-for-longer remains the baseline. Fed communications stayed biased toward maintaining restrictions if inflation doesn’t cooperate, and the broader rates/liquidity backdrop remains a key transmission channel for risk assets and USD strength. Separate flow and funding signals were mixed—steady at the very front end, softer in some longer-duration appetite measures—leaving markets sensitive to the next inflation and activity prints.
Bottom line: This week wasn’t a “reversal” story—it was a rebalancing story. Headline growth cooled, but the domestic core looks steadier than the GDP number implies; AI-led investment remains a pillar, yet the data are starting to hint at broader participation in production and capex; and trade is turning from a tailwind into a mild headwind as imports normalize. The main macro tension is that inflation is still sticky, which keeps the Fed’s restrictive stance credible—and keeps the next leg for markets dependent on whether disinflation reasserts itself without a sharper growth downdraft.
U.S. Economic Outlook — Week of Feb 23–27, 2026
The U.S. enters the new week with a “cooling growth / sticky inflation” mix. The Q4 slowdown in headline GDP has sharpened the market’s focus on whether the economy is actually decelerating or simply rebalancing, while recent inflation signals (especially in the Fed’s preferred measures) keep the “higher-for-longer” policy bias credible. Beneath the surface, the key structural question remains whether momentum continues to broaden beyond high-tech/AI-led investment—or whether strength stays concentrated and therefore more fragile.
One important housekeeping note: despite many market calendars flagging “GDP revisions” in late February, the official schedule shows the next BEA GDP release (Q4 2025 second estimate) on March 13, 2026, not this week.
What matters most this week
1) Inflation repricing risk (rates + USD)
The week’s main “macro catalyst” is producer prices (PPI) on Friday. With inflation still proving sticky, another firm pipeline print can re-tighten financial conditions quickly via higher front-end yields and a stronger dollar.
2) Is growth slowing—or rotating?
Hard activity data (factory orders, durable goods, jobless claims) and regional surveys will shape whether the market treats Q4’s downshift as a signal or noise.
3) The consumer pulse
After January’s sharp confidence drop (to 84.5, the weakest since 2014), the February Conference Board print is the cleanest near-term read on household risk appetite—especially as “jobs hard to get” perceptions rose, and the labor differential weakened.
4) Rates-sensitive channels: housing + construction
This is a critical week for housing prices, new home sales, and construction spending—all key transmission channels for restrictive rates. Construction will likely stay bifurcated: data-center/AI infrastructure remains a tailwind, while residential and broader structures can stay capped by high rates and uncertainty. Construction spending for November and December is scheduled for Friday.
High-impact calendar (ET)
Monday, Feb 23
- Factory Orders (Dec) — 10:00 ET.
- Federal Reserve Bank of Dallas Texas Manufacturing Outlook Survey — next release Monday, Feb 23 (publishing begins 9:30 CT ≈ , 10:30 ET).
Why it matters: first “tone-setter” for manufacturing demand and pricing pressure.
Tuesday, Feb 24
- S&P CoreLogic Case-Shiller Home Price Index (Dec) — 9:00 ET.
- The Conference Board Consumer Confidence (Feb) — 10:00 ET.
- Federal Reserve Bank of Richmond Manufacturing Index (Feb) — 10:00 ET.
Why it matters: Confidence is the market’s best near-term proxy for spending psychology; Richmond helps confirm whether manufacturing softening is spreading.
Wednesday, Feb 25
- New Home Sales (Jan) — 10:00 ET.
- Energy Information Administration Weekly Petroleum Status Report — 10:30 ET.
Why it matters: Housing is the cleanest rate transmission channel; oil/gasoline pricing feeds directly into inflation expectations.
Thursday, Feb 26
- Durable Goods Orders (Jan, advance) — 8:30 ET.
- Initial Jobless Claims — 8:30 ET.
Why it matters: Durable goods are your capex pulse (watch ex-transport/aircraft for signal); claims anchor the “cooling vs still-tight” labor debate.
Friday, Feb 27
- PPI (Jan) + Core PPI — 8:30 ET.
- Chicago PMI (Feb) — 9:45 ET.
- Construction Spending (Nov; delayed releases include Nov/Dec) — 10:00 ET.
Why it matters: PPI is the week’s inflation “make-or-break”; construction confirms whether nonresidential strength is still being carried by AI/data-center buildouts while residential remains rate-constrained.
Base case and risk scenarios
Base case (most likely): choppy, but still expansionary
- Growth data likely prints “mixed”: not strong enough to revive overheating fears, not weak enough to validate a sharp slowdown.
- Inflation remains the bigger market driver: PPI is the event risk that can push yields and the USD higher and tighten conditions.
Upside risk (stronger growth rotation):
- Consumer confidence rebounds meaningfully, durable goods ex-transport firms, and regional surveys stabilize—supporting the narrative that activity is broadening beyond AI.
Downside risk (stagflation-leaning):
- Hot PPI + soft confidence/durables = tighter financial conditions into softer demand—raising recession-tail chatter even if labor doesn’t crack immediately.
Wall Street and US Dollar Outlook
The week was defined by a USD bid and equity pressure, especially in tech: sticky inflation + hawkish Fed tone outweighed the growth downgrade in price action. If upcoming data reinforces inflation persistence (or oil stays bid), the setup favors continued USD resilience and choppy equities, with the Nasdaq most vulnerable.
USD: Firm on hawkish Fed signals and sticky inflation
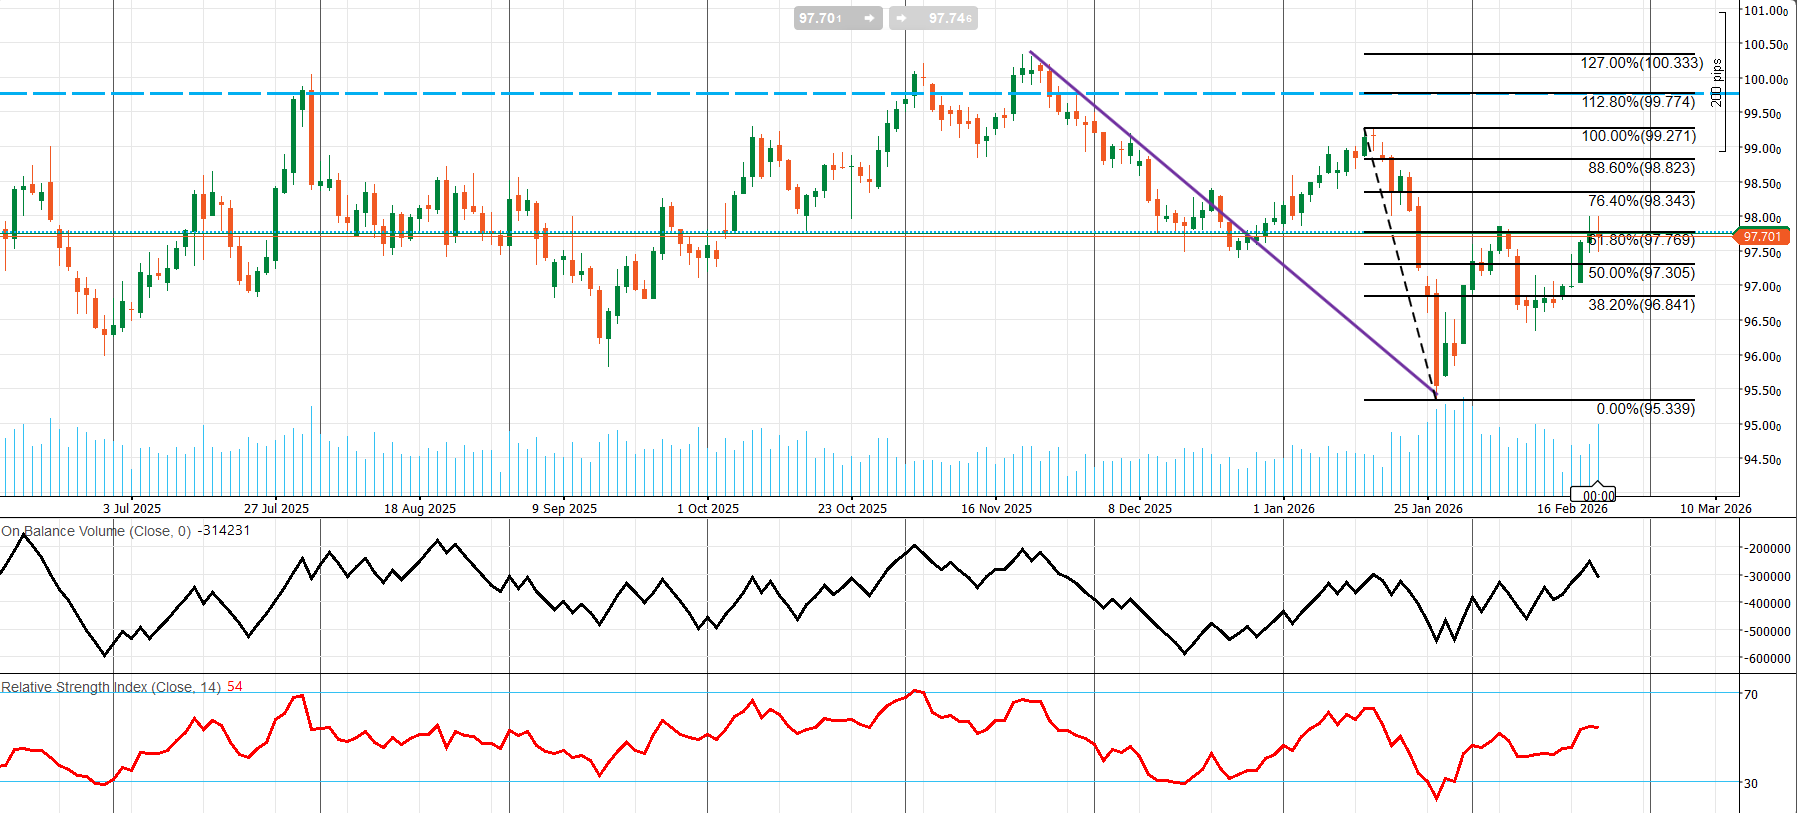
The U.S. dollar strengthened over the past week as markets leaned more decisively into a restrictive Fed narrative. The U.S. Dollar Index gained roughly ~1% on the week, with DXY futures ending near 97.70 on Friday, reflecting renewed demand for USD exposure. The tone from the latest Fed minutes was modestly hawkish: policymakers remain divided, but several emphasized a higher-for-longer stance, and some signaled openness to additional hikes if inflation fails to cool—supportive for front-end yields and the dollar. That message was reinforced by inflation data that pushed back against quick-cut expectations, with core PCE running hot at +0.4% MoM / 3.0% YoY and headline PCE at +0.4% MoM / 2.9% YoY. The main counterweight remains the growth side: national accounts signals cooled sharply (Q4 GDP revised down to 1.4% and final sales to 1.2%), which can cap USD upside if markets begin to price a more meaningful slowdown. For now, however, inflation persistence has outweighed the growth downgrade in FX pricing.
USD technical view (DXY, daily): repair phase, approaching a key decision zone
Technically, DXY remains in a repair / base-building phase after a sharp late-January drawdown into 95.339, followed by a fast rebound. Over the last ~8 months, price has largely oscillated in a broad 95.3–100.3 range, with 97.7–98.0 repeatedly acting as a high-importance pivot (“gravity zone”). The rebound also broke the prior downtrend line from the mid-November high—an early sign of trend repair—but the structure is not yet a confirmed uptrend. Price pulled back after the rebound and is now attempting to reclaim the mid-range.
Momentum and participation indicators are constructive but not decisive: RSI(14) ~54 sits in neutral-to-slightly-bullish territory (not overbought), implying room for continuation if resistance gives way, while OBV has been recovering since the January low—consistent with the idea that the selloff was largely exhaustive and that accumulation is rebuilding on the bounce.
Key levels (Fibonacci from 95.339 low to 99.271 high)
Price is trading around 97.70, sitting just beneath a critical retracement cluster. The tactical read is simple: holding the 50% retracement keeps the rebound intact; clearing the 61.8% level upgrades the upside probabilities.
Support/pivot zone
- 97.305 (50%): primary “line in the sand” for the rebound structure
- 96.841 (38.2%): next support if 97.305 fails
- 95.339 (0%): January swing low/key downside reference
Resistance ladder
- 97.769 (61.8%): immediate decision point (current test zone)
- 98.343 (76.4%): next upside checkpoint
- 98.823 (88.6%): pre-high resistance
- 99.271 (100%): swing high/major cap
- 99.774 & 100.333 (extensions): upside targets if the swing high breaks
Bottom line: the USD has been supported by hawkish Fed tone + sticky inflation, and technically DXY is pressing into 97.77 (61.8%), the near-term inflection point. A sustained reclaim of 97.77 → 98.34 would signal stronger upside continuation; failure to hold 97.31 would shift focus back toward 96.84 and potentially the 95.34 low.
US Equities: Broad Weekly Pullback, Nasdaq Led the Declines
U.S. stocks finished the week lower across the board, with tech and other duration-sensitive segments taking the largest hit. The S&P 500 fell 1.4%, the Nasdaq Composite dropped 2.1%, and the Dow Jones Industrial Average lost 1.2%. Futures reflected the same risk tone, with Nasdaq 100 futures at times leading declines (around -0.8%) versus S&P (-0.5%) and Dow (-0.3%).
What drove the tape
The macro impulse was a classic “rates problem” for equities. A hot core PCE print combined with hawkish-leaning Fed minutes reinforced the higher-for-longer narrative, keeping upward pressure on yields and compressing multiples—especially in mega-cap tech, which helped explain the Nasdaq’s underperformance. Growth signals, meanwhile, turned more mixed: the sharp Q4 GDP downgrade and softer “final sales” raised questions about underlying demand momentum, but markets largely interpreted the week’s combination as policy staying tight, not an imminent pivot. Adding to that, the U.S. labor backdrop remained resilient, which can strengthen the Fed’s ability to hold a restrictive stance for longer.
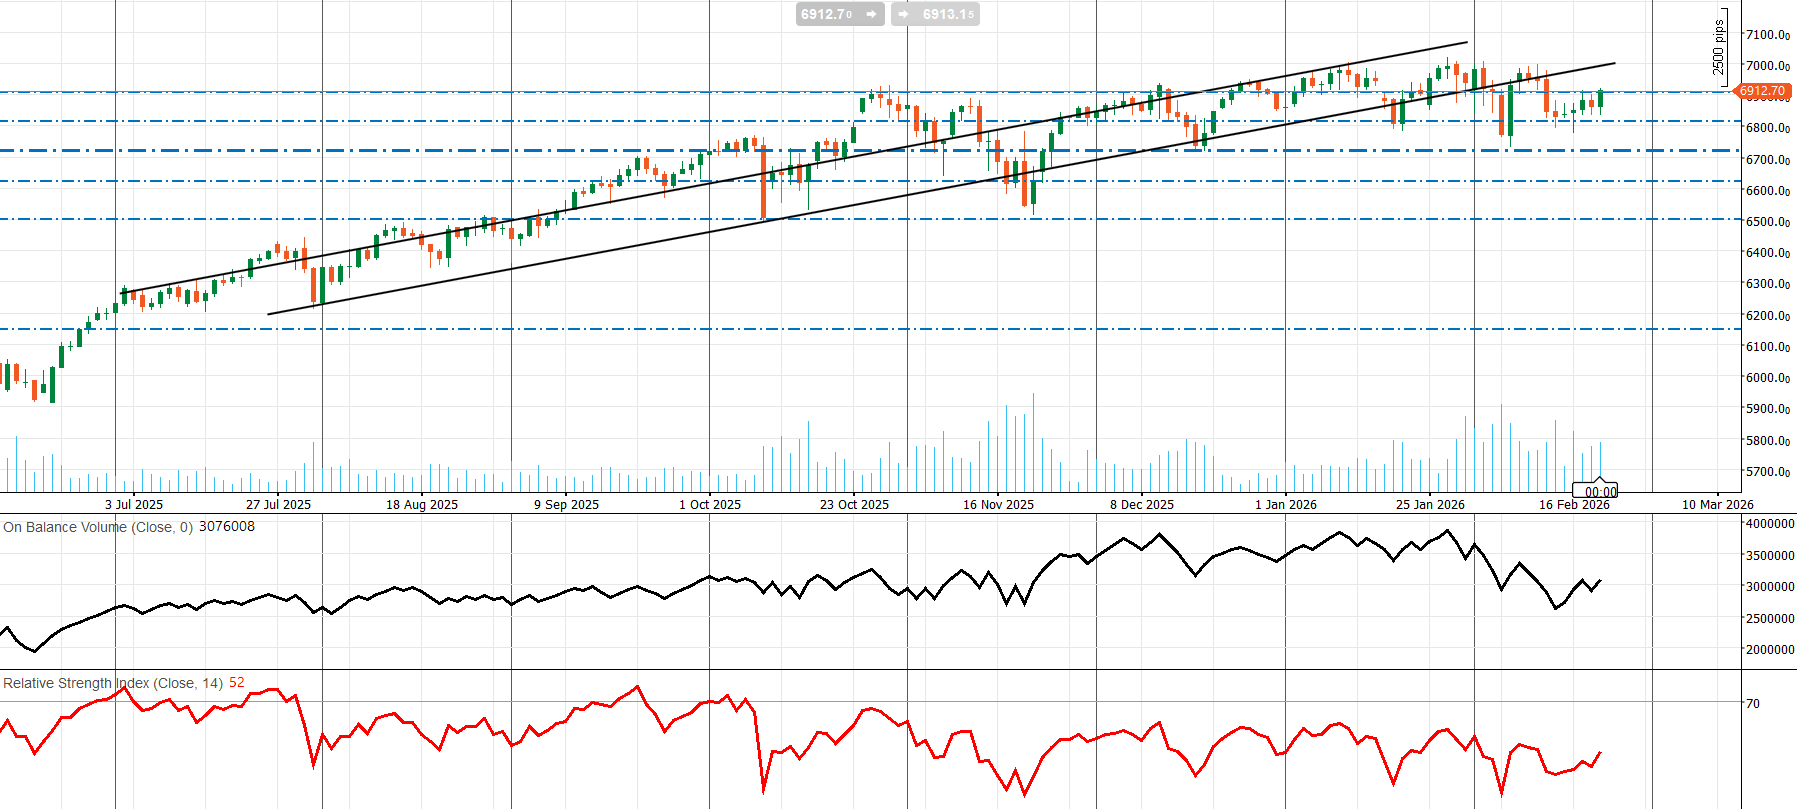
S&P 500 technical picture: bullish structure, muted momentum
Technically, the S&P 500 remains structurally bullish with its rising channel intact, but price action is best described as a high-level consolidation rather than a fresh uptrend leg. The market is not breaking down, but it is failing to break out—a late-cycle pattern where trend remains positive while momentum softens. Indicators support that read: RSI near 52 and OBV behavior are consistent with consolidation/mean-reversion rather than strong trend continuation until a boundary level resolves.
Price action and volume: volatility shock, then choppy follow-through
The late-January/early-February selloff and rebound—accompanied by elevated volume—looks like a volatility shock (forced de-risking / stop runs) followed by dip-buying. The lack of clean follow-through since then suggests the index is still in a “decision phase,” which typically resolves in one of two ways: a breakout if resistance breaks and holds, or a range failure if key support gives way.
Key levels to watch
Resistance
- ~7000: psychological level + recent highs + channel pressure (breakout trigger)
- ~7100: next upside zone if 7000 breaks and holds
Support
- ~6800: critical “must-hold” support (major reaction level + channel support)
- ~6700: next structural shelf
- ~6600: deeper range support
- ~6200: major longer-term reference level
Bottom line: equities sold off as inflation and Fed tone kept yields firm, with tech bearing the brunt. Technically, the S&P remains in an uptrend structure-wise, but the market needs a decisive resolution—7000 for upside confirmation or 6800 as the key breakdown line.
EU
We expect a modestly constructive growth tone, but with markets demanding confirmation. If ifo and ESI improve and HICP final doesn’t surprise higher, the market can lean further into a “stabilization + disinflation” mix—supportive for Bunds and potentially a less defensive EUR reaction function. If confidence fails to follow the PMI rebound and CES expectations soften, the takeaway shifts to “PMI bounce, but inflation/gravity still dominates,” keeping the ECB debate tilted toward growth sensitivity and keeping EUR upside capped by a cautious domestic story.
EU Economy Weekly Review:
Manufacturing Improves, But Confidence and Price Signals Stay Soft
Europe’s data flow this week tilted modestly more constructively on near-term growth, led by a clear improvement in manufacturing momentum—yet the broader macro tone remains cautious. Household and investor sentiment stayed fragile, and upstream pricing signals continued to lean disinflationary, keeping the policy debate squarely focused on growth sensitivity rather than inflation urgency.
Activity and growth momentum
The key positive development was the Eurozone flash PMI rebound. Manufacturing moved back into expansion territory at 50.8 (from 49.5), while services held in expansion at 51.8, and the composite improved to 51.9—a meaningful shift given that manufacturing has been the region’s persistent laggard. The improvement was not uniform: Germany looked notably stronger (composite 53.1, manufacturing 50.7) while France remained slightly contractionary on the composite (49.9) as manufacturing slipped back to 49.9.
“Hard” activity data, however, stayed mixed. Industrial production fell -1.4% MoM in December while remaining +1.2% YoY, consistent with continued volatility around year-end rather than a smooth acceleration. One encouraging green shoot was construction output, which rebounded +0.88% MoM in December after a prior decline—important because construction is a rate-sensitive channel that should benefit most from easing financial conditions.
Sentiment: still cautious
Confidence indicators did not confirm a decisive upswing. Eurozone consumer confidence stayed weak at -12.2 (Feb, preliminary)—only marginally better than the prior reading and below expectations—suggesting households remain careful with discretionary spending. The investor-side read from ZEW also cooled: Eurozone sentiment fell to 39.4, and Germany’s expectations eased to 58.3, even as Germany’s current conditions improved to -65.9 (less negative).
Inflation and pipeline pressures: disinflation is still doing work
Pricing signals stayed soft and broadly consistent with ongoing disinflation pressure. Germany’s CPI held at 2.1% YoY (HICP also 2.1% YoY) while HICP fell -0.1% MoM, reinforcing the “not re-accelerating” inflation narrative. More importantly for the pipeline, Germany’s PPI undershot sharply at -0.6% MoM / -3.0% YoY, pointing to continued factory-gate disinflation/deflation pressure. France remained a disinflation anchor inside the bloc, with CPI 0.3% YoY and HICP 0.4% YoY, and both negative on the month.
External balances: surplus remains a macro cushion
The external backdrop remained supportive: the Eurozone current account surplus widened to €14.6B in December (seasonally adjusted), reinforcing the region’s external-balance cushion—even if growth remains uneven domestically
Rates and funding: core demand steady, peripherals mixed
Funding signals were broadly contained. Germany’s 10Y Bund auction cleared at 2.730%, down from the prior 2.850%, consistent with decent core demand and contained term-premium pressure. Spain’s auctions were mixed—5Y yields rose to 2.577% while 10Y eased to 3.167% and 3Y fell to 2.273%—suggesting localized repricing rather than a uniform shift in risk appetite. France’s short-bill yields held near ~2%, pointing to stable short-end conditions.
What does this mean for the ECB and EUR?
This week reads as “growth pulse improving, inflation pressure easing.” The PMI rebound—especially Germany’s manufacturing turn—raises the odds of stabilization, but sentiment remains too weak to declare a confident upswing, and the softness in PPI/inflation measures argues against a renewed inflation scare. Net-net, the data keeps the ECB’s reaction function growth-sensitive, and leaves markets focused on whether the PMI improvement can translate into firmer hard data in the next run of releases.
Euro Area Week Ahead:
Manufacturing Bounce vs. Inflation Reality Check
The euro area heads into the week with a clearer growth pulse on surveys—most notably, manufacturing has pushed back above the 50-line—while the broader backdrop remains constrained by soft price dynamics and still cautious consumers. The market’s core question is straightforward: does February’s PMI improvement represent the start of a more durable upswing (especially in Germany), or is it a short-lived bounce that fades once hard data and disinflation reassert themselves?
Macro setup for the week
Survey momentum has improved, with the latest flash PMIs indicating that manufacturing is no longer the region’s persistent laggard and that overall activity remains in expansion. The nuance is country dispersion: Germany appears to be doing the heavy lifting, while France’s tone is still soft—an imbalance that matters for both confidence and the EUR narrative because it increases the odds of uneven policy transmission and uneven growth outcomes across the bloc.
At the same time, the inflation backdrop is evolving in a way that keeps the policy debate growth sensitive. Rather than worrying about “re-acceleration,” markets are increasingly watching for evidence that disinflation could run too far—especially if pipeline pricing stays weak and consumers remain hesitant. The European Commission’s flash read already signaled that consumer confidence remains below its long-run average, even if it has stabilized slightly.
The week’s catalysts: what can validate (or fade) the PMI rebound
Monday, Feb 23 — Germany sentiment + ECB messaging
The first major checkpoint is the Ifo Business Climate for February, which is often the cleanest near-term read on corporate sentiment after a PMI turn. A firm ifo print would strengthen the “manufacturing corner turn” story; a miss would raise the odds that PMI strength was more noise than signal.
The same day, Christine Lagarde speaks in Washington at a NABE event (Volcker award remarks). Markets will parse how she frames the PMI rebound versus the ongoing disinflation risk—this is the type of communication that can move Bunds and the EUR without any single data print doing the work.
Wednesday, Feb 25 — Inflation confirmation + Governing Council (non-monetary)
The key data item is the euro area’s seasonally adjusted HICP release for January (final/full set). With inflation already trending lower, confirmation (or revision) matters for near-term rate pricing and for whether markets feel comfortable leaning into an easing-friendly interpretation of the data.
Also on Wednesday, the **European Central Bank Governing Council holds a non-monetary policy meeting. It’s not typically a rate catalyst, but it can still generate headlines that influence the policy tone at the margin.
Thursday, Feb 26 — Confidence follow-through + the biggest scheduled ECB risk
The EU Commission business & consumer surveys (ESI and related detail) provide the most important “confirmation check” after the PMI bounce: if confidence improves alongside the survey rebound in manufacturing, it supports the stabilization narrative; if it stays flat/soft, it reinforces the idea that the expansion remains fragile and uneven.
The main event risk is Lagarde’s ECON hearing at the European Parliament—this is the week’s most direct channel for policy signaling and therefore the most likely driver of EUR rates sensitivity.
Friday, Feb 27 — The consumer expectations anchor
The ECB Consumer Expectations Survey (CES) is a high-signal input for how households see inflation, income, and spending conditions. If inflation expectations drift lower again, it reinforces the disinflation narrative; if they firm alongside a better confidence tone, it can complicate the “easy disinflation” story even if current inflation remains soft.
Fundamental market movers to keep on screen
1) Germany–France divergence risk. If IFO and ESI validate Germany’s improvement while France remains soft, dispersion becomes a bigger theme for the EUR and for intra-euro-area rate spreads (even if headline euro area data looks fine).
2) Energy and geopolitics as a fast inflation channel. Oil moves can quickly feed into European inflation expectations and front-end rates—even if pipeline pricing remains soft—so any geopolitical risk premium is still a volatility lever.
3) ECB politics/communication risk premium. Recent reporting and commentary around ECB leadership and the policy narrative can amplify sensitivity to messaging; Thursday’s hearing is the key point.
EURUSD Technical Analysis (Daily)
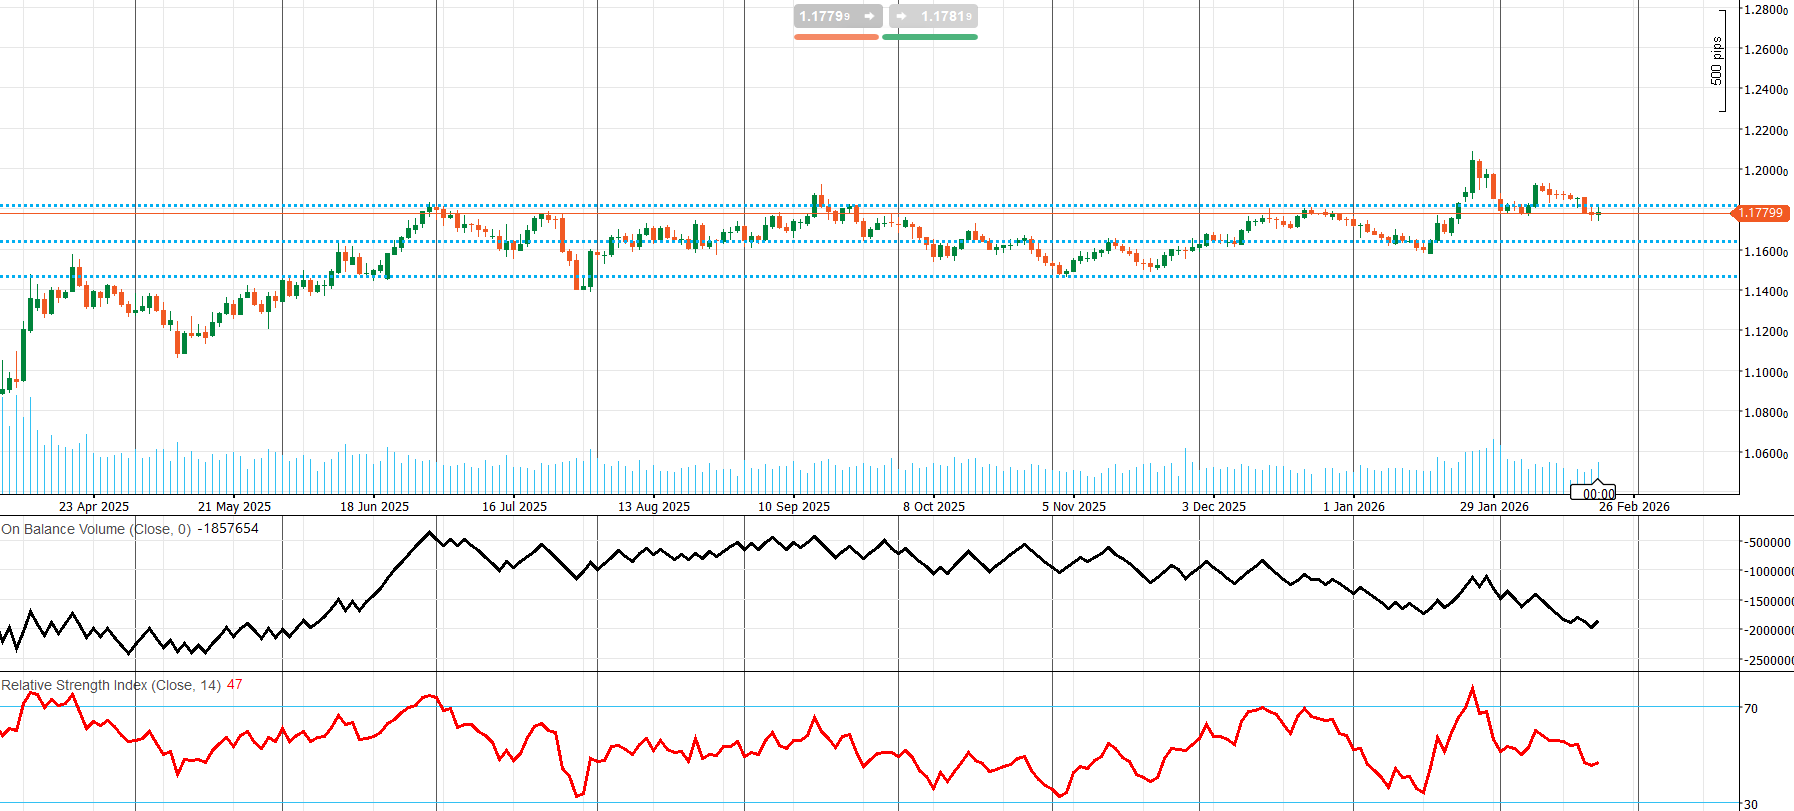
Since mid-2025, EURUSD has been stuck in a broad range, repeatedly rotating between a major support zone near ~1.15 and an upper ceiling around ~1.18. The late-January surge into the ~1.20–1.21 area was a classic failed breakout—price quickly snapped back into the prior range—so the default regime remains mean reversion unless the pair can reclaim those highs and hold above them.
In the near term, EURUSD is consolidating just beneath the upper pivot (~1.178–1.180), and the post-spike price action is forming lower highs, which keeps upside attempts capped until the market prints a clean daily close through resistance. Momentum also supports a cautious stance: RSI (14) near 47 sits below the neutral 50 line (more range-to-down than trending up), and OBV has been drifting lower, suggesting weaker participation on rallies and making upside breakouts less reliable unless volume flow improves.
Key levels to watch
Resistance (supply)
- 1.178–1.180: immediate decision zone (current cap)
- ~1.190: next resistance if 1.18 breaks and holds
- 1.200–1.210: major overhead supply (January spike / swing-high region)
Support (demand)
- ~1.166–1.170: first support band (range mid / repeated reaction zone)
- ~1.150: major range floor (must-hold for the broader range structure)
- ~1.140: next shelf if 1.15 fails (opens deeper downside rotation)
Bottom line: EURUSD is still range-bound after a failed late-January breakout. With RSI below 50 and OBV soft, the bias is neutral-to-slightly bearish unless price can break and hold above ~1.18, which would reopen ~1.20–1.21. If instead ~1.166–1.170 gives way, the market likely rotates back toward ~1.15.
Gold: Holding the $5,000 Pivot as Rates Clash with Risk Premium
Gold ended the week supported near the $5,000/oz psychological zone, as investors weighed a familiar tug-of-war: sticky U.S. inflation and a restrictive policy backdrop (negative for bullion via real yields) versus a renewed risk premium tied to trade-policy uncertainty and geopolitics (supportive for safe-haven demand). On Friday, gold firmed after a hotter inflation backdrop and softer growth signals reinforced the idea that policy may stay restrictive longer than markets want, while fresh tariff headlines and geopolitical tension kept hedging demand active.
The macro driver: policy uncertainty and shifting cut expectations
The rates channel remains the primary transmission mechanism for gold. When real yields and the dollar rise, bullies typically face headwinds because the opportunity cost of holding a non-yielding asset increases. After this week’s data, expectations for near-term easing were pared back: rate-implied probabilities continue to show very low odds of a cut at the March meeting, while the market’s confidence around a mid-year cut remains fluid and highly data-dependent.
Trade-policy shock: tariffs struck down, uncertainty not removed
A major headline catalyst was the Supreme Court of the United States decision (6–3) ruling that broad tariffs imposed under emergency powers lacked legal authorization. Markets initially treated this as a relief on the growth/earnings side, but the uncertainty quickly morphed rather than disappeared: Donald Trump signaled alternative routes and moved to impose a new blanket 10% tariff under different statutory authority—keeping “tariff risk” in play, even if the legal mechanism changes.
Geopolitics: U.S.–Iran tensions keep the hedge bid alive
Gold’s support also reflects geopolitics. Escalating rhetoric and heightened uncertainty around the U.S.–Iran track have kept markets sensitive to any sign of miscalculation that could spill into broader risk assets or energy pricing—an environment where gold often maintains a structural bid even if the dollar is firm.
Week-ahead playbook: what’s most likely to move gold
Gold starts the week anchored around $5,000, with direction most likely dictated by U.S. real yields + USD, while geopolitics remains a secondary—but potentially decisive—driver.
Primary movers
- Rates and USD direction: any repricing toward “higher-for-longer” tends to pressure gold via higher real yields; any yield pullback tends to reopen upside.
- Inflation follow-through: the market will look for confirmation (or cooling) after the latest inflation signals.
- Geopolitical escalation risk: further deterioration in the U.S.–Iran backdrop can keep safe-haven demand active even when rates are not supportive.
Key events to watch
- Mon: Fed Governor Waller; U.S. Factory Orders; Chicago Fed National Activity Index (yields/USD sensitivity)
- Tue: Conference Board Consumer Confidence; Richmond Fed; Case-Shiller (risk sentiment + growth pulse)
- Fri: U.S. PPI + Chicago PMI (pipeline inflation input into rate expectations)
Base-case setup
Base case is two-way / range-biased trade around $5,000 unless yields make a decisive move. If real yields grind higher on firm inflation signals or hawkish messaging, gold can struggle to sustain traction above the pivot; if data cools enough to pull yields down—or if risk headlines worsen—gold can reassert upside even amid “sticky inflation” noise.
Gold Technical Analysis (Daily)
Gold remains structurally bullish on the daily chart, with the primary trend defined by a rising channel (higher highs and higher lows) that has been in place since late 2025. In late January, the price experienced a blow-off style rally into the ~5,500 area, followed by a sharp mean-reversion selloff back into the channel. Since that reversal, the market has shifted from trend extension into a repair phase—a sideways consolidation that looks like a “range within an uptrend” until direction is confirmed.
Price is currently holding above the $5,000 psychological pivot (trading just above $5,100) and oscillating around the midline of the rising channel. This zone typically behaves like a bullish support re-test, but it only remains constructive as long as daily closes continue to defend the $5,000 area.
Momentum supports a cautiously positive bias: RSI(14) is near 58, which is bullish-leaning (above 50) but not overbought—leaving room for continuation if resistance breaks. Meanwhile, OBV remains elevated and has stabilized following the January volatility shock, a pattern more consistent with dip-buying/accumulation than sustained distribution.
Key levels to trade
Resistance (supply)
- $5,200: near-term ceiling/decision level
- ~$5,500: January spike high (major overhead supply)
- ~$5,600–$5,800: upper channel zone if the uptrend resumes
Support (demand)
- $5,000: primary pivot (psychological + structural)
- ~$4,900: near-term range floor
- ~$4,800–$4,750: deeper support cluster (post-spike lows/channel support)
- $4,600: major structural support (“line in the sand”)
Bottom line: Gold is pinned between $5,000 support and $5,200 resistance. A sustained break above $5,200 reopens ~$5,500 and potentially the upper channel, while a failure below $5,000 risks a rotation toward ~$4,800–$4,750, with $4,600 as the next major downside reference if selling accelerates.
Oil Market Conditions and Weekly Outlook
Risk Premium Holds Firm as Iran Headlines Meet Tight U.S. Draws and an OPEC+ Supply Question
Crude finished the week with a strong risk-on-rally profile, led by late-week short-covering as traders priced a higher geopolitical premium. Brent settled near $71.76/b on Friday, while WTI ended around $66.39/b, and both benchmarks were up more than 5% on the week. Much of Friday’s session was heavy, but prices firmed late as markets stayed focused on the evolving United States–Iran dynamic and the tail-risk of disruption in the broader region, following comments from Donald Trump reported by Reuters.
What drove the tape
Three forces dominated pricing:
- Geopolitics (risk premium)
- Markets were effectively “trading the headline tape,” with intraday direction swinging between fears of escalation and skepticism that an imminent strike is a base-case outcome. The result has been an elevated risk premium embedded in front-month pricing.
- Inventories (near-term tightening impulse)
- The latest U.S. data showed a large crude draw (~9 million barrels) alongside stronger refinery utilization and exports—supportive for prompt balances and sentiment. The key question now is whether this was the start of a run of draws or a one-off that reverses. (Data referenced from the U.S. Energy Information Administration weekly release.)
- OPEC+ guidance (forward supply overhang)
- At the same time, the market is weighing reports that OPEC+ may be leaning toward resuming output increases from April, with a decision approaching on March 1—a potential cap on further upside if supply growth becomes more credible.
Oil Monthlies: Feb Snapshot (EIA vs IEA vs OPEC)
The latest February monthly outlooks share a common theme: temporary tightness can flare on geopolitics/outages, but the 2026 baseline risks skew surplus unless OPEC+ policy remains restrictive.
- EIA (STEO): expects persistent global stock builds to weigh on prices, forecasting Brent ~$58/b in 2026 and ~$53/b in 2027. (EIA February STEO framing)
- IEA: emphasizes that stocks built heavily in 2025 (~477 mb, ~1.3 mb/d) and signals additional early-2026 builds, reinforcing the view that buffers are rebuilding rather than structurally drawing. (International Energy Agency)
- OPEC: more constructive on demand, keeping 2026 demand growth near ~1.4 mb/d, but flags that the balance is highly policy-contingent, including a Q2 dip in the call on OPEC+ crude (~42.20 mb/d)—implying a small Q2 surplus if production doesn’t adjust. (OPEC)
Net takeaway: EIA + IEA lean more clearly toward a surplus/inventory-build base case; OPEC’s view is tighter and more policy-sensitive. The swing variables are consistent across all three: OPEC+ discipline, China stockbuilding, and geopolitical risk premia.
Week-ahead: what matters most
Oil enters the week near multi-month highs with risk premium still embedded. The next leg likely depends on whether geopolitical stress intensifies, whether inventories confirm tightening, and what signals emerge into the OPEC+ decision window.
Primary catalysts
- U.S.–Iran trajectory: escalation headlines can extend upside quickly; credible de-escalation can compress risk premium fast.
- Inventory path: the market needs confirmation that draws persist rather than snap back into builds.
- OPEC+ forward guidance: Any firm signal of “more barrels in April” is a near-term upside cap unless geopolitics overwhelms it.
Key events to watch
- Wed: EIA Weekly Petroleum Status Report (crude/products/Cushing/runs/imports)
- Fri: Baker Hughes rig count (supply momentum) + CFTC positioning (spec length / short-covering risk)
Base-case setup
Near term, the bias stays supportive as long as (1) Iran-related risk remains elevated and (2) inventories do not rebuild sharply. The risk is asymmetric: de-escalation can remove premium quickly, while escalation can extend the rally—especially if the EIA confirms another week of meaningful draws. Into month-end, markets may increasingly pre-price the March 1 OPEC+ meeting, which could keep upside more contested if the consensus shifts toward added supply in April.
WTI Technical Analysis (Daily)
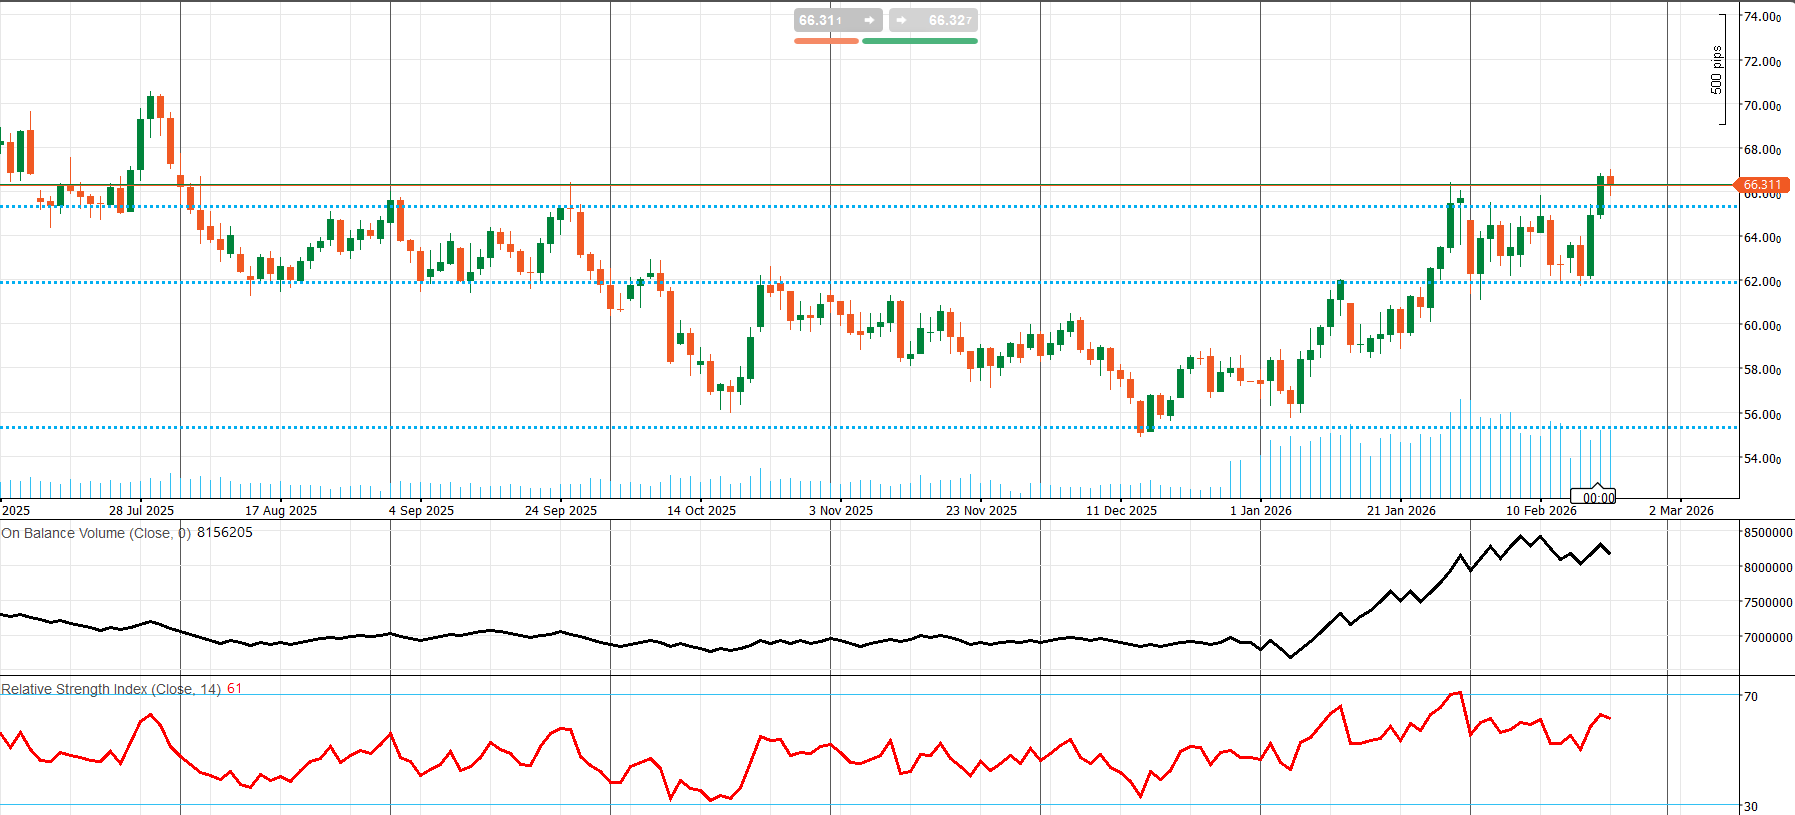
WTI spent late July through December 2025 in a clear downtrend, making lower highs and lower lows before stabilizing and bottoming around ~$55 in mid-December. Since early January 2026, the structure has flipped into a recovery uptrend, with prices printing higher highs and higher lows while pushing back into previously broken supply zones.
That rebound has now carried WTI into a major pivot/resistance band near ~$66, a level that previously acted as a key decision area in the broader cycle. Recent candles show buyers stepping back in after a pullback, but the market still needs acceptance above $66—a clean daily close and follow-through—rather than a brief wick through resistance. Momentum and participation support the bullish recovery narrative for now: RSI is around ~61 (bullish leaning, not overbought), and OBV remains constructive, indicating demand is backing the move. This makes ~$66 the immediate inflection point: a confirmed breakout would reopen ~$70 next, while failure to hold nearby supports would shift WTI back into a range/mean-reversion profile and raise the risk of a deeper pullback.
Key levels to watch
Resistance (supply)
- ~$66.0–$66.5: immediate ceiling/breakout trigger (current test zone)
- ~$70.0–$71.0: next upside target (prior summer swing area)
- ~$72–$74: higher resistance band if the move evolves into a full trend reversal
Support (demand)
- ~$64.0–$64.5: first support (recent reaction/pullback zone)
- ~$62.0: key support shelf / prior pivot
- ~$56.0: major base support (December–January floor)
Bottom line: WTI is in a bullish recovery phase, but it’s now testing the $66 breakout zone. A sustained hold above it targets $70–$71; a rejection that breaks $64 and then $62 would likely turn the tape back into a range and increase the risk of rotation toward the low-$60s and potentially ~$56 if the recovery unwinds.
Crypto Market Condition and BTC Weekly Outlook
The crypto complex is drifting back toward the lower end of its recent range. Total market cap fell a little over 1% in 24 hours to ~$2.31T, nearing last week’s lows but still about 5% above the Feb 6 trough. The range is tightening, which typically precedes a volatility break; given the prior tape and a more cautious tone in U.S. equities, the balance of risk tilts toward a retest of local lows, with downside scenarios increasingly pointing back toward levels last seen in the second half of 2024.
Price action: BTC resilient, alts doing the damage
Bitcoin is holding just above $67K (down slightly under 1%), outperforming the broader market as selling pressure concentrates in altcoins outside the top five. BTC is trading near the bottom of the last 1–2 weeks’ downward range, keeping the market in a fragile “support test” posture. Ethereum is sitting on a long-term support line that dates back to 2020 and was respected in early 2024 and again at the February lows. That structural support now aligns with the ~$2,000 area, increasing its technical significance. A true “breakdown event” would require confirmation—most notably, failure below the recent ~$1,500 lows. Until that happens, dip-buying interest can persist as long-term buyers treat $2,000 as a major accumulation zone.
Flows and positioning: pressure building into the month-end
Near-term direction remains flow-driven. Spot BTC ETF flows have turned choppy to negative, which tends to cap rallies unless inflows resume. At the same time, derivatives markets show elevated downside hedging into month-end, with Feb. 27 BTC/ETH options expiry shaping up as the main volatility focal point; heavy positioning increases the odds of event-driven swings rather than smooth trend moves. Token unlocks are an additional source of idiosyncratic supply risk for alts, especially when liquidity is thin.
News backdrop: whales, cycle talk, institutions, and regulation
On-chain and institutional headlines reinforce a cautious short-term setup. CryptoQuant reports that Bitcoin inflows from large holders to Binance are at record levels—often a sign of increased distribution pressure. K33 compares current conditions to the late stage of the 2022 bear phase, which preceded a prolonged consolidation period. In contrast, Willy Woo argues BTC may only be in the first phase of a bear cycle, with a deeper phase potentially tied to a broader drawdown in global equities before stabilization.
On the institutional side, Strategy added 2,486 BTC (~$168.4M) at an average price near $67,710, bringing reported holdings to 717,131 BTC (average cost ~$76,027). Japan’s Metaplanet reported a large 2025 net loss driven by mark-to-market revaluation of BTC holdings. In Ethereum, staking exceeded 50% of supply for the first time (per Santiment), with a large staking queue (about 3.8M ETH, ~67 days wait). BlackRock has taken an initial step toward a U.S.-listed Ethereum ETF. Meanwhile, Founders Fund (Peter Thiel) exited its stake in an ETH-heavy corporate holder (“ETHZilla”), removing one institutional support headline from the tape. On the policy front, updated IRS rules have rattled sentiment: from 2026, U.S.-licensed crypto exchanges will face expanded reporting requirements on customer activity and realized P&L.
Crypto Market and Week Ahead: Macro Inflation Test, Options Expiry, Flow Signals
Market condition into the week
- BTC: ~$67.6K (recent range ~$66.5K–$68.2K)
- ETH: ~$1,963 (recent range ~$1,925–$1,978)
- Key swing drivers: ETF flow tape, month-end options expiry dynamics, and macro-driven rate repricing.
Macro calendar that matters most for crypto
Crypto is still “macro-first” when USD and real yields move:
- Thu (Feb 26): Durable Goods (Jan) read-through for growth momentum and capex tone
- Fri (Feb 27): PPI (Jan) direct input into inflation pricing/front-end yields (hot print is usually crypto-negative)
- Fri (Feb 27): Chicago PMI (Feb) fast activity breadth check
Crypto-specific catalysts
- Feb 27 options expiry (BTC & ETH): higher probability of sharp spot moves near major strikes
- Spot ETF flows (daily): persistent outflows = rallies sold; renewed inflows = trend continuation risk
- Token unlocks localized drawdowns that can spill into broader alt sentiment
- Policy/regulatory headlines: can reprice risk quickly even without immediate on-chain changes
Base-case outlook
The most likely setup is range-to-choppy with event-driven volatility. A bullish outcome needs softer PPI/easing yields plus stabilization in ETF flows, which could allow BTC to reclaim the high-$68K area with better follow-through. A bearish outcome is cleaner: hotter PPI + firmer USD/real yields + continued ETF outflows raise downside pressure, and hedged positioning into Feb 27 can amplify dips and accelerate a retest of local lows.
BTCUSD Technical Analysis (Daily)
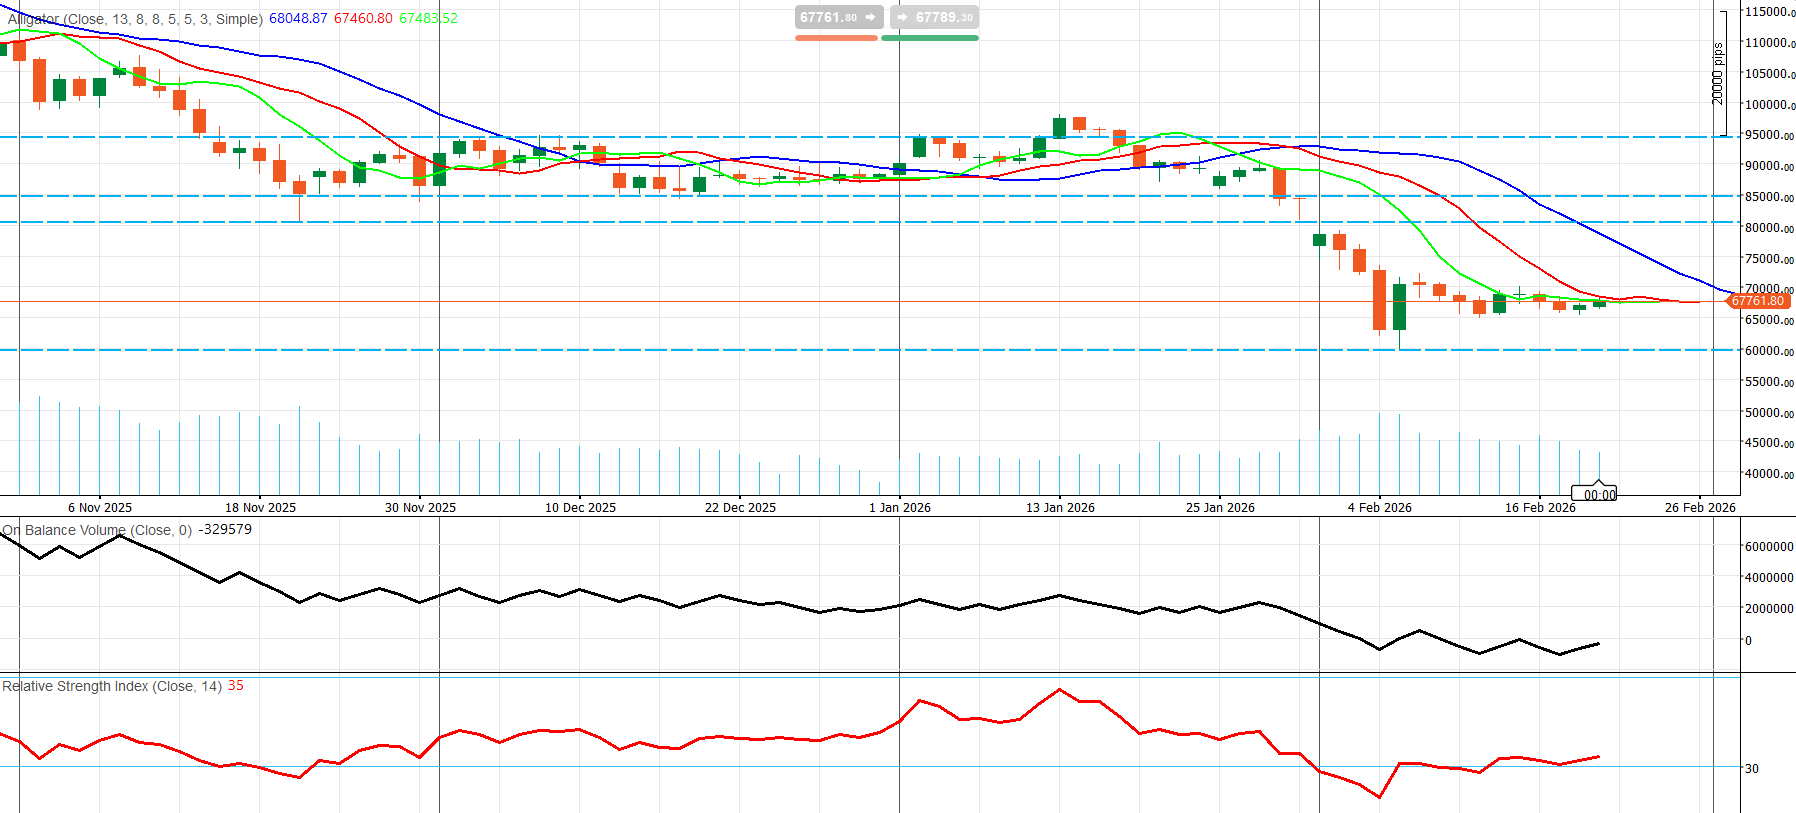
BTC remains in a bearish regime, but the market is no longer in free-fall. The dominant move since early November was a downtrend that accelerated into a breakdown, with price sliding from the ~95k area, losing the ~85k/80k pivots, and ultimately flushing into the low-to-mid 60k region. Since the early-February selloff, price action has shifted into a sideways stabilization band around ~65k–70k—a classic post-capitulation structure that can evolve into either a bear flag or a bottoming base, depending on how the range resolves.
Alligator signal: trend is cooling, not reversing (yet)
The Alligator lines are compressing and flattening, which typically reflects a trend losing momentum:
- Jaw (blue): ~68,048
- Teeth (red): ~67,461
- Lips (green): ~67,484
With a price around ~67,762, BTC is above the teeth/lips but still below the jaw, suggesting the market is transitioning into consolidation (“the alligator going to sleep”) rather than establishing a new uptrend. A stronger bullish transition would require a reclaim of the jaw and then a visible turn higher with the lines separating.
Momentum and participation: weak, but stabilizing
- RSI(14) ~35: still bearish/oversold-adjacent. Momentum has improved from the extreme low, but it’s not back above the neutral 50 level—consistent with basing rather than trend reversal.
- OBV: remains structurally down. The selloff produced a sharp OBV drop, and the rebound has only stabilized it modestly, implying sellers dominated the breakdown, and buyers are only beginning to return. A more durable reversal usually requires OBV to turn up and start printing higher highs.
Key levels to watch
Resistance (supply)
- 68,000–68,100: immediate resistance / trend-repair gate (Alligator jaw)
- 70,000: psychological reclaim level and breakout trigger from the base
- 80,000: first major overhead supply (prior support → resistance)
- 85,000: major pivot zone
- 95,000: upper reference / prior range ceiling
Support (demand)
- 65,000–66,000: near-term base floor (range support)
- 60,000: major structural support (line in the sand)
- Below 60,000: opens a deeper downside toward lower demand zones
Bottom line: BTC is still bearish overall, but the market is basing between ~65k and ~70k. A sustained reclaim above ~68k and especially ~70k would shift the odds toward trend repair and move back toward ~80k. Conversely, failure below ~65k increases the risk of a renewed selloff toward ~60k.
Comments