 English
 پارسی


Analytical Video
USA
This week reinforced a regime of cooling headline inflation, sticky core, and moderating demand. That mix supports a Fed hold in the near term while preserving the option for conditional easing later in 2026. For the policy path, the key tension is straightforward: payroll strength reduces urgency, while continued disinflation and softer consumption/housing keep the “eventual cuts” conversation alive.
U.S. Macro Week in Review
Payrolls Surprise, Headline CPI Cools — Fed Patience Firms as Markets Whipsaw
A compressed data window delivered a rare, high-signal “double header” on U.S. labor and inflation. The combination was directionally constructive for both sides of the Federal Reserve mandate: job growth appears to be stabilizing (with an upside payrolls surprise). At the same time, inflation cooled more than expected at the headline level. The net effect, however, is not an imminent easing pivot. Firm labor outcomes alongside still-above-target core inflation harden the case for patience, pushing the next realistic cut window toward mid-year and keeping near-term “hold” pricing intact.
Key takeaways
- March easing is increasingly unlikely. Labor resilience plus still-firm core inflation reduces the bar for cuts in the next 1–2 meetings.
- Disinflation remains intact, but “core at 0.3%” keeps the Fed cautious. Headline CPI improved, core stayed steady.
- Demand signals softened at the margin. Retail control-group weakness and a sharp drop in existing home sales reinforce a “rates/affordability still biting” narrative.
- Markets traded a risk-off → stabilization pattern. Cross-asset sensitivity to incremental growth/inflation changes remains elevated.
1) Inflation: headline improves, core remains the constraint
January CPI was softer on the surface:
- CPI (MoM): 0.2% (below consensus)
- CPI (YoY): 2.4% (also below expectations)
Core inflation stayed firmer:
- Core CPI (MoM): 0.3% (in line)
- Core CPI (YoY): 2.5% (roughly in line / marginally lower)
One supportive detail for households was real earnings, which rebounded +0.5% MoM, implying improved purchasing power as headline inflation cooled. That said, different category weights and seasonal factors mean core PCE is still likely to run hotter for January (around ~0.37% MoM), so the disinflation story remains positive but not yet “mission accomplished” from a policy standpoint.
Policy implication: Better headline prints help the doves, but steady core keeps the committee comfortable waiting.
2) Labor: payrolls beat, but breadth remains a question
The January employment report surprised to the upside:
- Nonfarm payrolls: +130K
- 3-month average: 73K
- Unemployment rate: 4.3% (back near where it was before the late-2025 easing phase)
Downward revisions were notable but widely anticipated and didn’t materially change the forward signal: overall job growth looks more like stabilization than rollover. The bigger nuance is composition and breadth—hiring remains relatively concentrated in healthcare and social services, while the pace outside those categories is more subdued. That concentration matters for how confident we can be that labor strength is durable and economy-wide.
Other labor metrics were less “hot” than payrolls:
- Wage pressures continue to fade. The Employment Cost Index undershot in Q4, with compensation growth slowing to 3.4% YoY, the weakest since 2021.
- Cooling wages/benefits (especially outside healthcare), combined with solid productivity, reduces the risk of a renewed labor-cost inflation impulse.
Policy implication: The labor market is not flashing recession risk, but the gradual moderation in compensation is one reason the Fed can keep optionality for cuts later in 2026—just not imminently.
3) Demand: consumption cools, housing rolls over
Activity data leaned softer:
- Retail sales: flat on the month, with the control group negative, pointing to weaker real consumption momentum into year-end.
- Existing home sales: fell to 3.91M, down -8.4% MoM, a clear downside surprise consistent with affordability constraints.
Importantly, not all consumer data was weak. Aggregate holiday spending (Nov–Dec) still ran about +3.6% YoY, suggesting year-end softness was narrower and goods-led, not a broad retrenchment in household demand.
Macro signal: Growth is cooling at the margin, but the consumer backdrop isn’t collapsing—more “late-cycle moderation” than capitulation.
4) Rates & policy pricing: hold expectations firm; duration demand improves
With labor stable and core inflation still sticky, markets leaned even more toward a near-term pause:
- High implied odds of no change in March and April (hold pricing hardens).
- U.S. Treasury supply was absorbed without drama at the front end, while the long end showed improved demand (the 30Y auction clearing at a lower yield than the prior auction), consistent with investors being comfortable holding duration as activity indicators cool.
- Yields dipped at points as softer demand data gained attention, reinforcing the “disinflation without collapse” framing.
Policy implication: The window for additional cuts is narrowing, and near-term patience is the base case. The next cut is more plausibly a mid-year (June) story, conditional on continued disinflation and/or clearer demand deterioration.
5) Financial conditions & liquidity: marginal easing, mostly technical
Balance-sheet dynamics were mildly supportive:
- Federal Reserve balance sheet and reserve balances ticked slightly higher on the week—often technical, but still a modest tailwind for system liquidity at the margin.
What to watch next (the cut/no-cut decision tree):
- Whether job gains broaden beyond a few sectors (or whether claims/ECI keep trending softer)
- Whether core inflation persists at ~0.3% monthly (especially in PCE terms)
- Whether demand weakness spreads beyond goods and housing into services and broader consumption
If core inflation stays sticky, the Fed can remain patient even with softer growth. If demand weakness accelerates, duration stays supported—and equity leadership may continue rotating defensively.
US Economic Outlook (Week 8, 2026)
“Hold-Rate” Fed, Softer Demand Pulse — GDP, PCE, and Minutes Drive the Repricing Risk
The U.S. enters Feb 16–21 with a familiar late-cycle mix: headline disinflation is improving, core inflation remains sticky, and demand momentum has softened at the margin (flat retail sales with a weaker control group, plus a notable drop in existing home sales). Against that backdrop, markets are broadly priced for a policy hold into spring, so the bar for a meaningful repricing is relatively clear: either core inflation re-accelerates, or growth weakens materially.
A practical framing for the week is:
- Policy reaction function: Federal Open Market Committee minutes + GDP/PCE cluster
- Trend confirmation: PMIs + housing + manufacturing/capex data (signal vs noise on the softer-demand print)
1) Macro setup heading into the week
Inflation: January CPI looked better at the headline level (0.2% MoM / 2.4% YoY) while core held firm (0.3% MoM / 2.5% YoY). That keeps the narrative at “progress, not victory.”
Demand: December retail sales were soft (headline flat; control group negative), reinforcing “cooling consumption” risk into year-end.
Labor: Claims remain consistent with a cooling-but-stable labor market—no clear recession signal, but less tight than prior quarters.
Housing: Existing home sales fell sharply (3.91M; -8.4% MoM), keeping the housing channel a key growth drag as affordability remains binding.
Policy pricing: With March/April treated as “hold” meetings, near-term sensitivity shifts away from the baseline rate path and toward surprise risk in growth and core inflation.
2) The week’s three primary catalysts
A) Federal Reserve minutes (Thu, Feb 19)
The minutes matter less for “will they cut soon?” (markets already say no) and more for risk asymmetry:
- How policymakers weighed sticky core inflation vs cooler headline inflation
- Whether consumption/housing softness is being treated as a signal or temporary noise
- The committee’s tolerance for keeping policy restrictive for longer vs laying groundwork for later easing
Market relevance: If the tone reads more inflation-concerned, “higher-for-longer” pricing can harden quickly. If it reads more growth-concerned, the front end stays anchored, but the long end can rally on softer growth expectations.
B) Advance Q4 GDP + income/spending + PCE inflation (Fri, Feb 20)
This is the densest macro cluster of the week and the most policy-relevant.
GDP composition is the real story: whether growth remains consumption-led or is fading. A reasonable working estimate is 1.6% SAAR for Q4, with a meaningful portion of weakness attributable to the extended government shutdown (early Oct through mid-Nov), which likely shaved roughly 1.2pp off headline growth. Stripping out shutdown effects, activity appears to have held up better than the headline may imply.
Consumption and income: The key question is whether the consumer is merely cooling off or actually losing traction. A coherent base case is:
- Nominal spending: up around 0.3% for December
- Real spending: roughly flat
- Personal income: also around 0.3% (making the saving rate/income trajectory a critical watch point)
The softer retail print looks more consistent with timing/pull-forward effects than a broad demand break, so it doesn’t necessarily invalidate a constructive consumer view—but it raises the premium on income durability into early 2026.
PCE / core PCE: This is the Fed’s preferred inflation gauge and the cleanest policy “truth serum” after CPI.
- Hot core PCE = fast repricing toward “higher for longer.”
- Soft GDP + soft income/spending = “hold” morphs into “cuts later” (rates market moves first)
C) S&P Global flash PMIs (Fri, Feb 20)
Flash PMIs provide the first high-frequency read on February activity. Focus areas:
- Services PMI (still the main growth engine)
- Prices paid / input costs (survey-level inflation pulse)
Market relevance: PMIs can validate whether the soft demand signals (retail/housing) are broadening or staying idiosyncratic.
3) Secondary—but still market-moving—data to watch
Manufacturing / capex
- Durable goods orders (Wed, Feb 18) as a capex/business demand proxy
- Industrial production and utilization for output momentum
- Regional surveys: Empire State Manufacturing Survey and Philadelphia Fed Manufacturing Index for near-term direction
What would matter: broad weakness (growth-negative) vs “soft but stabilizing” (risk-supportive).
Housing follow-through
- National Association of Home Builders sentiment
- Housing starts and pending home sales to test whether the existing-home slump was weather/noise or deeper demand stress
What would matter: confirmation of a deepening housing drag vs stabilization.
Consumer sentiment
- University of Michigan sentiment and inflation expectations (Fri, Feb 20) can influence rates/FX at the margin, especially if expectations move.
Trade balance
Recent trade data have been noisy due to volatility in a few categories (notably gold, pharmaceuticals, and high-tech imports). A reasonable near-term assumption is a wider deficit around -$57.6B in December, but the signal should be interpreted cautiously given category distortions and the broader role of inventories and net exports as swing factors.
4) Market structure: holiday effects + Treasury supply dynamics
- Mon, Feb 16 is a U.S. holiday (Washington’s Birthday / Presidents’ Day) → thinner liquidity early week
- Midweek U.S. Treasury auctions (including longer duration) can amplify moves if data surprises and supply collide
Why this matters: In a “Fed-hold” regime, auction demand can become a secondary catalyst for yields—especially when liquidity is thin.
5) Base case and two key risk scenarios
Base case: Hold Fed + softer demand, but no break
- GDP/PCE reinforces moderating growth with gradual disinflation
- The Fed stays comfortable holdinga restrictive policy
Market implication: range-bound yields; USD driven more by relative growth/rate differentials vs peers than by imminent policy change.
Upside inflation risk: core PCE and/or PMI price components re-accelerate
- Hot core PCE or hotter prices-paid readings can re-anchor “higher for longer.”
Expect: yields up, USD firmer, tighter financial conditions, and risk assets more rate-sensitive.
Downside growth risk: GDP/income/spending disappoints while housing stays weak
- Soft GDP plus weak consumer/income data and no housing rebound shifts “hold” toward “cuts later this year.”
Expect: yields down (long-end likely best bid), USD mixed-to-softer, equities tilt more defensive as earnings risk rises.
What matters most: a simple checklist
- Core PCE + personal spending (Fri) — most policy-relevant inflation + demand check
- Minutes (Thu) — any shift in the balance of risks (inflation persistence vs growth cooling)
- Flash PMIs (Fri) — confirmation/rejection of a broader slowdown signal
- Housing follow-through — whether housing drag deepens or stabilizes
USD & Wall Street Weekly Review and Outlook
Softer U.S. Data Pulled Yields Down, Tech Led the Equity Drawdown, Gold Took the Hedge Bid. The past week’s price action in USD and U.S. equities was driven by the same macro cocktail: cooler headline inflation, softer consumption signals, and a market that’s increasingly comfortable with a “Fed on hold” baseline—but still sensitive to any shock to rates, liquidity, or growth expectations.
USD: Yield-Driven Softening, But No “Cut Panic”
The week was best characterized as “less upside for yields,” not “panic cuts.” That typically translates into a mildly softer USD bias, especially versus currencies where rate expectations turned more hawkish or where USD-long positioning was crowded.
The main driver of USD price action was the rates repricing that followed data pointing to cooling demand and continued headline disinflation progress.
Macro drivers
- Inflation: Headline disinflation supports the “peak rates” narrative, but sticky core inflation prevents a quick pivot story.
- Demand/consumption: Softer retail sales (and a weaker control group) signaled slower consumption momentum, feeding into lower yields—typically USD-negative at the margin.
- Labor: The labor market remained stable but showed mild easing. Not recessionary, but consistent with gradual cooling—another modest yield-driven headwind for the USD.
Policy pricing stayed anchored
Markets leaned hard into a Fed hold, with roughly 90.8% odds of no change in March and about 70% odds of no change in April (CME FedWatch). That matters: the dollar didn’t “collapse” because the market did not price an imminent easing cycle—rather, it priced a lower-for-longer yield profile versus prior expectations.
Treasury supply/demand reinforced the tone
Auction results were consistent with steady demand across the curve:
- 3Y: stopped at 3.518% (vs 3.609% prior) → supportive for the view that the front/intermediate curve is comfortable.
- 10Y: essentially unchanged at 4.177% (vs 4.173% prior) → steady, not stressed.
- 30Y: stopped at 4.750% (vs 4.825% prior) → long duration looked better bid.
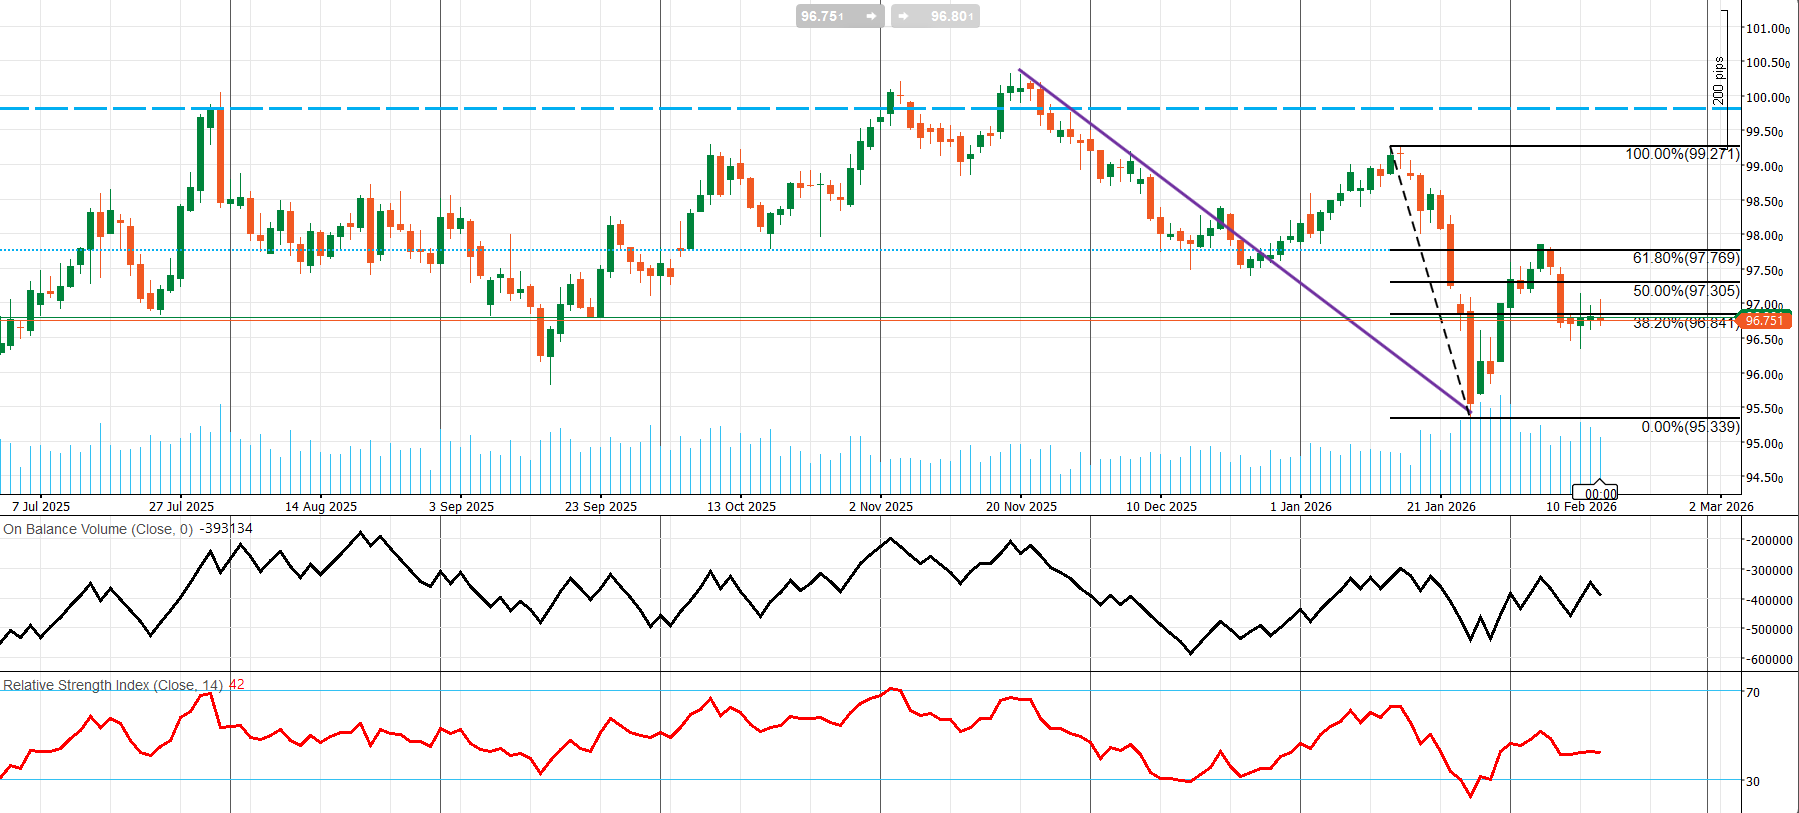
USD Technical Analysis (Daily)
Post-selloff basing below a key Fib pivot — trend still bearish, breakout needs confirmation.
Since late January, price action has resembled a capitulation low near ~95.34, followed by a sharp rebound and then a tight consolidation. Structurally, the larger picture remains a downtrend from the Nov/Dec highs, but the market is attempting to build a base after the washout.
The key decision zone is 96.8–97.0 (the 38.2% retracement area): reclaim it to improve the recovery odds or lose the base and reopen downside risk.
Trend & structure
- Primary trend: still bearish (lower highs since the late-2025 peak; the selloff into ~95.34 remains the dominant swing).
- Near-term structure: the rebound failed to sustain above the mid-Fib band and is now forming a sideways-to-slightly-bearish range (a classic “pause after a sharp move”).
- The break of the prior downtrend line is constructive, but the price has not yet translated that into higher highs.
Momentum & participation
- RSI ~42: below 50 implies a bearish momentum bias, though it has lifted off the lows (selling pressure has cooled). A sustained move back above 50 would be a meaningful improvement.
- OBV: stabilized and attempting to recover, but not yet confirming a bullish trend shift—still consistent with a “repair phase” rather than a clean uptrend.
Key levels (Fib swing high/low)
Resistance (needs reclaim):
- 96.84 (38.2%) — first pivot / near-term line in the sand
- 97.30 (50%) — range ceiling/confirmation step 1
- 97.77 (61.8%) — confirmation step 2; clearing this increases the probability of a larger recovery
- 99.27 (100% retrace / prior swing high) — major resistance; recovery target if momentum returns
- 100.0 area — higher-timeframe supply zone
Support (must hold):
- 96.6–96.7 — current consolidation floor
- 96.0 — psychological level + prior reaction area
- 95.34 — critical swing low; a break would reopen bearish continuation risk
Wall Street: Risk-Off Shock, Then Mixed Stabilization
U.S. equities traded a classic macro whipsaw: a sharp risk-off move (with the Nasdaq Composite showing the greatest sensitivity), followed by a more mixed stabilization (the S&P 500 and Dow Jones Industrial Average firmer, Nasdaq softer). The dominant narrative was cooling headline inflation + softer demand = disinflation without collapse, but the dispersion in performance underscored how reactive markets remain to small changes in the growth/rates mix.
In short, equities followed the standard macro-volatility script: softer demand data pushed yields lower, positioning and risk management intensified, tech underperformed, and the broader index complex de-risked.
Cross-asset signal: hedge demand stayed alive
The cross-asset message was clear. Gold finished near where it began the week overall, but spiked +2.33% in the same session, Equities were mixed, while oil was essentially flat. That is a classic “hedge bid” signature: investors used gold as insurance against macro uncertainty and equity drawdown risk.
What to watch in the coming days
Based on last week’s signals:
- Sticky core inflation + softening demand keeps markets in a “Fed hold + growth fragility” regime—typically choppy for equities and USD-soft at the margin via lower yields.
- If incoming data shows demand stabilizing or re-accelerating, the Nasdaq can regain leadership quickly—but only if rates do not back up sharply.
- The persistence of the gold bid suggests investors are still paying for tail risk, so equity rallies may remain tactical rather than trend-like until macro uncertainty clears.
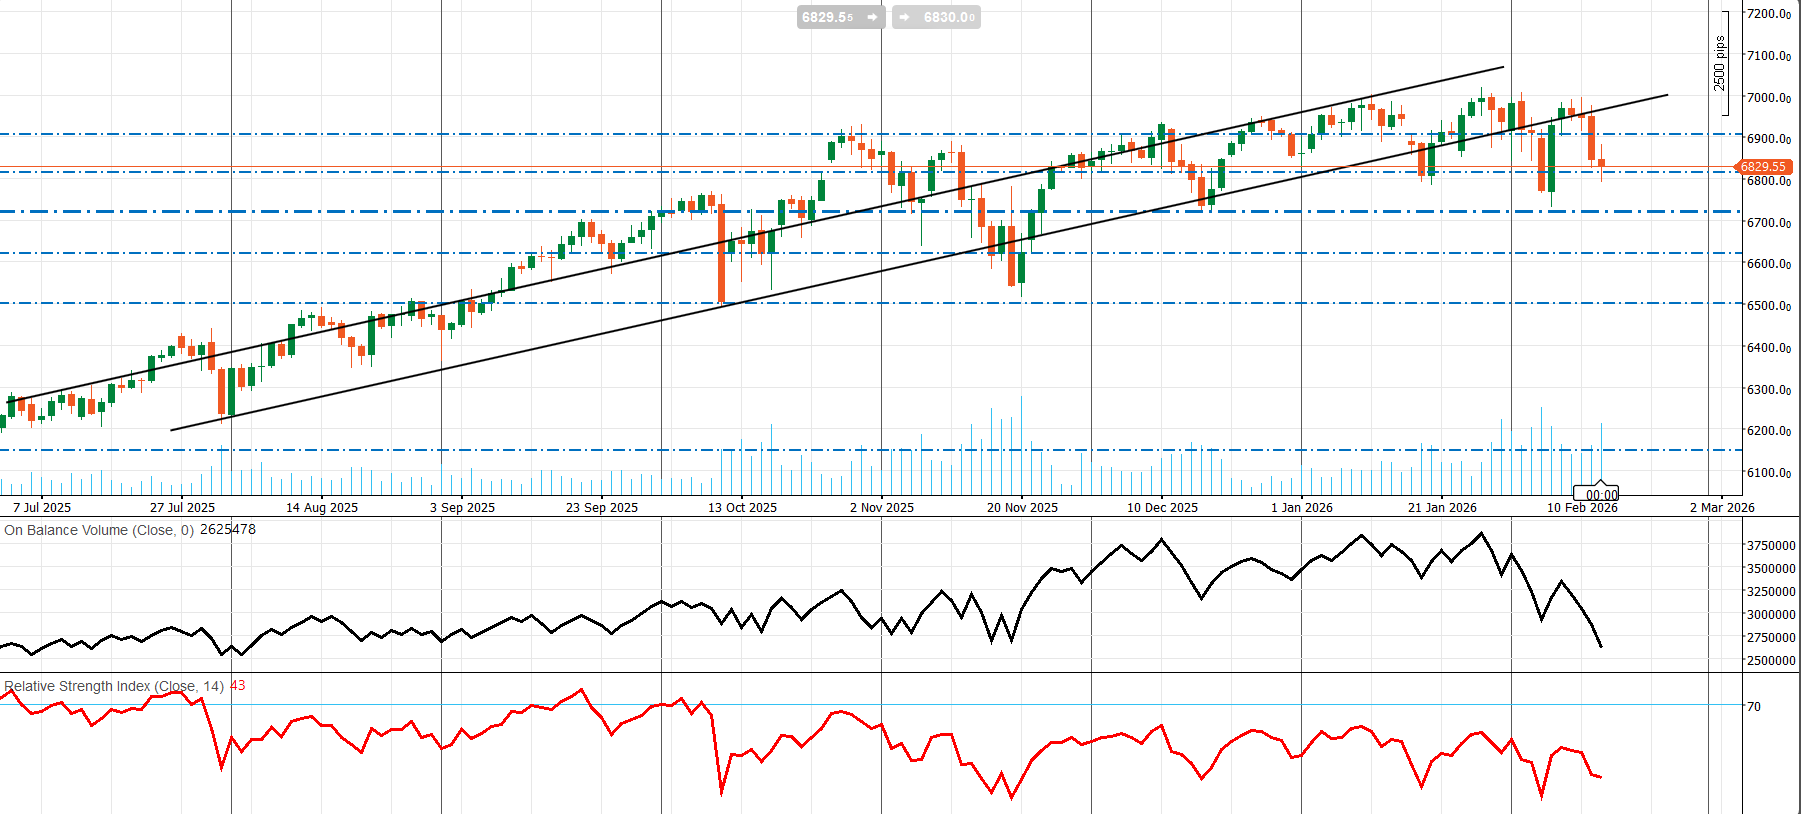
S&P 500 Technical Analysis (Daily)
Uptrend channel broken — market in a post-distribution pullback.
The index is trading around 6829.55 after a sharp late-Jan/early-Feb selloff. The key technical development is the breakdown of the multi-month rising channel (July–Jan). That is the first meaningful structural warning that the uptrend is losing control, even if the price has not fully transitioned into a clean downtrend yet.
Trend & structure
- Primary trend (since July): bullish, defined by higher highs/higher lows within the rising channel.
- Current regime: the latest drawdown broke channel support, and the rebound failed to quickly reclaim the channel. That shifts the market from “trend-following” to “repair / range-to-down.”
Momentum & participation
- RSI ~43: below 50 implies a bearish momentum bias, but it’s not oversold—consistent with a market that can chop/range rather than snap back immediately.
- OBV: peaked and then rolled over sharply into the selloff—classic distribution confirmation (the decline had real participation, not just air pockets).
Key levels to watch
Resistance (must reclaim to stabilize):
- ~6880–6900: former support + channel floor; now first resistance.
- ~6950–7000: prior swing high/supply zone; reclaiming this is a more credible “trend back on” signal.
- ~7050–7100: upper channel region (re-entry + momentum recovery scenario).
Support (where downside risk accelerates):
- ~6800–6820: immediate pivot (price is currently sitting on it).
- ~6700: major horizontal support; losing 6800 typical points here next.
- ~6600 → 6500: next shelves if 6700 fails (would confirm a deeper correction phase).
- ~6200: longer-range structural support from earlier in the trend (relevant only if the correction broadens materially).
Eurozone
EU macro-economic growth is holding, jobs are resilient, and headline disinflation remains on track—with meaningful support from the external surplus. The main countersignal is Germany’s upstream price jump, which argues against declaring inflation risks “done.” These data support a central case of gradual easing bias, but with vigilance toward any pipeline-to-core inflation transmission—especially if upstream German pressure persists.
EU Economy Weekly Review:
Growth Holds, Jobs Stay Resilient, Disinflation Advances—But Germany’s Upstream Prices Reawaken
The Eurozone’s data flow in the past week reinforced a “modest expansion with improving external balance” narrative, supported by steady Q4 growth and better-than-expected employment. Inflation dynamics looked more favorable at the headline level (notably Spain), but the week also delivered a cautionary signal from Germany: a sharp jump in wholesale prices, hinting that pipeline inflation is not fully extinguished. Sentiment indicators broadly improved, while sovereign funding conditions stayed mostly orderly with generally lower yields across several auctions—though some periphery nuance remains.
1) Growth: steady Q4 pace, no acceleration
Eurozone GDP held firm in Q4, consistent with a recovery that is stable but not speeding up:
- Eurozone GDP (QoQ, Q4 prelim): +0.3% (in line; unchanged vs prior)
- Eurozone GDP (YoY, Q4 prelim): +1.3% (in line; slightly softer vs prior 1.4%)
Which means the economy is expanding, but the data does not support a “re-acceleration” story. This is the profile of a region growing at a moderate, policy-sensitive pace—stable enough to avoid recession chatter, but not strong enough to invalidate easing expectations on its own.
2) Labor market: employment beats, cushioning demand
The labor market remained a key stabilizer:
- Eurozone Employment (QoQ, Q4 prelim): +0.2% (above +0.1% expected; same as prior)
- Eurozone Employment (YoY, Q4 prelim): +0.7% (above +0.6% expected; above prior +0.6%)
- Employment level: 172.5166M (up from 172.2104M)
That says hiring is still resilient, helping underpin household income and reducing downside tail risk for consumption. For the ECB, a firmer labor market can be a double-edged factor: supportive for growth, but potentially sticky for services inflation via wage dynamics.
3) Inflation: Spain cools decisively, but Germany’s pipeline signal heats up
Spain’s inflation report strengthened the disinflation narrative:
- Spain HICP (YoY, Jan): 2.4% (below 2.5% expected; down from 3.0%)
- Spain CPI (YoY, Jan): 2.3% (below 2.4% expected; down from 2.9%)
- Spain CPI (MoM, Jan): -0.4% (in line; down from +0.3%)
- Spain HICP (MoM, Jan): -0.8% (a larger fall than expected -0.7%; down from +0.3%)
- Spain Core CPI (YoY, Jan): 2.6% (unchanged; in line)
Headline inflation is clearly cooling, but core at 2.6% signals underlying pressure is stable rather than collapsing. The large negative MoM prints likely reflect seasonal/energy dynamics, but they still align with a broader disinflation trend.
Germany, however, delivered a clear upside inflation surprise upstream:
- Germany WPI (MoM, Jan): +0.9% (vs +0.1% expected; prior -0.2%)
- Germany WPI (YoY, Jan): +1.2%
The German WPI shock is the week’s main “hawkish” input. It does not automatically translate to CPI, but it raises the risk that pipeline pressures re-emerge—especially if input costs or margins pass through later.
4) External sector: stronger trade surplus, Germany's surplus widens
The external balance was a bright spot:
- Eurozone Trade Balance (Dec): €12.6B (above €11.8B expected; up from €9.3B)
- Germany Current Account (NSA, Dec): €16.1B (up from €14.2B)
A larger trade surplus and wider German current account surplus improve macro stability and can be modestly supportive for the currency at the margin—though FX is still dominated by rate differentials, risk sentiment, and energy.
5) Sentiment: investors and consumers improve broadly
Investor sentiment surprised positively:
- Sentix Investor Confidence (Feb): 4.2 (vs -0.2 expected; prior -1.8)
Consumer sentiment improved across major Eurozone economies (still not “booming,” but directionally better):
- France PCSI: 41.15 (up from 39.77)
- Germany PCSI: 47.07 (up from 46.35)
- Italy PCSI: 48.07 (up from 47.69)
- Spain PCSI: 49.99 (up from 49.23)
The sentiment cluster points to reduced pessimism, consistent with the “growth holds, not surging” theme. These levels (especially France) still imply caution rather than exuberance.
6) Country-level labor: France unemployment edges higher
- France unemployment rate: 7.9% (vs 7.8% expected; prior 7.7%)
A small deterioration—consistent with a labor market that is not overheating. It slightly reinforces the ECB’s room to remain patient or dovish, especially alongside softer inflation in parts of the bloc.
7) Financial conditions: auctions mostly friendly, with a peripheral nuance
Sovereign issuance is generally priced with stable-to-lower yields, suggesting demand remains healthy:
- France BTF auctions: ~2.00–2.04% range (little changed; marginally lower vs prior)
- Germany 5Y Bobl: 2.400% (down from 2.470%)
- Germany 30Y Bund: 3.470% (down from 3.490%)
- Spain 3M Letras: 1.939% (down from 1.954%)
- Italy 12M BOT: 2.068% (down from 2.112%)
- Italy 3Y BTP: 2.36% (down from 2.48%)
- Italy 7Y BTP: 3.02% (slightly up from 3.00%)
Core and much of the curve priced more easily (yields down), while Italy’s 7Y small uptick hints at term premium/periphery sensitivity. Overall, funding conditions look orderly, not stressed.
Eurozone Weekly Outlook
Survey Week for Growth and Confidence — PMIs, ZEW, and Consumers in Focus
Next week is a survey-heavy test of the euro area’s “steady but fragile” backdrop. With the European Central Bank holding rates on 5 February and reiterating a data-dependent, meeting-by-meeting approach—while emphasizing inflation returning to target over the medium term—the market’s focus shifts to whether incoming confidence and activity gauges validate a soft recovery or revive downside growth risk.
The key question is whether sentiment and survey momentum confirm resilience (rather than acceleration), or whether trade headwinds—U.S. tariff pressure, intensified Chinese competition, and uneven domestic demand—reassert themselves as a binding constraint.
Key data and events (Feb 16–21)
Tue, Feb 17 — ZEW Economic Sentiment (Germany & Eurozone)
ZEW is one of the earliest high-frequency reads on February expectations. It can move rates and FX when it diverges materially from consensus because it directly shapes the market’s framing of Germany and the bloc—soft landing vs. stagnation.
Thu, Feb 19 — European Commission Flash Consumer Confidence (Euro Area / EU)
This is the cleanest near-term gauge of household sentiment, and it matters because the recovery is trying to transition from external support toward domestic demand. Improving confidence typically supports service activity and can be EUR-supportive if it aligns with firmer PMI momentum.
Fri, Feb 20 — HCOB / S&P Global Flash PMIs (Eurozone and majors)
This is the week’s primary macro catalyst. Flash PMIs deliver a compact read on:
- growth momentum (services vs. manufacturing),
- employment intentions, and
- prices charged / input costs (the survey inflation pulse).
For policy implications, services PMI and the price components tend to matter most for the ECB reaction function. A downside surprise—especially in services—would reinforce a market bias toward a prolonged pause and a more accommodative stance.
What matters most for the euro area narrative
1) Is the recovery improving—or merely holding?
Recent GDP and labor signals were “good enough,” but not decisive. The combined message from ZEW + PMIs + consumer confidence will determine whether markets upgrade the Q1 growth outlook or treat recent stability as temporary.
2) Inflation risk is quieter—but not gone
Headline inflation has cooled, but the ECB continues to stress uncertainty and data dependence. The key next-week check is PMI prices: if price components re-accelerate, it reduces market comfort with aggressively dovish ECB pricing.
3) Trade headwinds are becoming first-order
The trade narrative is shifting from tailwind to constraint, particularly with U.S. tariff pressure and stronger Chinese competition highlighted in recent reporting. This matters most for Germany’s export-heavy sectors (capital goods, autos, chemicals) and feeds through to the euro via growth expectations and broader risk sentiment.
Policy and geopolitics overlay the EU liquidity backstop/market structure
Recent reporting suggests the ECB may broaden access to its euro liquidity backstop/repo framework, with an announcement expected around the Munich Security Conference, where President Christine Lagarde is scheduled to speak. This is more market-structure than core macro, but it can influence risk premia and sensitivity to euro funding stress—especially in volatile risk-off conditions.
Euro Outlook: What Drives EUR Next Week
EUR direction over the coming days should be driven primarily by (1) Euro area survey outcomes (ZEW, flash PMIs, and consumer confidence) versus expectations and (2) risk sentiment tied to trade headlines. Tariff risk and intensified Chinese competition can weigh on the euro via growth expectations and wider equity/credit risk premia—even if the ECB remains formally “data-dependent.”
If ZEW improves meaningfully and PMIs—especially services—beat while price components remain benign, markets are likely to lean into a “recovery broadens without re-heating inflation” narrative. That combination tends to support EUR through tighter spreads and improved risk tone and can be particularly constructive versus USD and CHF.
If, however, PMIs show only modest expansion and confidence merely stabilizes, with no major escalation in trade-shock headlines, EUR is likely to trade more as a risk + rates function. In that scenario, upside may be limited unless U.S. data softens simultaneously—still a modestly constructive EUR setup, but not an aggressive bullish tone.
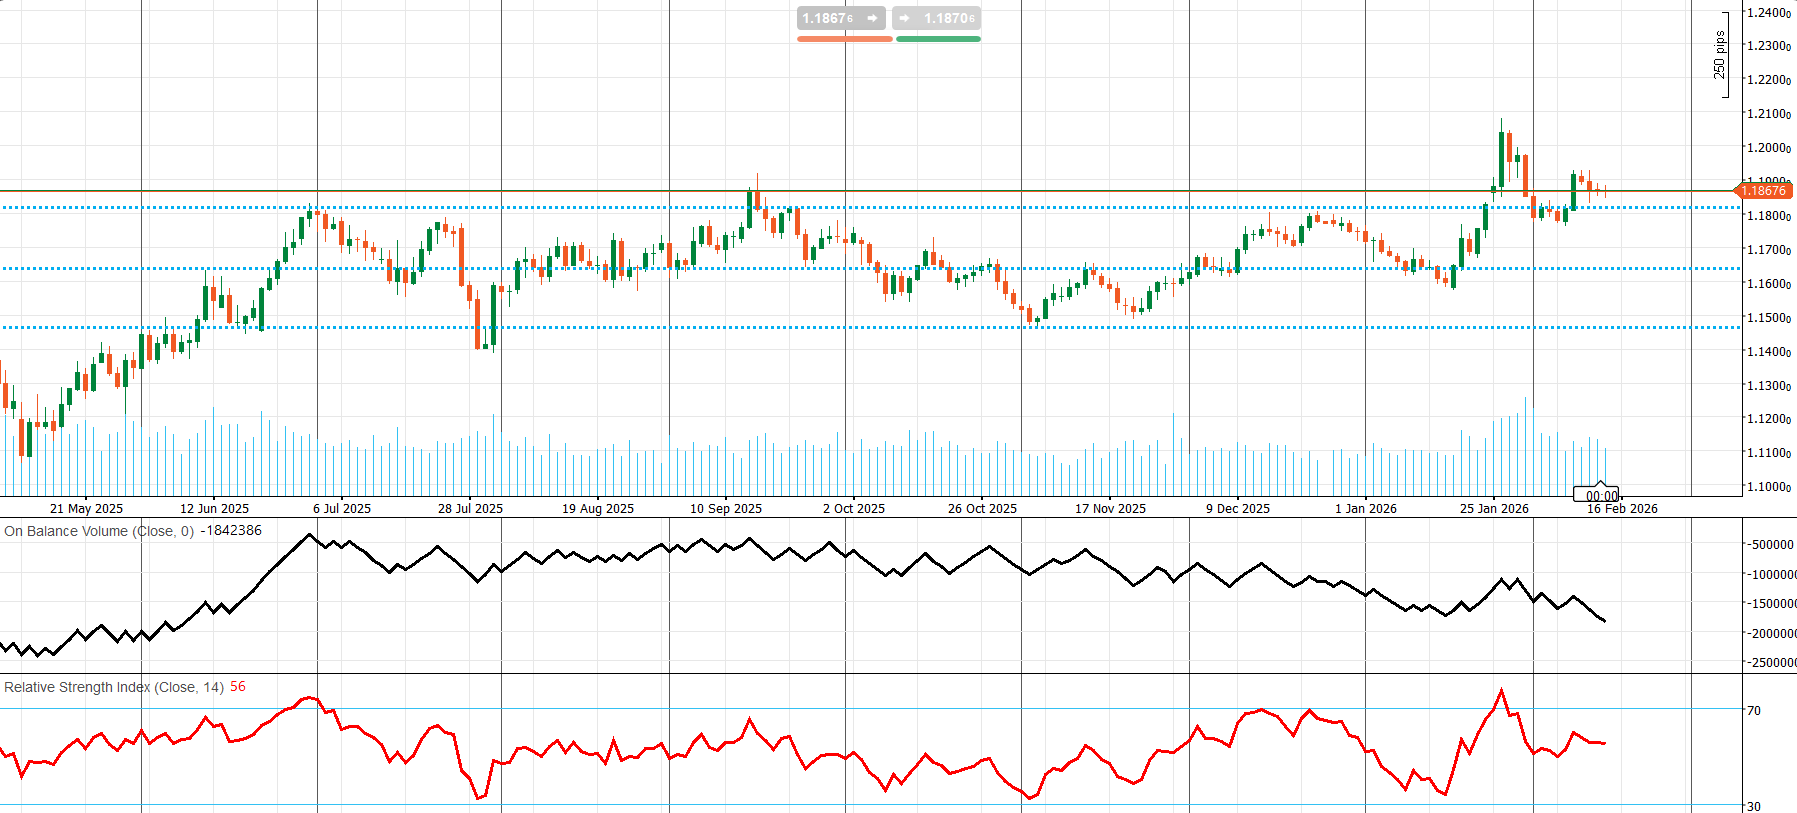
EURUSD Technical Analysis (Daily)
Breakout attempt, then rejection — now consolidating in a “hold-the-break” zone.
The medium-term trend (since May 2025) is broadly upward—price established a higher base versus mid-2025—although much of H2 2025 was range-bound. EURUSD broke out of that multi-month range in late January, spiked toward 1.20–1.21, then rejected sharply. The rejection wick in the ~1.20–1.21 area signals meaningful supply overhead, so bulls need confirmation via successful retests and higher daily closes.
Near-term structure is a tight consolidation around 1.18–1.19, which is the market’s pivot zone. In technical terms, this is a classic “impulse → pullback → decision” phase: either EURUSD holds above prior resistance (now support) and reloads higher, or it fails the breakout and rotates back into the old range.
Momentum & participation
- RSI ~56: bullish-leaning (above 50) but well below the breakout peak—consistent with consolidation after an impulse rather than a fresh momentum leg.
- OBV: trending lower in recent months and not confirming the breakout with a clean upswing. That’s a mild caution flag: price can still grind higher, but the tape is not showing strong “volume confirmation.”
Key levels (from the chart)
Resistance (needs reclaim to re-ignite upside):
- 1.1900–1.1930: first overhead supply/consolidation cap
- 1.2000: psychological magnet and decision level
- 1.2050–1.2100: spike zone/rejection high — sustained daily closes above this region would confirm a higher-quality breakout
Support (where breakout failure risk increases):
- 1.1800–1.1820: primary “hold-the-break” shelf (former resistance)
- ~1.1650: range midpoint / key horizontal level — likely next stop if 1.18 breaks
- ~1.1480–1.1500: lower range support — a move back here would strongly suggest the breakout failed and the pair reverted to its 2025 range regime
Gold Market Condition & Weekly Outlook (Fundamental)
Gold remains firmly supported above the psychological $5,000/oz threshold, with spot trading around $5,056/oz early on Feb 14. Over the past week, price action was primarily headline- and rates-driven: dips were consistently bought, while rallies tended to coincide with a softer USD, lower yields, and periodic bursts of risk-hedging demand.
Positioning looks a bit less “overheated” at the margin. COMEX gold open interest eased to roughly 407,591 (down about 1,664 on the cited session), suggesting some trimming rather than fresh leverage chasing at the highs.
What’s driving the gold market
1) Rates and real yields (the primary macro lever)
The key support has been the market’s tendency to fade growth and lean toward a “Fed hold now, potential easing later” narrative—typically compressing real yields and benefiting gold. January U.S. CPI cooled at the headline level (0.2% MoM; 2.4% YoY) while core remained firm (0.3% MoM), keeping the market in a “disinflation continues, but core is still sticky” regime. That mix makes gold especially sensitive to incremental data surprises in growth and core inflation.
2) USD direction
Gold has also responded cleanly to swings in the dollar. A softer USD improves affordability for non-USD buyers and has tended to coincide with gold rallies, reinforcing the FX channel as an important secondary driver.
3) Structural demand: central banks and ETFs
The deeper “floor” under gold remains strategic demand. The World Gold Council estimates central bank purchases of 863 tonnes in 2025—still historically elevated—and highlights expectations for continued ETF inflows and robust bar/coin demand amid persistent geopolitical risk. China illustrates that bid: WGC data show Chinese gold ETFs added RMB 44bn (US$6.2bn) and 38 tonnes in January, with AUM/holdings at record highs, while the PBoC extended its buying streak (15 consecutive months; +1.2 tonnes in January).
4) Risk hedging, portfolio insurance, and geopolitics
Gold continues to behave like a hedge asset when equity volatility rises and macro uncertainty spikes—especially when the rates impulse is supportive. Meanwhile, elevated geopolitical tensions—particularly around U.S.–Iran dynamics in the Middle East—add to the downside “insurance premium.” A sustained drop in gold would likely require either a material rebound in real yields and/or a clear de-escalation in geopolitical risk.
What to watch next: the catalyst map
The next directional leg is most likely to be decided by the rates complex—i.e., how markets reprice Fed policy through the lens of growth and inflation.
Key events for gold:
- U.S. market holiday (Mon): thinner liquidity can amplify moves.
- FOMC minutes (Wed): the balance of concern—inflation persistence vs growth risks.
- U.S. Q4 GDP + PCE inflation (Fri): the highest-impact macro cluster for gold because it directly resets real-yield expectations.
- Flash PMIs (Fri, global): can move yields quickly if they shift the growth narrative.
Rule of thumb: if the week’s data pushes real yields lower and/or the USD weaker, gold typically benefits. If data pushes real yields higher—especially via sticky inflation—gold can correct sharply.
Weekly outlook
Core setup: Structural demand (central banks/ETFs) remains a strong underpin, while macro oscillates between “headline disinflation” and “core stickiness,” producing two-way volatility around key releases.
Bullish path (extension higher):
- Softer PCE and/or weaker GDP/PMIs would likely pull yields lower and soften the USD.
- Renewed risk-off conditions could add incremental hedge demand.
- The combination of declining real yields + USD softness typically supports further upside in gold.
Bearish path (correction risk):
- Hotter-than-expected core PCE or FOMC minutes signaling less tolerance for inflation could push yields higher and firm the USD.
- That backdrop often accelerates profit-taking, especially with prices elevated, driving a pullback even if longer-term demand remains intact.
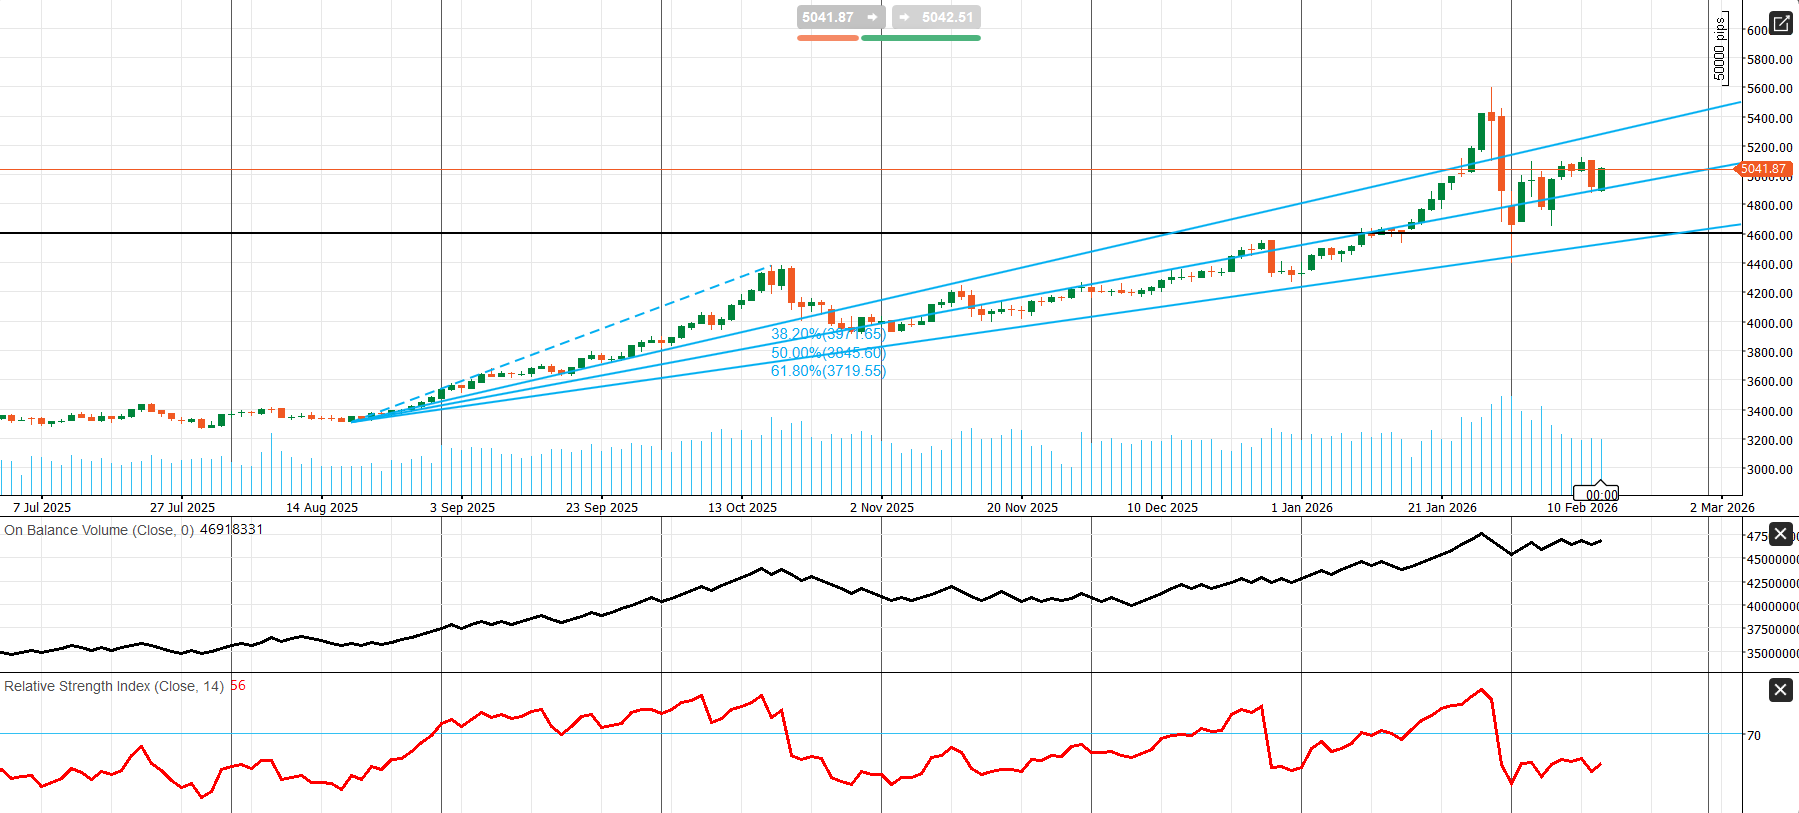
Gold Technical Analysis | Daily Chart
Bull Trend Intact, but the Post–Blow-Off Correction Is in “Repair Mode”
Gold remains in a bullish primary trend, but it is currently digesting a post-exhaustion move in a repair range rather than trending cleanly. The technical signal is straightforward: hold ~5,000 and reclaim ~5,200 to reload higher; lose ~5,000 and ~4,800/4,700 becomes the corrective roadmap.
Trend & structure
- Primary trend: bullish, defined by persistent higher highs and higher lows from late summer 2025 into early 2026.
- Channel behavior: price overextended above the upper channel and then snapped back inside—classic “exhaustion → correction → repair.”
- Current phase: a range/repair environment after a high-volatility reversal, not a fresh trend leg. The market is effectively deciding whether the pullback was reset before continuation or the start of a deeper correction.
Momentum & participation
- RSI ~56: constructive (above 50) and consistent with a market that remains bullish on balance, but not yet in a renewed breakout phase.
- OBV: broadly rising and holding near highs, supporting the larger bullish thesis (no clear “distribution rollover”).
- Volume: elevated around the reversal zone, consistent with a climactic move followed by consolidation.
Key levels to watch
Resistance (must clear to re-ignite upside)
- ~5,100–5,150: near-term ceiling of the consolidation range.
- ~5,200: next supply band; a clean reclaim shifts control back to bulls more decisively.
- ~5,400–5,500: prior spike high/major resistance; a break and hold above this zone would signal trend continuation and renewed upside potential.
Support (where structure starts to fail)
- ~5,000: psychological level and current pivot/acceptance zone (the most important “hold” level).
- ~4,800–4,900: post-reversal base; losing it increases the probability of a deeper correction.
- ~4,600–4,700: major horizontal support (thick black line area + lower channel region). A daily close below this zone would represent meaningful trend damage and shift the bias toward a larger retracement.
Energy Market Condition & WTI Weekly Outlook
WTI is trading in the low-$60s (roughly $62–63/bbl), with price action caught between a near-term bearish U.S. inventory impulse and ongoing geopolitical and policy optionality. The Energy Information Administration’s February STEO (as reported in the media) continues to frame a “build-in-inventories” world that keeps WTI sub-$60 on average through 2027—a useful strategic anchor even as weekly fundamentals drive significant short-term volatility.
1) The dominant fundamental: U.S. crude stocks surged
The latest official EIA weekly snapshot (week ended Feb 6) was decisively inventory-heavy:
- Crude inventories: +8.5M bbl to 428.8M bbl
- Gasoline inventories: +1.2M bbl, now ~4% above the five-year average
- Distillates: -2.7M bbl, ~4% below the five-year average
The composition matters. Crude + gasoline builds signal the market remains adequately supplied, while the distillate draw is the constructive offset—consistent with seasonal winter heating demand.
2) Refining and flows: lower runs + higher imports drove the build
The crude build was not purely a demand story; flow dynamics also contributed:
- Refinery inputs: ~16.0 mbpd, slightly lower week-over-week; utilization ~89.4%
- Crude imports: ~6.8 mbpd, up sharply week-over-week
This combination—softer refinery runs plus higher imports—is a classic setup for rising crude stocks even if end-demand is not collapsing.
Implied demand (“products supplied”):
- Total products supplied: ~20.8 mbpd, +2.4% y/y (supportive)
- Gasoline supplied: -0.7% y/y and distillate supplied: -3.2% y/y (soft undertone)
3) Supply framing: OPEC+ steady near-term, April is the pivot
OPEC+ remains in “pause” mode for Feb–Mar, but attention is shifting to whether supply increases resume in April—a decision expected around March 1 among key members. That looming optionality tends to cap rallies unless demand surprises meaningfully to the upside or geopolitics tighten supply.
4) Macro overlay: WTI remains sensitive to USD and yields
With markets oscillating between growth cooling and sticky core inflation, crude has traded partly as a macro risk asset. When the USD and yields firm, WTI typically struggles to extend. When they soften, WTI can bounce—but rallies are harder to sustain when inventories are building.
5) U.S. drilling: activity cooled slightly
Baker Hughes data show marginal cooling in drilling activity:
- Oil rigs: 409 vs 412 prior (down 3)
- Total rigs: 551 vs 551 prior (unchanged)
A modest decline in oil rigs is mildly supportive at the margin (less future supply growth), but the move is small. Markets typically watch the multi-week trend, especially alongside WTI prices and shale productivity.
WTI Weekly Outlook: Key catalysts and how it can trade
The main catalyst: next API/EIA inventory cycle
After a large build, the next inventory cycle becomes the immediate driver:
- The next EIA Weekly Petroleum Status Report is scheduled for Feb 19 (with American Petroleum Institute data typically the night before).
The key question is whether we see:
- A second consecutive build (bearish confirmation), or
- Normalization/draw driven by higher refinery runs, lower imports, or weather-related demand (fuel for a relief rally).
OPEC+ headlines setting the ceiling
Any incremental headline regarding the April supply policy can move to the top of the range. Recent reporting suggests a bias toward resuming increases from April to keep a headline cap on WTI unless the demand side improves.
Geopolitics: risk premium remains the swing factor
The largest tail risk is geopolitical. U.S.–Iran tensions, in particular, can quickly reprice the risk premium:
- If negotiations progress credibly, the risk premium can compress, and WTI may drift back toward or below $60.
- If talks disappoint, stall, or are cancelled, the risk premium can expand quickly, and WTI can spike above $65—at least temporarily—until the market gains clarity on escalation risk and potential supply disruption.
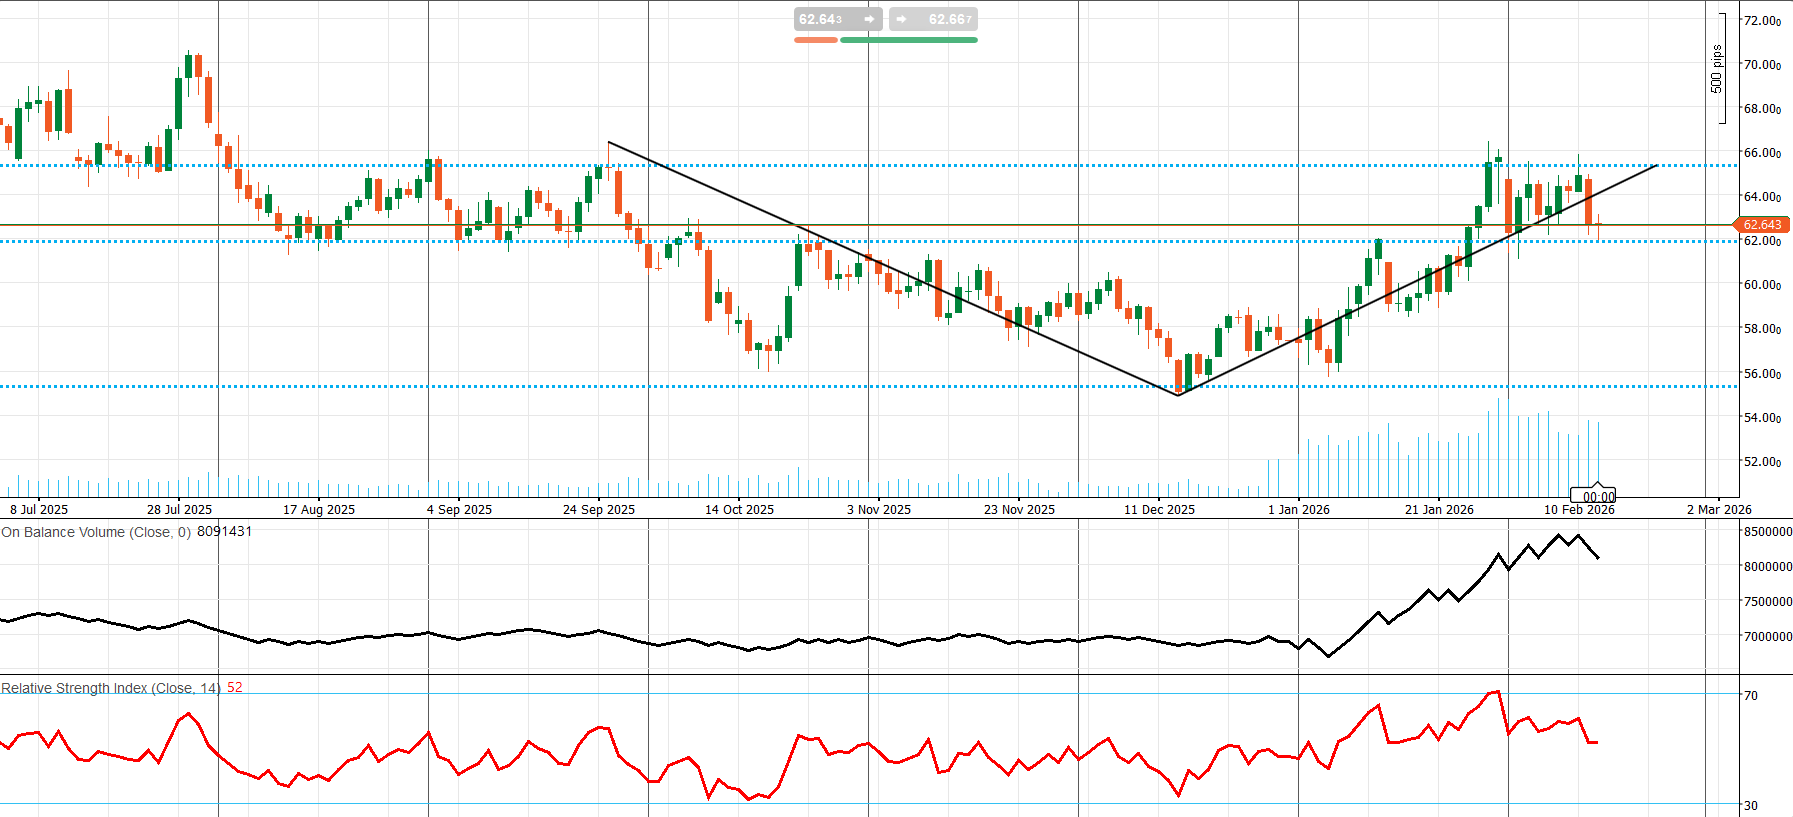
WTI Technical Analysis | Daily Chart
V-Shaped Reversal Completed, Now Consolidating Below Major Resistance
WTI has completed a strong rebound from the December low, but it is now stalling beneath a major resistance band (64–66). The tape is in a clear consolidation/decision phase: a break and hold above 66 would confirm bullish continuation, while a loss of 62 increases the probability of a pullback toward 58–59.
Trend & structure
- Primary trend (mid-2025 to Dec): bearish-to-sideways, with lower highs into the December low.
- Current swing regime: a bullish recovery leg from roughly ~55 into the mid-60s, but momentum has cooled.
- Current structure: a range just below resistance—typical of a market deciding between breakout continuation and mean reversion back toward support.
- The rising trendline from the December low remains intact, but price is still below the key horizontal ceiling—making this a classic “trend vs. level” battle.
Momentum & participation
- RSI ~52: neutral to slightly bullish—consistent with consolidation rather than a strong trend impulse. A sustained push back toward 60+ would signal renewed upside momentum.
- OBV: rose materially from early January (strong participation in the rebound) but is now flattening—consistent with a pause/absorption phase.
Key levels to watch
Resistance (breakout triggers)
- ~63.8–64.5: near-term supply where rallies have repeatedly stalled (top of the consolidation).
- ~66.0: major horizontal resistance and the primary breakout trigger.
- ~70.0–71.5: next upside zone if 66 breaks (prior swing area).
Support (where pullback risk increases)
- ~62.0: immediate pivot (price is sitting on/just above this zone).
- ~58.0–59.0: mid-range support shelf (multiple reactions across Nov/Dec/Jan).
- ~55.0–56.0: December low / major structural support; a break would invalidate the recovery and reopen the broader bearish path.
Crypto Market Condition and BTC Weekly Outlook
Bitcoin is still trading in a post-drawdown, high-volatility regime: price has rebounded toward the ~$70k area, but the market remains headline- and rates-driven, with sentiment still fragile.
What’s driving the tape right now (fundamental)
1) Macro is back in the driver’s seat (rates + USD).
BTC’s rebounds have been most durable when the USD softens, and real yields ease; conversely, any repricing toward tighter financial conditions tends to hit crypto faster than equities because liquidity is thinner and positioning is more reflexive.
2) Spot BTC ETF flows: still the cleanest “institutional tell,” but they’re choppy.
After the selloff, flows have shown bursts of net inflow (supportive) but also episodic outflows (capping rallies). CoinDesk reported back-to-back inflows totaling ~$616m in early February, a sign the institutional bid can return on dips.
At the same time, other flow trackers have printed mixed daily flow signals (i.e., not a straight-line “risk-on” trend).
3) Liquidity conditions: stablecoins are the plumbing—watch them closely.
Stablecoin supply is a proxy for deployable crypto liquidity. Yahoo cited DeFiLlama data showing total stablecoin market cap peaked around ~$311B in mid-January and sat near ~$309B shortly after.
Tether’s own report also framed the post-Oct liquidation environment as slower ecosystem growth, even as USDT increased modestly.
4) Miners: capitulation signals are a near-term overhang—but can become a bottoming input.
CoinDesk highlighted a sharp difficulty drop/miner stress, with hash-price economics under pressure. That can create forced selling into weakness, but historically, the later stage of miner capitulation often coincides with improving forward returns once selling exhausts.
5) Regulatory/event risk: Korea’s “Bithumb error” is a reminder that operational risk is real.
Reuters covered the incident and the subsequent push for tighter oversight, which matters because it can influence regional access, stablecoin policy direction, and broader risk premia.
6) On-chain positioning: supply overhead is meaningful.
Glassnode describes BTC as trading defensively with a $60k–$72k demand corridor absorbing sell pressure, while large supply clusters above can act as resistance during relief rallies.
BTC Weekly Outlook (Fundamental)
The week’s main catalysts (macro first, then crypto-native)
1) FOMC minutes (Jan 27–28 meeting) — Feb 18, 2:00 pm ET (Fed calendar).
BTC will trade the tone: anything that reads more inflation-worried / less dovish can push yields up and pressure crypto; a “comfortable with disinflation” tone typically supports risk assets.
2) U.S. GDP (Advance estimate, Q4 2025) — scheduled Feb 20 (BEA).
A downside surprise that pulls yields lower is usually BTC-supportive; a hot growth print can lift yields and weigh.
3) Data-release uncertainty from shutdown effects (watch the calendar closely).
Recent U.S. data disruptions have amplified “gap risk” because markets must trade with less information.
Crypto-native catalysts to monitor
- Spot ETF daily flow streaks (2–3 consecutive inflow days is the strongest “dip-bid” confirmation).
- Miner stress headlines / hash-price (capitulation news can pressure spot short-term, but also sets up eventual supply relief).
- Regulation headlines (especially Korea/US), after Bithumb’s incident, elevated scrutiny.
What I’d watch as the “highest signal” indicators (fundamental)
- 10Y real yields / USD reaction to FOMC minutes + GDP
- Spot BTC ETF net flows (streaks > single-day prints)
- Stablecoin supply + exchange balances as a liquidity check
- Miner stress signals (difficulty, hash-price, capitulation headlines)
- Regulatory shock risk (Korea/US)
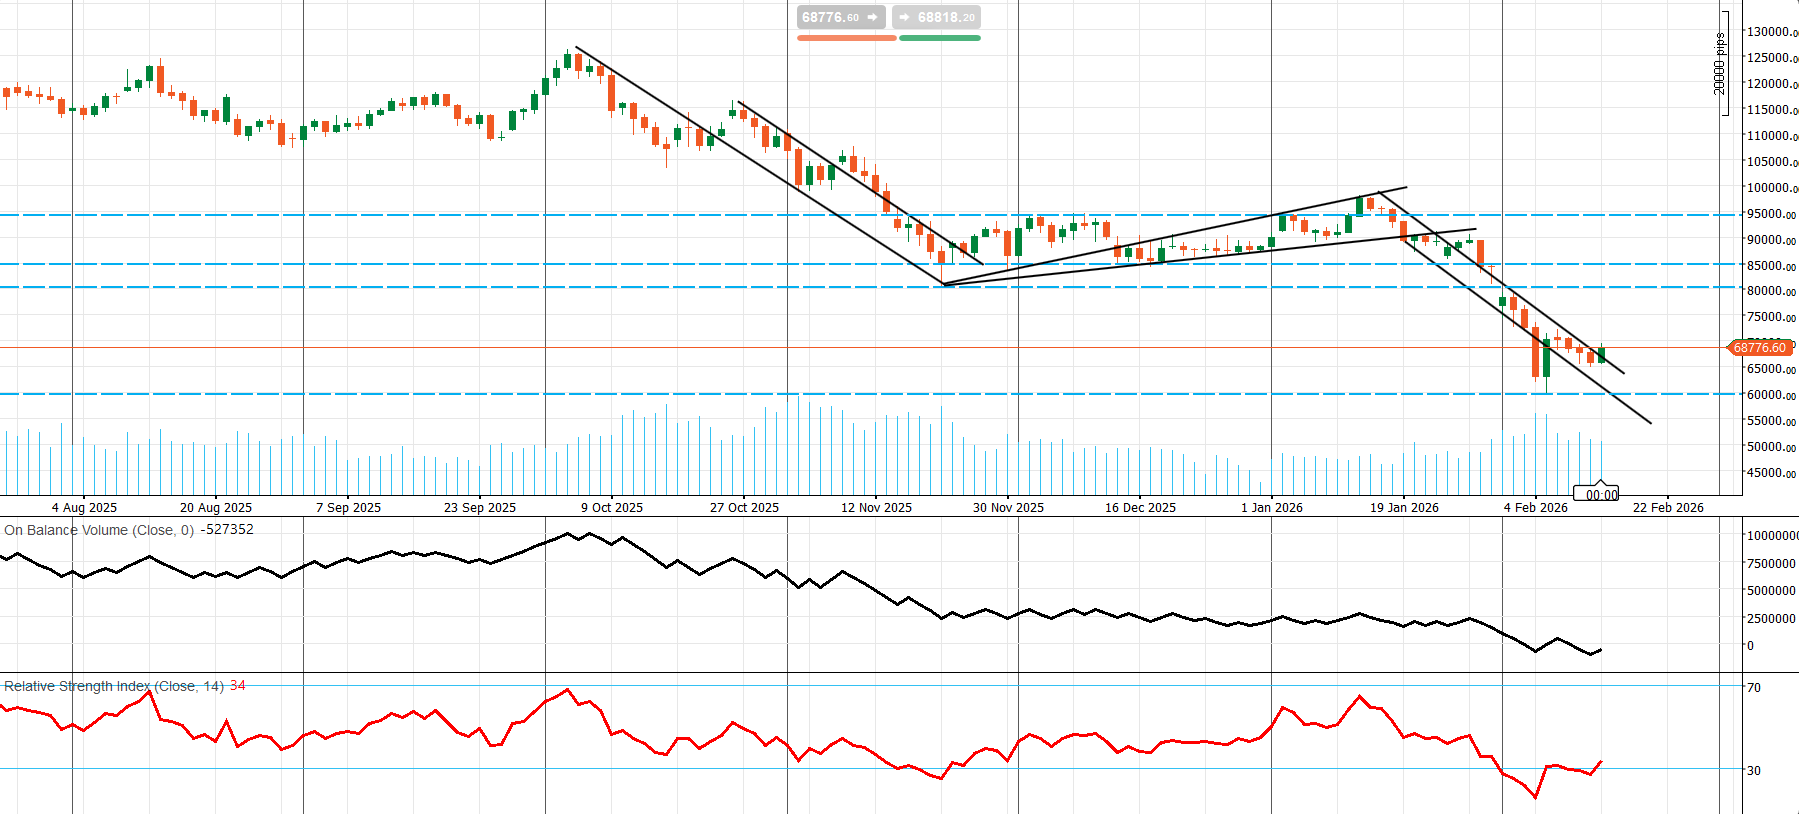
BTC Technical Analysis | Daily Chart
Breakdown From a Distribution Range — Now in a Bearish Channel With Oversold-Repair Risk.
BTC remains technically bearish on the daily. Price is still below key former supports and trading within a descending channel. Momentum conditions (RSI) suggest oversold-repair potential, but a durable turn requires confirmation—specifically a break above the channel and a reclaim of ~70k–72k, followed by ~80k. Until those levels are recaptured, rallies are vulnerable to selling pressure, and ~62k remains the critical “line in the sand” for the base.
Market structure and context
At approximately ~68.8k, BTC is in a clear downtrend from the October peak region (mid-120s). The January consolidation resolved lower and accelerated into early February. After tagging the low-60k area, the price is attempting to stabilize and rebound, but the move is still occurring inside a dominant descending channel. This is best described as a repair phase, not a confirmed trend reversal.
The primary trend remains bearish, defined by a sequence of lower highs and lower lows since the October top. The late-Dec/Jan ascending/sideways structure (wedge/flag) failed and broke down, triggering the sharp leg lower. Until BTC breaks the channel and repairs prior supports, upside moves should be treated as counter-trend rallies.
Momentum and participation
- RSI ~34: bearish momentum and near-oversold conditions (below 50 and hovering near 30). This often supports short-term bounces, but it is not, on its own, a reversal signal.
- OBV: trending lower and recently under pressure—consistent with distribution/exit liquidity during the selloff and a weaker participation backdrop for a sustained upside reversal.
Key levels to watch
Major resistance (rallies likely fade unless reclaimed)
- ~70k–72k: first overhead supply and near-term pivot; also aligns with the channel’s upper boundary zone.
- ~75k: next resistance shelf (prior reaction area).
- ~80k: major horizontal level (former support; likely strong resistance on first retest).
- ~85k: secondary major resistance (prior consolidation shelf).
- ~95k: range ceiling / prior breakdown zone (relevant only if the market meaningfully repairs).
Key support (where downside risk re-accelerates)
- ~65k: near-term support/pivot.
- ~62k: major horizontal support (lower dashed level); critical for base-building.
- ~60k: psychological level and likely liquidity magnet if 62k fails.
- ~55k → 50k: next downside ladder if the low-60s break with follow-through.
Comments