 English
 پارسی


Outside the United States, the calendar is equally active, keeping cross-market narratives in motion. The UK’s Office for National Statistics releases GDP, production, and trade data on February 12, offering a high-signal read on whether growth is holding up or losing traction. The Eurozone follows with updated growth numbers, China delivers an inflation checkpoint that speaks to demand conditions and lingering disinflation pressures, and Japan heads into a snap election after a bout of FX and bond-market turbulence—adding a political layer to an already sensitive policy and volatility backdrop. Put together, Week 6 keeps the “growth versus disinflation” debate at the center of price action, with rates, FX, and risk assets all primed to react.
Analytical Video
U.S. Economy in the past week
The week reinforced a familiar but unstable macro mix: growth improving, labor cooling, and inflation still sticky. Activity momentum strengthened—most clearly in manufacturing—while key labor-demand indicators continued to soften via weaker hiring signals, declining openings, and louder layoff headlines. At the same time, pricing pressure, especially in services, remained uncomfortably firm, keeping the two sides of the Federal Reserve’s mandate in tension. The macro signal was further muddied by Washington noise, including a brief partial shutdown that delayed major releases (notably pushing January payrolls to Wednesday, Feb. 11) and renewed attention on Fed leadership politics.
Growth and activity were led by a sharp manufacturing snap-back. The ISM Manufacturing PMI surged to 52.6 from 47.9, its strongest level since August 2022, and new orders climbed to 57.1, pointing to a meaningful improvement in demand momentum. The rebound looked credible across sources, with S&P Global Manufacturing PMI holding in expansion at 52.4. Services remained resilient but offered a less clean internal picture: ISM Services held at 53.8, yet new orders eased to 53.1 from 56.5, and the employment component slipped to 50.3, consistent with ongoing expansion but a more cautious hiring stance. A key nuance is that the manufacturing jump may not be purely end-demand driven. Commentary suggested post-holiday replenishment, restocking, and customers attempting to “front-run” cost increases—particularly where tariff risks could translate into higher input prices. Firms also flagged concerns over potential new tariffs, rising costs, and global uncertainty.
The most consistent incremental change this week was labor softening. ADP private payrolls rose just 22K, well below expectations. Initial jobless claims printed 231K, with continuing claims at 1.844M and the four-week average around 212K, with some reports noting severe weather as a factor. Layoff headlines intensified: Challenger job cuts rose to 108.4K, up 117.8% year over year—a noisy series, but one that can shape sentiment. Most importantly, the “demand side” of the labor market cooled further: JOLTS openings fell to 6.542M at end-December, roughly 10% lower year over year and the lowest since September 2020, reinforcing the idea that employers are becoming more selective. Traditional measures still imply a low-hire, low-fire environment, but the combination of falling openings and louder layoff announcements raises the odds that claims drift higher if labor demand deteriorates further. The labor market isn’t breaking, but it’s not out of the woods.
On the consumer side, sentiment improved—University of Michigan sentiment rose to 57.3—while inflation expectations were mixed: the 1-year eased to 3.5%, but the 5-year ticked up to 3.4%, keeping long-run credibility on the radar. The spending mix remains uneven and rate-sensitive. Consumer credit jumped to $24.05B, suggesting heavier reliance on borrowing, while MBA mortgage applications fell 8.9% week over week, even as the 30-year rate edged down to 6.21%. Auto sales cooled as well, with total vehicle sales around 14.90M. Net: confidence improved, but big-ticket demand is still constrained by rates, and the credit surge raises questions about how borrowing-supported consumption is becoming.
Inflation remains sticky where it matters most. Survey price gauges stayed firm: ISM Manufacturing Prices at 59.0 and ISM Services Prices at 66.6. That services reading is particularly important because services inflation tends to be more persistent and closely linked to wages and demand—exactly the area that keeps the Fed cautious even as labor cools.
Financial conditions offered a modest liquidity tailwind: the Fed balance sheet rose to $6.606T and reserve balances to $2.937T. But policy-regime uncertainty increased as markets digested renewed debate about Fed leadership and independence. Even if near-term liquidity improved, the week likely added a risk premium around policy credibility.
Energy inputs were broadly supportive of near-term tightness: EIA crude -3.455M, distillates -5.553M, gas storage -360 Bcf, with rigs holding at 412 oil rigs and 551 total.
Going forward, the trade-off is clear: growth is improving at the margin, but some strength may be inventory/tariff-positioning rather than durable demand. Labor is the key swing factor for dovish repricing if weakness persists. Inflation—especially services—limits how quickly the Fed can pivot. Markets face a tug-of-war between cooling labor (lower rate expectations) and sticky service prices (higher-for-longer pressure), with Fed independence headlines capable of injecting extra volatility into rates, USD, and equities.
US Macro Week Ahead (Feb 9–13, 2026):
Labor, CPI, and Heavy Treasury Supply
The U.S. macro message is straightforward: growth is holding up, but inflation is still the binding constraint. With activity improving and price components sticky, next week’s ECI → jobs → CPI sequence is the key catalyst chain for rates → USD → equities.
Policy and fiscal noise add a second layer. The shutdown is resolved, but DHS funding runs only through Feb 13, keeping late-week headline risk alive. Monday, Feb 16, is Washington’s Birthday, likely thinning liquidity and shaping positioning into the long weekend.
Calendar that matters
Mon, Feb 9 — Fed signal day (no major data)
• Fed Board closed meeting (discount/advance rates)
• Remarks: Jefferson, Waller, Miran discussion
Tue, Feb 10 — Wages, pipeline inflation, supply begins
• Employment Cost Index (Q4 2025)
• Import/Export Prices
• Treasury 3-year note auction
Wed, Feb 11 — Jobs + belly supply
• Employment Situation (January payrolls; delayed)
• Treasury 10-year note auction
Thu, Feb 12 — Duration demand test
• Bowman discussion
• Treasury 30-year bond auction
Fri, Feb 13 — Top catalyst + fiscal deadline
• CPI (January)
• DHS funding deadline: potential fiscal headlines
How it likely trades (USD and Wall Street)
1) CPI: “soft print” vs “sticky print.”
CPI is the market’s anchor. Base expectations lean to a softer headline but firmer core details:
• Core CPI: ~0.33% m/m (above the 12-month average), driven by residual seasonality plus delayed cost pass-through and restocking.
• Core goods: ~0.33% m/m, supported by used vehicles.
• Core services: ~0.33% m/m, with “other” services firm but health and motor-vehicle insurance softer.
• Headline CPI: ~0.25% m/m, as food and gasoline cool; energy services likely stay firm.
If realized, headline CPI y/y could drift toward ~2.4% and core y/y toward ~2.5%, but markets will trade the services mix more than the headline.
2) ECI + jobs = the Fed reaction bundle
ECI is one of the cleanest wage-cost signals the Fed watches. Pair it with payrolls/unemployment, and you have the week’s policy impulse. Street expectations cluster around ~70K–80K job growth with unemployment near ~4.4%, but the distribution matters more than the point.
3) Auctions can move the whole complex
With 3Y/10Y/30Y supply (Feb 10–12), watch bid-to-cover, indirect demand, and auction tails. Weak demand can lift yields and the USD and pressure equities—often immediately on auction afternoons.
4) Retail sales (Tue)
The question is whether year-end spending cooled. Watch the control group and rate-sensitive categories; a softer print reinforces the “cooling labor → slower consumption” channel.
5) Existing home sales (Thu)
Housing is stabilizing, but affordability remains the cap. A pullback toward ~4.15M would still be consistent with stabilization rather than reacceleration.
Bottom line: if CPI/services run sticky and auctions clear poorly, the bias is toward higher yields, a firmer USD, and heavier risk assets. If inflation surprises are softer and auctions are well bid, the macro impulse flips the other way—especially into the Feb 16 holiday window.
USD Technical Analysis in the Daily Chart
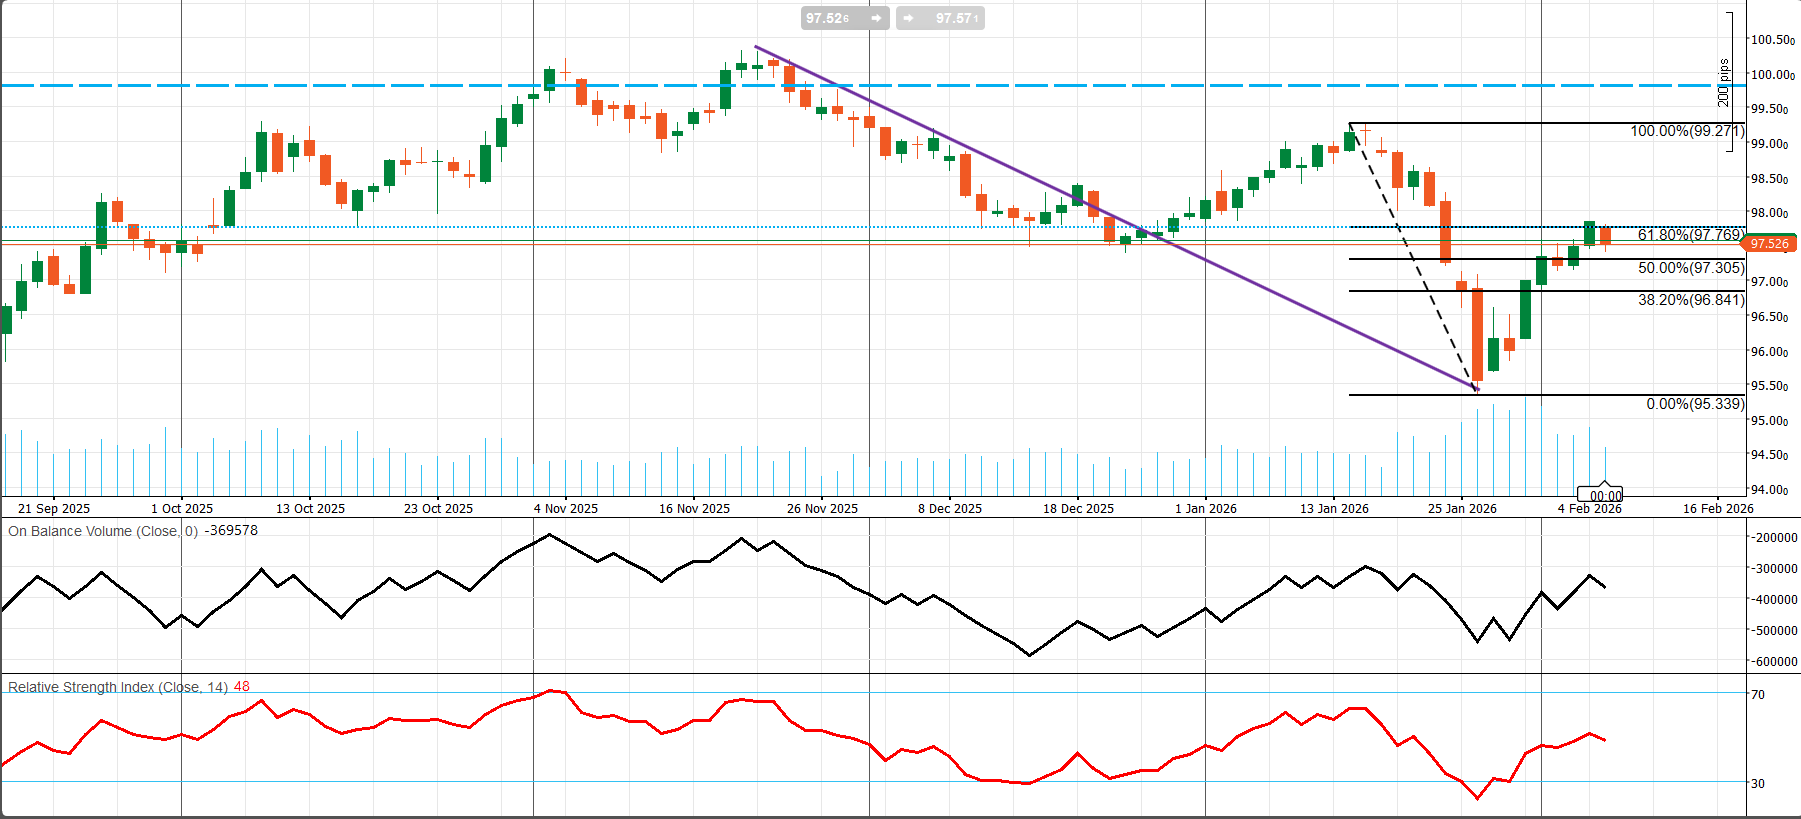
Primary trend since late November is still bearish (sequence of lower highs / lower lows), but the late-Jan selloff looks like a capitulation leg into 95.34 followed by a sharp mean-reversion bounce. Price has broken above the descending trendline (purple), which is typically a short-term reversal / relief-rally signal. It does not fully negate the broader downtrend unless the market starts reclaiming prior swing highs.
The late-Jan leg down was sharp and impulsive, followed by a V-shaped rebound into the Fib cluster — typical of fast mean reversion after a liquidity event.
The market is now in a decision band: if it can build acceptance above 97.77–98.00, the rebound can extend; if it rejects, the move often resolves as a lower high within the broader downtrend.
The retracement map of Fibonacci, based on the move, which is clearly trading around the Jan swing high → Jan swing low retracement:
- 0.0%: 95.339 (swing low / “line in the sand” support)
- 38.2%: 96.841 (first meaningful pullback support)
- 50.0%: 97.305 (pivot / “must hold” for bulls)
- 61.8%: 97.769 (major decision level)
- 100%: 99.271 (swing high / upside confirmation level)
Where price is now: ~97.53, i.e., between the 50% and 61.8% levels, slightly below the 61.8% retracement. That’s a classic zone where bear-market rallies often stall unless buyers can force acceptance above.
Momentum and participation (RSI + OBV)
- RSI ~48: momentum has recovered from oversold, but it’s still below 50, which often means the market is not yet in a “bull regime.” A sustained push above 50–55 would be a meaningful confirmation of trend improvement.
- OBV: rebounded after the late-Jan dump, but it hasn’t cleanly reclaimed prior peaks, suggesting the bounce still looks more like short-covering / relief than strong, persistent accumulation.
Key levels to trade around
Resistance (overhead supply): 97.77 (61.8%) – first big ceiling, above that we have ~98.00 – round-number / prior structure area (also aligns with the horizontal reference line on the chart), and then 99.27 (100%) – reclaiming this would be a full retrace and would materially improve the bullish case
Support (where bulls must defend): 97.30 (50%) – near-term pivot; losing it usually invites a deeper pullback, and then 96.84 (38.2%) – next support shelf, which if breached, then we have 95.34 (0%) – major support; a break reopens the downtrend
S&P 500 Technical Analysis (Daily)
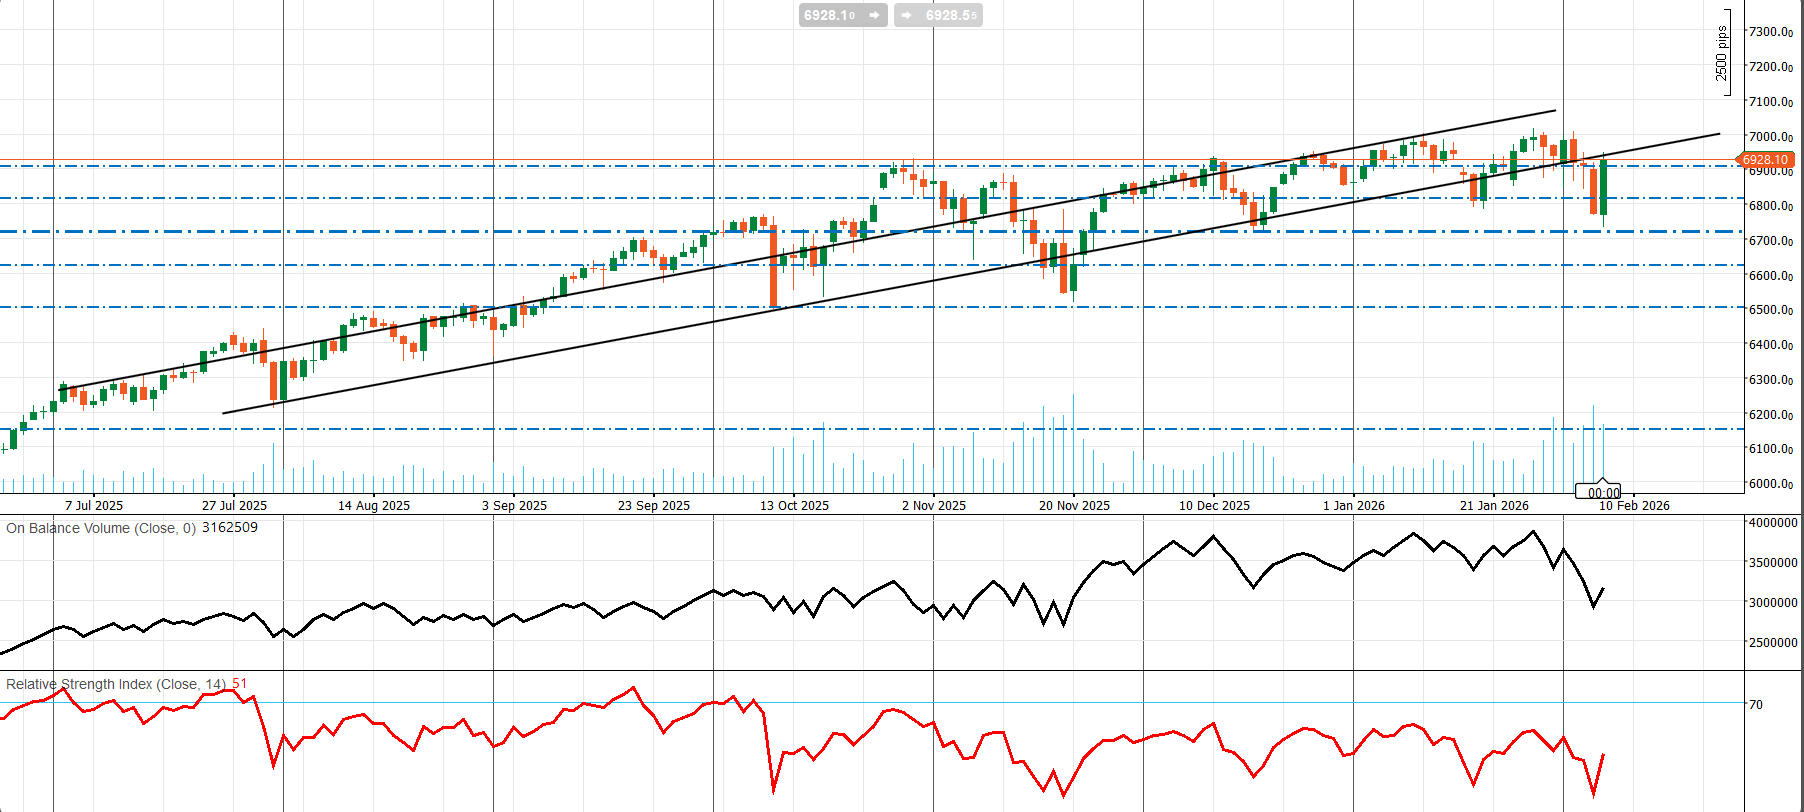
The primary trend since Jul 2025 until now is still up, with price respecting a rising structure for months. A rising channel has guided the advance. The last 2–3 weeks show distribution/volatility near the upper channel, followed by a sharp dip and a fast rebound. A breakdown attempt toward the lower band (~6,800 area) was quickly reversed with a strong bullish recovery candle back into the prior range. That often reads as a bear-trap / failed breakdown if follow-through holds.
The latest sequence looks like a sharp selloff, then a strong rebound (a reversal-style recovery candle). The technical “tell” now is whether price can hold above ~6,900 and build acceptance; otherwise, the rebound risks fading into a lower high under 7,000.
Momentum and participation (RSI + OBV)
- RSI (14) ~ 51: back to neutral after the selloff. This is constructive for stabilization, but it’s not a strong momentum regime yet. A sustained RSI hold >50–55 would support a renewed push higher.
- OBV: peaked, then dropped sharply during the selloff and is only partially recovering. That suggests the bounce may still need volume confirmation to turn into a clean continuation leg.
Key levels on the chart
Immediate pivot (battle zone) sits at 6,900–6,930, current price area (~6,928), and a major horizontal reference level. Above it = bulls keep control of the range, and below it = market risks sliding back toward lower supports.
Resistance (upside): 6,980–7,000: recent swing area + psychological round number. Then 7,050–7,100: upper channel zone (where prior rallies stalled).
Support (downside): We have 6,850–6,880: first support shelf (near the rising channel’s mid/lower structure). Lower, we can see 6,780–6,820, a key support zone (recent low + breakdown area). Finally, we can see 6,700, then 6,600–6,500: deeper supports if 6,800 fails.
UK Economy — Weekly Review (Week Ending Feb 7, 2026)
This week’s UK data and policy signals supported a narrative of gradual stabilization rather than acceleration. Business surveys remained expansionary and services-led, housing indicators showed modest firming as mortgage rates eased, and construction—while improving—still stood out as the clear laggard. The most important macro development came from the Bank of England: Bank Rate was held, but the vote split and guidance shifted meaningfully dovish, reinforcing market confidence that rate cuts are approaching. That easing bias can cap GBP upside even if domestic activity continues to stabilize.
1) Monetary policy: BoE held, but the easing bias strengthened
The Bank of England kept Bank Rate at 3.75%, yet the vote split carried the message: 5 members voted to hold, 4 voted to cut 25 bps, and none voted to hike. A “hold with a widening dovish bloc” is effectively a signal that policy is now biased toward easing, particularly if inflation and wage momentum continue to cool. Communication leaned dovish as officials noted that disinflation is progressing ahead of schedule relative to November projections. While inflation remains above the 2% target today, the BoE expects CPI to return to around the target starting in April.
Updated projections were also softer across the macro backdrop, pointing to lower growth, lower inflation, and a slightly higher peak in unemployment than previously expected. CPI inflation (average) was revised down to 2.0% in 2026, 1.8% in 2027, and 2.0% in 2028 (from 2.5%, 2.0%, and 2.1%). GDP growth was revised down to 0.9% in 2026 and 1.5% in 2027, while 2028 was nudged up to 1.9%. The unemployment rate is now projected to peak at 5.3% versus 5.1% previously. Policy implication: the decision reads as “hold for now, but preparing to ease.” A reasonable base case remains two 25 bps cuts (e.g., March and June), with risks skewed toward front-loading (e.g., March and April). If that path is realized, a plausible terminal rate is around 3.25%.
2) Activity: services-driven expansion; manufacturing stabilizes; construction still contracts
Business surveys improved broadly. Manufacturing PMI rose to 51.8 (back into expansion), Services PMI held a solid 54.0, and the Composite PMI printed 53.7, consistent with broad-based growth. Construction PMI improved sharply to 46.4, but it remains below 50, so the sector is still contracting—just less severely than late 2025. The takeaway is a firmer, services-led growth pulse, with manufacturing stabilizing and construction remaining the main drag.
3) Housing and credit: early signs of stabilization
Housing data surprised modestly to the upside. Halifax HPI rose 0.7% m/m and 1.0% y/y, while Nationwide HPI rose 0.3% m/m and 1.0% y/y. Mortgage rates eased to 6.62% from 6.77%. Housing is not “booming,” but the combination of slight price firmness and marginally easier financing supports a stabilization theme as conditions stop tightening further.
4) Consumer demand: steady, not strong
New passenger car registrations came in at 144,127 in January, up 3.4% y/y, a touch slower than the prior pace. The signal is modest momentum rather than a surge—consistent with a soft-landing-style slowdown, not a sharp downturn.
5) Rates and funding: long-end sensitivity remains
Even as the BoE leaned dovish, funding costs at the long end stayed sensitive: the 10-year gilt auction cleared at 4.585%, up from 4.456%. This matters because duration pricing can remain sticky even when rate-cut expectations build, tightening financial conditions at the margin and keeping GBP sensitive to global term premia.
Bottom line: The week’s flow supports a measured UK stabilization: PMIs are expansionary and services-led, housing is firming modestly, and construction is improving but still contracting. The dominant macro signal is the BoE’s dovish shift, reinforcing “steady growth with an easing bias.” That bias can limit GBP upside if cut expectations continue to rise, even as domestic activity stops worsening.
UK Week Ahead (Feb 9–14, 2026): GDP Stress-Test for a Divided BoE
Next week’s UK macro focal point is the ONS data cluster on Thursday, Feb 12 (07:00 London): the first estimate of Q4 GDP, monthly GDP (Dec), Index of Production (Dec), and UK Trade (Dec). Coming immediately after the Bank of England held Bank Rate at 3.75% on a tight 5–4 vote, markets are unusually sensitive to whether growth is simply “soft-but-stable” or starting to roll over. That distinction will drive how quickly rate-cut pricing can build—and how GBP and gilts respond.
Why Thursday’s “data dump” matters
The policy setup has shifted. Disinflation is progressing, and BoE officials now expect inflation to cool toward the 2% target from April, which increases the near-term weight of the growth signal in the reaction function. With an already “live” dovish bloc revealed by the 5–4 split, weak activity data could pull forward expectations for easing.
The key market question is not just the headline GDP print, but the composition. A stable GDP headline accompanied by weak production and deteriorating trade would still read as downside risk to growth momentum and may encourage markets to price earlier cuts. Conversely, a “stable-but-soft” profile across production and trade supports the BoE’s preferred narrative of gradual easing rather than urgency.
Calendar and what markets will watch
Tuesday, Feb 10
- BRC Retail Sales Monitor: a quick read on consumer momentum and demand conditions.
- DMO gilt auction (4⅛% Treasury Gilt 2031): a clean test of investor appetite for duration and rate sensitivity.
Wednesday, Feb 11
- BoE James Talbot (speech text): often relevant for policy framing and financial-stability messaging.
Thursday, Feb 12 — Main catalyst for GBP and gilts
- ONS cluster: Q4 GDP (first estimate), monthly GDP (Dec), production (Dec), trade (Dec).
- Referenced consensus: monthly GDP +0.1% m/m, Q4 GDP +0.2% q/q, Q4 GDP +1.2% y/y.
Friday, Feb 13
- BoE Chief Economist Huw Pill (fireside chat): watch for pushback against “easy disinflation = fast cuts,” and clues on how the BoE balances growth risks versus sticky services/wage dynamics.
Baseline and risk distribution
Baseline expectations imply modest Q4 growth and broadly steady monthly activity. However, risks look skewed to the downside if industrial output and trade disappoint. With PMIs showing services/composite expansion but construction still weak, growth likely remains uneven—making production and trade details as important as the GDP headline for pricing the week in GBP and gilts.
GBP, gilts, FTSE In the week Ahead
From the fundamental point of view, if GDP or production undershoots, markets pull forward BoE easing expectations, which ends with front-end yields lower, GBP softer, and rate-sensitive equities catch a bid. On the flip side, firmer GDP + production rebound will bring the cuts priced later, yields stay sticky, GBP supported, FTSE reaction depends on global risk tone.
GBPUSD Technical Analysis (Daily)
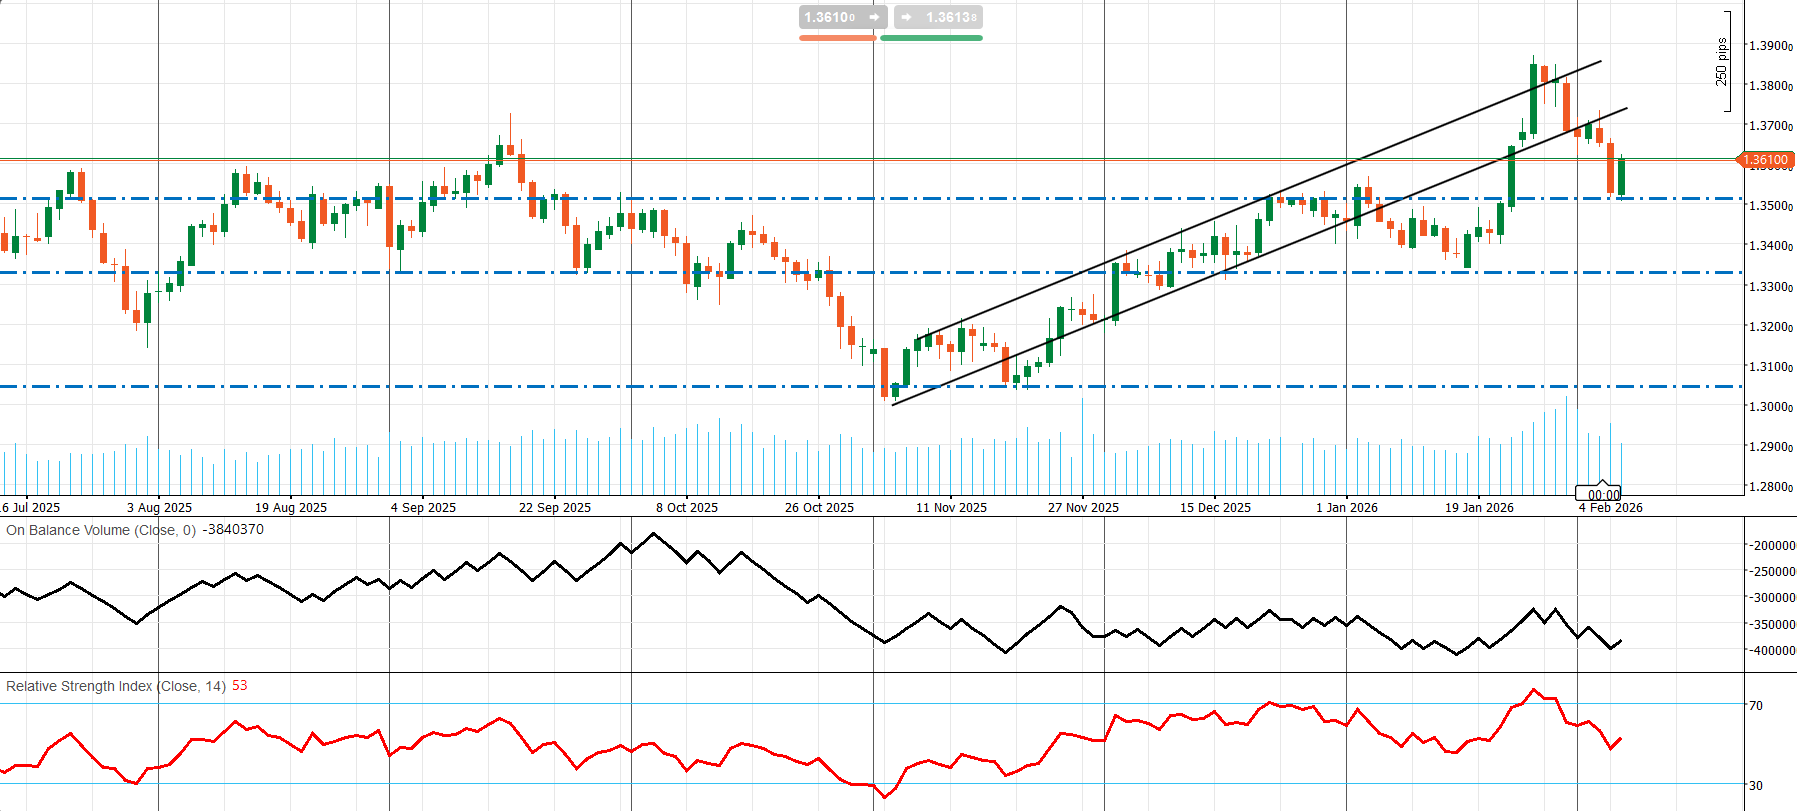
Since early November, it is still uptrend, built via a clear rising channel. But from Late January, the uptrend is in a corrective phase. Price broke down out of the rising channel after topping near the 1.38–1.39 area, then snapped back with a strong rebound candle. Which means the market is now in a “make-or-break retest zone”—either it reclaims broken structure and resumes the uptrend, or the rebound fades into a lower high.
Momentum and participation (RSI + OBV)
- RSI ~53: momentum is still slightly bullish/neutral (above 50), but it has rolled over hard from the prior rally. A sustained push back toward 55–60 would strengthen the bullish case.
- OBV: generally soft/negative relative to earlier peaks, which hints at distribution—i.e., the rally into 1.38–1.39 wasn’t confirmed by clean accumulation. That makes this rebound more vulnerable unless OBV improves.
Key levels on the chart (most actionable)
Currently, as a pivot point, 1.3610 (red horizontal), is the key decision level. Holding above it means rebound has legs, while rejection below it will tell thatrebound is likely corrective.
Resistance: 1.3700–1.3750, the area of the broken channel / prior swing zone (a common “sell-the-retest” region in pullbacks). Then, higher, 1.3820–1.3900, is the prior peak zone (trend continuation only if price can reclaim this area).
Support: About1.3520–1.3530 (blue dashed) is the immediate support / the level that just triggered the rebound. Lower, ~1.3330 (blue dashed), will be the next major support shelf (former range floor). And finally, ~1.3050 (blue dashed) is deep support / swing-zone from the prior selloff base.
Gold’s $5K Era: Safe-Haven Bid vs. Rate-Shock Volatility
Gold has entered a new regime: high price, high volatility. January’s surge briefly carried spot above $5,000 and set fresh records, but the move quickly morphed into a violent liquidation event—at one point nearly 10% intraday—before stabilizing and rebounding off key support. The pivot was not a slow shift in inflation or jewelry demand; it was a rapid repricing of U.S. rate expectations, amplified by tighter trading conditions (including higher CME margin requirements) after President Trump nominated Kevin Warsh for Fed Chair. In short, gold flipped from “safe-haven momentum” to rate-driven de-leveraging, producing an abrupt drawdown of roughly $1,000 in two days, then a partial recovery as volatility cooled.
What changed in January: from fear premium to credibility reset
Early January price action was driven by stacked headline shocks that reinforced the safe-haven bid: geopolitics, tariff-related narratives, and heightened policy uncertainty helped push gold sharply higher toward the upper end of its range. As some of those catalysts faded, the market’s attention narrowed to a more powerful driver: Fed credibility risk—the perception that policy independence could be challenged. That risk premium became a core input to gold’s rally.
Then the shock reversal: the Warsh nomination was widely read as reducing perceived Fed-interference risk and leaning more hawkish/institutional. The market quickly translated that into USD strength and higher real-rate expectations, which is a classic headwind for gold. With positioning extended and liquidity conditions tightening, the adjustment became disorderly: forced selling replaced defensive accumulation.
What drives gold now: a macro “fundamental stack.”
Gold is trading macro-first—rates, volatility, geopolitics—not “jewelry-first.”
- Geopolitical premium: Renewed Middle East tension and U.S.–Iran dynamics continue to provide an embedded risk premium.
- Rates and bond volatility: Gold remains highly sensitive to real-rate expectations and term-premium swings. When rates reprice quickly, gold tends to gap and overshoot.
- Institutional flows (ETFs): Large January inflows into physically backed gold ETFs created a structural bid under dips—an important stabilizer when leveraged players are forced out.
- Official sector demand: Central-bank buying remains historically elevated, supporting the longer-run floor even if the pace fluctuates year to year.
Bottom line: the backdrop is supportive, but the path is being dictated by rate shocks, liquidity, and volatility, not a smooth grind higher.
XAUUSD technicals: bullish structure, violent reset
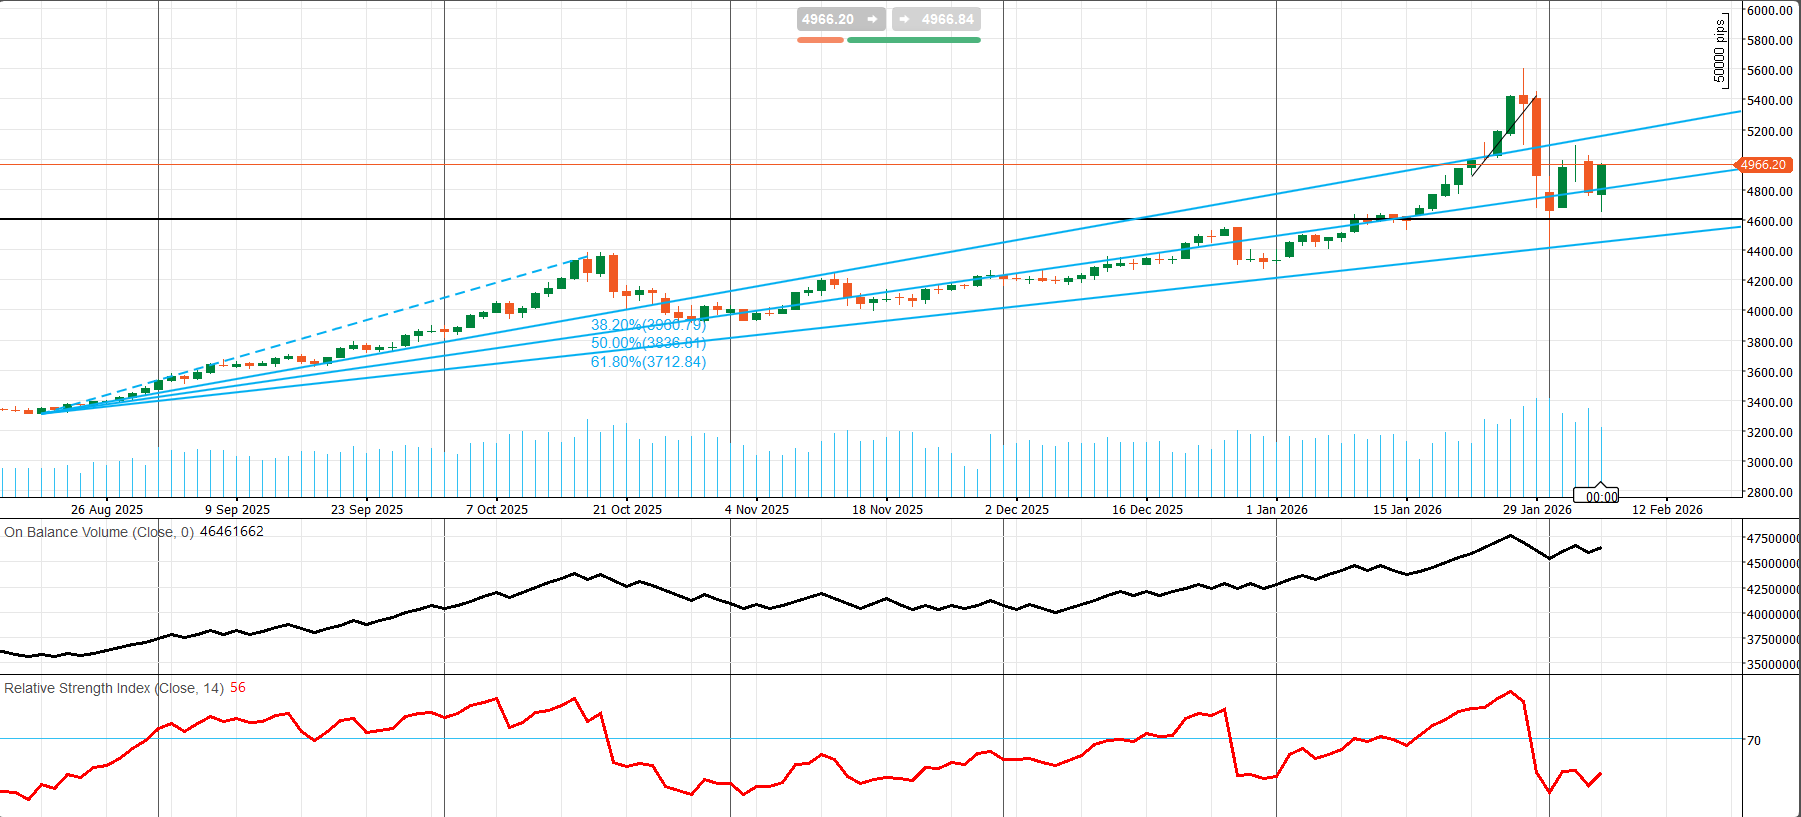
Structurally, gold remains in a bull trend dating back to mid-2025, with price respecting a rising channel for months. The late-January surge looked like a blow-off acceleration into the channel’s upper boundary, followed by a sharp mean reversion back inside—classic “high-volatility reset” behavior rather than a clean trend break.
Gold is now consolidating around a key pivot near 4,966, which acts as the market’s “line in the sand”:
- Above 4,966: the tape reads as repair/rebuild with potential to re-extend.
- Below 4,966: downside risk rises for another leg lower inside the still-bullish channel.
Momentum, participation, and key levels
Momentum has recovered (RSI back in mildly bullish territory), while participation indicators remain broadly constructive despite the shakeout—consistent with accumulation surviving volatility.
Upside levels: 5,100–5,200 (retest zone), then ~5,400 (continuation gate), and ~5,600 (major supply/blow-off high).
Downside levels: ~4,800 (first shelf), ~4,700 (must-hold), ~4,600 (channel support), then ~4,400 if support fails.
Positioning takeaway: gold remains structurally bullish, but volatility is the regime. The next directional cue is whether price can reclaim and hold 5,100–5,200 (continuation) or breaks 4,700 (deeper correction).
WTI: Geopolitical Premium Intact, but Inventories Are Setting the Floor
WTI finished the latest session around $63.55/bbl (Brent near $68.05/bbl) after a choppy week in which U.S.–Iran tensions and diplomacy kept a geopolitical risk premium embedded in the tape. But near-term pricing is being anchored less by headlines and more by inventory and product-balance mechanics.
Fundamentals: crude and distillate draws are supportive—gasoline is the risk
The latest U.S. government inventory snapshot was broadly constructive:
- Crude: -3.5 mb draw
- Distillates: -5.6 mb draw (tight products remain the key support)
- Gasoline: +0.7 mb build
- Refinery runs: ~16.0 mbpd
- Utilization: ~90.5%
Market read-through is straightforward: as long as distillates keep drawing and refinery utilization stays elevated, the market can justify a fundamentals-led floor in WTI. The main near-term vulnerability is a rebuild in U.S. stocks—especially if gasoline builds persist and the product tightness narrative fades.
Supply: OPEC+ discipline matters more than a modest U.S. rig uptick
On supply, OPEC+ reiterated its pause on planned production increases into Feb–Mar, limiting near-term supply pressure. In the U.S., drilling activity edged up slightly:
- Oil rigs: 412
- Total rigs: 551
Net: OPEC+ discipline is the larger short-term stabilizer. The rig uptick is more relevant for the medium-term supply horizon than as an immediate driver of front-month prices.
Cross-currents: Europe gas sensitivity and sanctions re-routing risk
Europe remains winter-sensitive. Reports highlighted stronger year-on-year TurkStream flows into Europe in January and European gas storage around 44% in late January—supportive for gas-linked volatility and, at the margin, middle-distillate pricing. Politically, Trump’s comments about India buying Venezuelan oil (and China being “welcome” to buy) add another layer of potential barrel re-routing and sanctions-related flow shifts.
Week-ahead catalysts: what the “oil tape” will trade
Key scheduled events:
- EIA STEO: Feb 10
- OPEC MOMR: Feb 11
- API: Tuesday ~4:30 pm ET (informal signal)
- EIA weekly inventories: Feb 11 (Wed 10:30 am ET)
- IEA OMR: Feb 12
Bias: a fundamentals-driven floor remains plausible while distillates keep drawing and OPEC+ stays disciplined. Downside risk rises quickly if U.S. inventories rebuild or macro/rates tighten financial conditions. Upside-down tails remain tied to any Middle East escalation headlines.
WTI technicals (Daily): bullish recovery, now consolidating
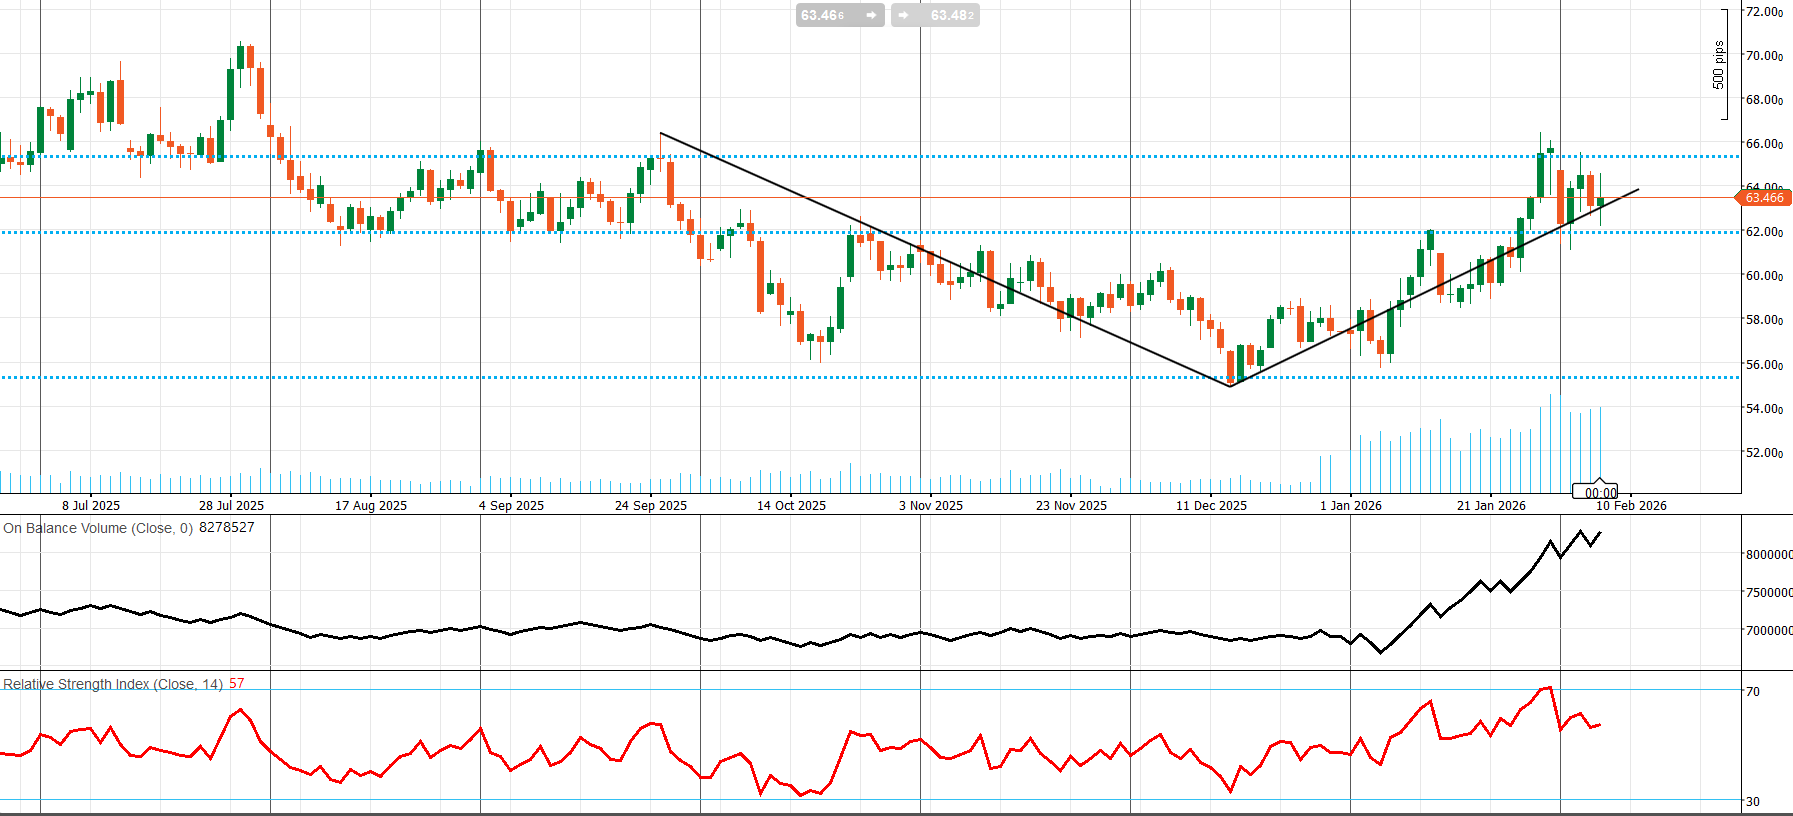
WTI bottomed near ~55.5 in mid-December and has since built a higher-high / higher-low recovery structure, tracking rising support. After rallying into ~66–66.5, it pulled back and is now consolidating near ~63.5 on/near rising trend support—typical “cool-off/reset” after a momentum leg.
- RSI ~57: mildly bullish; consistent with dips being bought
- OBV: strong upturn into February; constructive accumulation signal
Key levels:
- Pivot: ~63.45 (hold = recovery intact)
- Resistance: ~64.0, then 65.5–65.8, then 66.5–67.0 (breakout confirmation)
- Support: ~62.2 (break = deeper reset), then ~60.0, then 55.5–56.0 (December base “must-hold”)
Bottom line: WTI still carries a geopolitical premium, but the near-term floor is being defined by inventory-driven fundamentals—especially distillate tightness. Technically, the market is in a bullish recovery consolidation: the next directional cue is whether price reclaims 64 and works toward 65.5, or loses 62.2 and forces a deeper reset.
Current Crypto Market Conditions and BTC Weekly Outlook
Fundamental Items!
Bitcoin is still trading in a high-volatility, thin-liquidity regime, and the market tone remains macro-driven rather than crypto-native. The latest selloff has effectively unwound the post–Trump-election rally, and the central risk is that liquidity has not normalized—so BTC can still move sharply on relatively modest flows. This fragility has been a theme since the October flash-crash episode, when a tariff-driven shock triggered what was described as the largest liquidation event in crypto history and flushed leverage that has not rebuilt stably.
Market microstructure: depth is thinner, “air pockets” are more likely
The most tangible sign of fragility is market depth. Measures cited from Kaiko show BTC’s average 1% market depth has steadily compressed—from >$8M during 2025, to about $6M after Oct 10, and now closer to $5M. In practice, there is simply less size sitting near the market, so orders that would have been absorbed cleanly months ago can now produce larger, faster swings. That’s the backdrop for the “air-pocket” behavior traders have been dealing with: sharp drops, sharp rebounds, and wide intraday ranges even when the surface narrative looks calmer.
Macro is driving the de-leveraging phase
The selloff has tracked broader anxiety around stretched tech valuations and an uncertain path for U.S. rate cuts. The Jan 30 shock—when both crypto and precious metals sold off—was amplified by Donald Trump signaling intent to nominate Kevin Warsh for Fed Chair. The coverage linked that headline to a repricing of rate expectations and renewed concern about balance-sheet tightening risk—both negative for speculative assets that behave like high-duration bets. In other words, BTC has been priced less as a standalone “store-of-value” narrative and more as a function of the discount rate, real yields, and the dollar.
Forced liquidation remains the key micro driver
At the micro level, the market is still digesting the consequences of forced de-risking. Recent declines triggered roughly $2.56B in BTC liquidations (as cited via CoinGlass). That is a strong signal that leveraged positioning became crowded and then got forcibly unwound. Post-liquidation markets often trade in jolts: rebounds can be violent on short squeezes, but pullbacks can also be abrupt because liquidity is thin and risk appetite stays cautious. This is why derivatives mechanics remain central—especially CME Group conditions, margin dynamics, and futures positioning—because they dictate how quickly stress propagates when volatility spikes.
ETF flows are the real-time “risk switch.”
Spot BTC ETF flows have turned into a live proxy for risk-on/risk-off. Instead of persistent accumulation, flows have been two-way: large outflow days (reporting cited roughly $272M net outflows on Feb 3) alternating with intermittent inflows. That pattern fits a market that is not committed to direction and is reacting to the same macro stress signals driving equities and rates.
The “Trump effect” is supportive, but not the upside catalyst many priced
Bitcoin surged after the election on expectations of a broadly crypto-friendly pivot and a meaningful strategic reserve. The administration delivered some supportive steps—most notably a more favorable regulatory stance via the U.S. Securities and Exchange Commission and new rules aimed at dollar-pegged tokens, plus an executive order establishing a bitcoin reserve from seized assets. But the bigger catalyst many hoped for—large-scale government buying—has not appeared. That expectation gap likely reduced upside impulse just as macro headwinds and liquidity constraints intensified.
Week-ahead outlook: BTC will trade rates, not ideology
The week ahead is macro-heavy. The delayed Employment Situation report (Feb 11) and January CPI (Feb 13) are marquee catalysts because they can move real yields and the dollar quickly. Heavy Treasury supply (3Y Feb 10, 10Y Feb 11, 30Y Feb 12) adds another layer: weak auctions can lift yields intraday and tighten financial conditions, typically bleeding into BTC via a higher discount rate and wider risk premia. Fed commentary keeps reaction-function risk live—small tone shifts can matter when liquidity is thin.
Scenario map
- Softer inflation + softer labor: yields cool, USD softens → better conditions for a rebound, especially if ETF flows stabilize and liquidation pressure fades.
- Hot CPI or firm jobs + weak auctions: yields rise, USD strengthens → higher probability of a retest of recent lows as risk appetite deteriorates.
- In-line data: BTC likely takes cues from positioning and flows (ETF prints, funding, any renewed liquidation bursts) more than narrative.
BTCUSD Technicals (Daily): post-breakdown stabilization
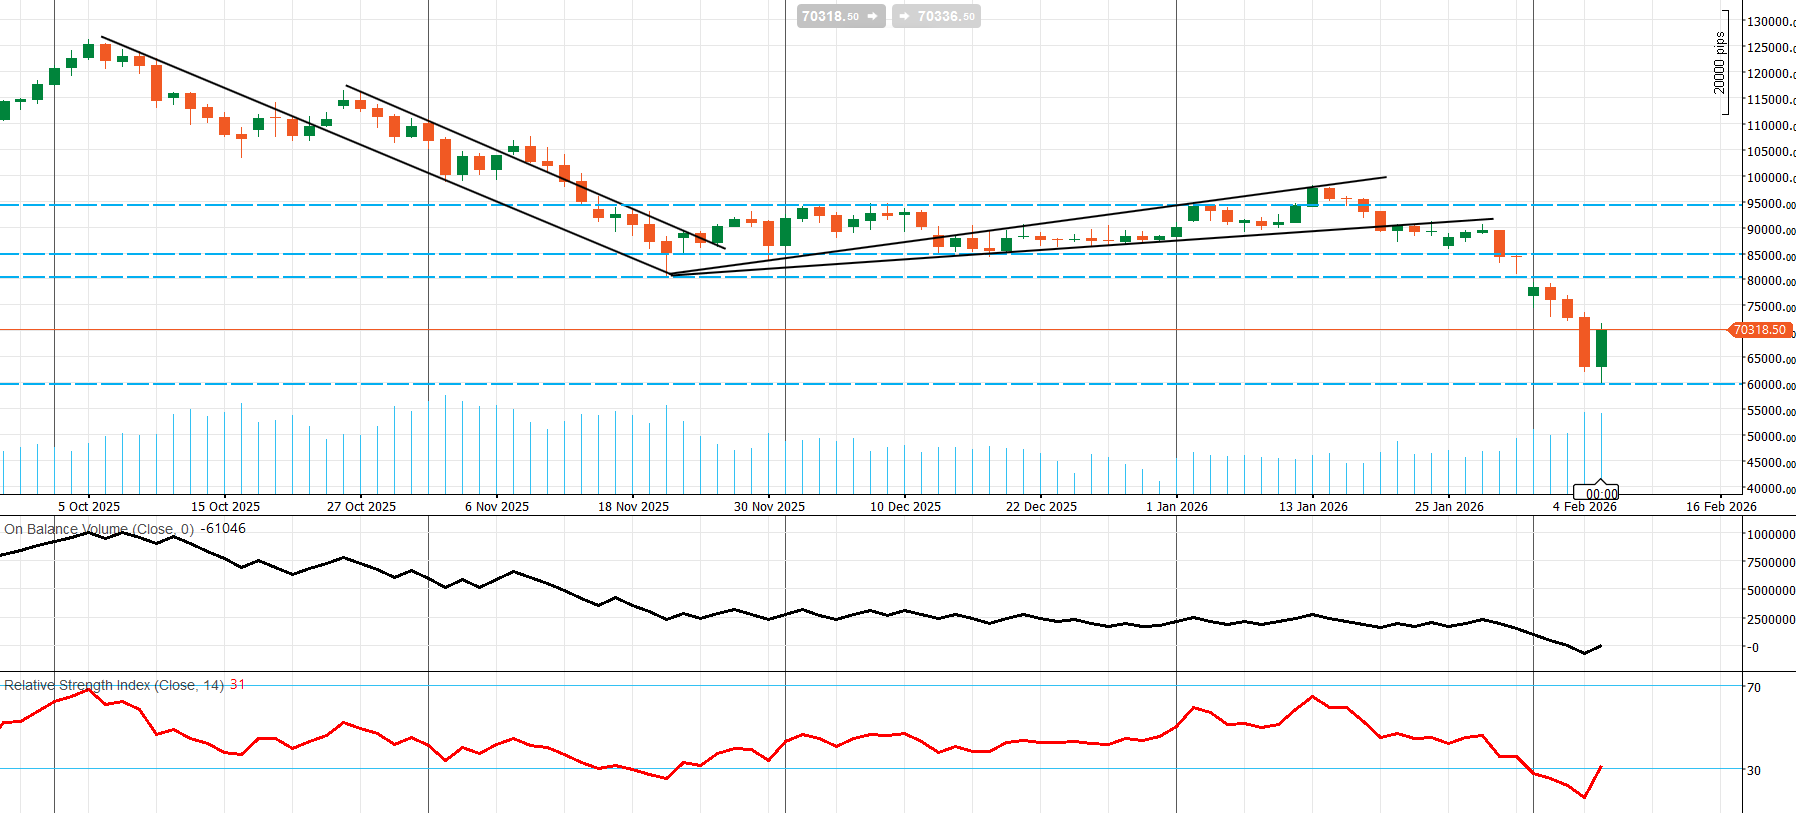
BTC has moved through a clear three-phase sequence: downtrend → base → breakdown. From October to mid-November, it tracked a descending channel, sliding from the ~$125k region into the mid-$80k zone. Late November through mid-January formed a compression/base (ascending wedge/rising channel) that repeatedly failed near ~$95k. That structure broke down in late January/early February, losing the ~$85k/$80k zone and triggering a vertical liquidation leg into the mid-$60k area. The rebound has been sharp, lifting toward ~$70.3k, but it still reads as a reflex bounce unless major broken levels are reclaimed.
Momentum/participation
- RSI ~31: only marginally out of oversold—supports mean reversion, not a healthy trend.
- OBV: still structurally weaker; stabilization is early, not decisive accumulation.
Key levels
- Pivot: ~$70.3k (hold = rebound intact; not trend repair).
- Resistance: ~$75k, ~$80k (major retest), ~$85k (critical repair threshold), ~$90k–$95k (upper supply/cap).
- Support: ~$65k (recent low), ~$60k (major shelf), then mid-$50k if selling re-accelerates.
Practical read: BTC is in post-breakdown stabilization. The bounce is real, but the chart remains structurally bearish until the price at least retakes $80k and ideally $85k on a closing basis. Failure to reclaim those levels keeps the market vulnerable to a $65k retest, and a break there puts $60k back in play quickly.
Comments