 English
 پارسی


Analytical Video
Global Economy
Global Economy Weekly Review
Growth Still Holding, but the Oil Shock Has Made the Macro Outlook More Dangerous
The global economy ended the past week in a more fragile position than it began. The main reason was not a collapse in hard activity data, because in many places growth still held up better than feared. The real problem was that the oil shock linked to the Middle East war had started to distort the global macro mix. It is pushing inflation risks higher again, strengthening the U.S. dollar, pressuring energy-importing economies, and making central banks much less comfortable about easing policy quickly. The world economy is still expanding, but the balance is shifting away from a clean soft-landing story and toward a more difficult combination of slower growth, tighter financial conditions, and renewed inflation risk.
The most important global development was clearly the energy market. Even when Brent and WTI pulled back from their most extreme spikes, the underlying oil picture remained very tight. The physical market moved much more dramatically than futures, with Middle East and sour crude grades surging, jet fuel and diesel prices spiking, and refiners scrambling for substitutes as Hormuz disruption and attacks on regional energy infrastructure raised concerns about supply reliability. That matters far beyond oil itself. Higher energy prices are effectively a global tax on consumers and businesses. They hurt real incomes in importing countries, raise transport and production costs, and make central banks more cautious about cutting rates.
That central-bank caution was visible almost everywhere. The Federal Reserve kept rates unchanged but did so against a backdrop of stronger-than-expected U.S. producer inflation and explicit concern that higher energy prices could push inflation back up. The Bank of England also held rates in a clearly hawkish way, with all nine MPC members voting for no change, and major banks already pushing back their expectations for UK easing. The ECB stayed on hold as well, supported by stable eurozone inflation and cooling wage growth, but with weak confidence data arguing against any aggressive policy shift. Even where central banks are not outright hawkish, they are increasingly trapped by the possibility that the oil shock could delay disinflation.
The United States still looked resilient, but the quality of growth was mixed. Manufacturing data were better than feared, jobless claims remained low, and parts of consumer spending held up. But housing stayed inconsistent, mortgage demand weakened, and leading indicators still pointed to softer momentum ahead. The hot PPI data mattered because it reinforced the idea that inflation may not keep falling smoothly. That means the U.S. remains one of the stronger parts of the global economy, but it is now also a source of tighter financial conditions through a stronger dollar and a Fed that cannot easily turn dovish.
Europe looked softer overall. The eurozone inflation story remained relatively stable, and wage growth cooled, which is helpful. But growth momentum was weak. ZEW confidence collapsed, construction slipped back into contraction, and the eurozone trade balance unexpectedly swung into deficit. Germany’s producer prices remained deep in deflation, which helps with inflation but does not signal healthy demand. The UK looked somewhat more resilient on employment, but wage growth cooled, industrial demand stayed weak, and fiscal borrowing was worse than expected. In short, Europe is not in crisis, but it looks increasingly like a region with weak confidence and limited growth momentum, now facing a fresh imported energy shock.
China and Japan told two different stories, but both still showed uneven recoveries. China’s hard activity data were better than expected, with stronger industrial production, firmer retail sales, and improved investment numbers. But the recovery remained unbalanced because housing was still weak and unemployment edged higher. That is why Beijing kept the LPR unchanged again. Japan, meanwhile, had a strong week for industrial production and a much better headline trade balance, but services activity dropped sharply, and the yen remained near major lows. The BOJ stayed cautious, even while acknowledging higher oil prices as a risk. So both major Asian economies are still growing, but neither looks fully self-sustaining, and both remain vulnerable to the energy shock in different ways.
The biggest pressure point in the global system may now be the emerging-market complex, especially oil importers. India stood out as one of the clearest examples of vulnerability: the rupee fell to record lows, reserves dropped, infrastructure output slowed, and wholesale inflation picked up. Turkey also showed reserve weakness. By contrast, parts of Latin America looked more resilient. Mexico’s domestic demand remained strong, Brazil continued a controlled easing cycle, and South Africa saw softer annual inflation alongside better retail sales. But the overall emerging-market story is one of widening divergence. Economies with stronger domestic demand or softer inflation are coping. Economies exposed to higher energy costs, weaker currencies, and tighter external financing conditions are under growing strain.
Financial markets reflected this global tension. The U.S. dollar increasingly acted as the dominant safe haven, while other traditional refuges such as the yen and Swiss franc lost some relative support. Gold, interestingly, did not behave like a perfect hedge either, as profit-taking, higher bond yields, and dollar strength triggered a sharp pullback from recent highs. Equity markets were mixed: tech optimism lifted parts of Asia and supported semiconductor-linked markets, but broader regional equity performance remained highly sensitive to oil and central-bank expectations. The message from markets is that investors are no longer pricing a simple growth recovery. They are pricing a world in which geopolitics can re-tighten the macro cycle at any time.
The most accurate summary of the global economy right now is that it is still expanding, but under more stress than the headline data alone suggest. Growth has not collapsed. In fact, several major economies still showed pockets of resilience. But the new oil shock has changed the policy and inflation backdrop in a way that makes the global expansion less comfortable and more uneven. The world economy is now more exposed to a stagflation-lite risk: not a full 1970s-style outcome, but a period where growth slows, inflation stays sticky, and central banks remain more restrictive than markets had hoped.
Bottom line: the past week showed that the global economy is still moving forward, but with a much narrower margin for error. The key risk is no longer just weak growth or just inflation. It is the combination of higher energy prices, delayed rate cuts, stronger dollar conditions, and uneven domestic demand across major economies. That does not mean a global recession is already here. But it does mean the global macro environment has become meaningfully more difficult and less forgiving than it looked before the latest Middle East escalation.
Week 13 Global Economic Outlook:
- War, Oil, and Data Set the Tone for Global Markets
Global markets are entering Week 13 under intense pressure from geopolitics, energy disruption, and a heavy calendar of macroeconomic releases. The war in the Persian Gulf remains the dominant driver of sentiment, with regional energy exports still largely disrupted as the conflict moves deeper into its fourth week. That shock is likely to keep investors focused on crude oil, inflation expectations, safe-haven flows, and broader cross-asset volatility.
In this environment, market participants are not only watching war headlines but also assessing whether the latest economic data show signs of resilience or renewed fragility. From business activity surveys to inflation prints and central bank decisions, the coming week could play a major role in shaping short-term expectations for growth, rates, and risk appetite.
- The War in the Persian Gulf Remains the Main Market Driver
The geopolitical backdrop continues to overshadow much of the global macro narrative. With energy exports from the Persian Gulf region still heavily disrupted, oil prices are likely to remain highly sensitive to military developments, shipping conditions, and any sign of escalation or containment.
This matters far beyond the energy market. Higher oil prices can feed directly into inflation expectations, complicate central bank policy, pressure consumer confidence, and weigh on growth-sensitive assets. Currency markets, bond yields, and equity indices are all likely to stay reactive to geopolitical headlines, especially if supply risks intensify further.
As a result, the week ahead is likely to be defined by a combination of macro data and geopolitical repricing rather than by economic fundamentals alone.
- United States: PMI, Consumer Sentiment, and Regional Fed Signals in Focus
In the United States, investors will closely monitor a set of forward-looking indicators that could help clarify how the economy is performing under a more difficult external backdrop.
The S&P Global PMI will be one of the key releases, offering an early read on both manufacturing and services activity. Markets will also pay close attention to the University of Michigan consumer sentiment index, which may reveal whether households are becoming more cautious as energy prices rise and uncertainty remains elevated.
In addition, several regional Federal Reserve business surveys are due, providing fresh evidence on factory activity, pricing pressure, and corporate sentiment. Together, these reports should help shape expectations about whether U.S. growth is still holding up or beginning to soften more materially under the weight of geopolitical stress and tighter financial conditions.
- Flash PMIs to Offer an Early Read on Global Growth Momentum
Beyond the United States, flash PMI releases will be a major global focus. Markets will be watching the Euro Area, key member economies, the United Kingdom, Japan, Australia, and India for signs of whether business activity is staying resilient or beginning to weaken.
These surveys are especially important in the current environment because they provide some of the earliest signals on growth momentum. If PMIs show a broad-based deterioration, markets may start to price in a more meaningful slowdown in global activity. On the other hand, if they remain relatively stable, investors may conclude that the world economy is still absorbing the geopolitical shock better than feared.
Either way, the PMI cycle is likely to be one of the most important macro checkpoints of the week.
- Europe: Confidence Data to Test the Depth of the Sentiment Shock
In Europe, confidence indicators from Germany and the Euro Area will offer another important lens on the economic impact of the war. These releases may help determine whether the region’s already fragile growth environment is deteriorating further as energy insecurity and external risks rise.
Germany will be particularly important given its industrial base and sensitivity to energy costs. A weaker reading there would reinforce concerns that Europe may struggle to maintain momentum if oil remains elevated and business confidence continues to fade.
For the broader Euro Area, investors will be looking for signs of whether firms and households are becoming more defensive, especially as geopolitical risks continue to dominate headlines.
- Inflation Watch: Japan, the UK, Australia, and Spain in Focus
On the inflation front, the coming week will be especially important. Fresh consumer price data are due from Japan, the United Kingdom, and Australia, while Spain will be the first major economy to publish a March inflation reading.
These reports will matter because they arrive at a time when markets are trying to assess whether geopolitical pressure through energy channels is beginning to reaccelerate headline inflation. A stronger-than-expected set of readings could reinforce concerns that central banks may have less room to ease policy, even if growth becomes more uncertain.
Spain’s inflation print will be watched particularly closely as an early signal for the broader European inflation trend. Meanwhile, the UK and Australia data may influence local rate pricing and shape expectations around the path of monetary policy in both economies.
- Central Banks: Norway and Mexico Add to an Event-Heavy Week
Monetary policy will also remain in focus, with central bank decisions from Norway and Mexico adding another layer of significance to the week.
These meetings come at a time when policymakers face a difficult balance between growth concerns and inflation risk. If energy-driven price pressure persists while business activity slows, central banks may be forced into a more cautious and data-dependent stance.
For markets, the decisions themselves will matter, but the guidance around inflation, growth, and external risks may matter even more. Traders will be looking for any indication of how policymakers are interpreting the current mix of war-related uncertainty, commodity volatility, and domestic economic conditions.
- In short, this is likely to be a week where geopolitics and macroeconomics collide directly. For investors, traders, and policymakers alike, the combination of war, oil, and economic data will define the tone of global markets.
USA
ssdds
US Economy Weekly Review: Sticky Inflation Is Making the Soft Landing Harder
The US economy remained on an expansion path over the past week, but the overall macro picture became more complicated. Growth has not stalled, the labor market is still reasonably resilient, and parts of the manufacturing sector continue to show solid stability. However, inflation is not cooling smoothly, and that is making the soft-landing narrative more fragile.
With oil prices and geopolitical risks back in focus, the economy now looks less like a clean disinflation story and more like a late-cycle environment defined by slower growth, sticky inflation, and tighter policy limits.
Inflation remains the main problem
The clearest message from this week’s data was that inflation is still too firm. February producer price inflation (PPI) came in stronger than expected. Headline PPI rose 0.7% month over month and 3.4% year over year, while core PPI increased 0.5% on the month and 3.9% on the year. Even narrower inflation measures that exclude food, energy, and transport remained elevated.
This is important because producer prices often act as an early warning signal for future consumer inflation. In other words, businesses are still dealing with meaningful cost pressure, and that reduces confidence that inflation will continue to ease in a smooth and uninterrupted way.
The Fed is holding, but not comfortably
That inflation backdrop directly shaped the Federal Reserve’s latest message. The Fed kept interest rates unchanged at 3.75%, which was widely expected, but the tone was not clearly dovish. Although the updated rate path looked somewhat softer in the short term, policymakers made it clear that higher energy prices and the shock tied to the Iran war could make the inflation outlook more difficult.
The result was a policy pause with caution, not a pause with confidence. Markets were left with the view that the Fed still wants to keep its flexibility, but it has much less room to cut rates quickly if oil prices and inflation expectations continue to rise.
Growth is still positive, but less convincing
On the growth side, the US economy still showed several signs of resilience. Industrial production rose 0.2% month over month, manufacturing output also increased 0.2%, and capacity utilization held at 76.3%. The Philadelphia Fed manufacturing index also surprised to the upside, rising to 18.1, well above expectations. Employment in that survey returned to positive territory, while the capital spending component improved noticeably.
These numbers suggest that manufacturing is not rolling over, and at least some businesses are still willing to invest despite the uncertain environment.
Still, the broader growth picture was not uniformly strong. The New York Empire State index fell back into negative territory at -0.20, showing that factory momentum remains uneven across regions. The Conference Board Leading Index stayed negative at -0.1%, and the Atlanta Fed’s GDPNow forecast for first-quarter growth was revised down to 2.3% from 2.7%.
Together, these figures suggest that the US economy is still growing, but the pace looks less synchronized and somewhat softer than it did only a few weeks ago.
The labor market is healthy, but cooling gradually
The labor market remains broadly solid, but signs of moderation are becoming more visible. Initial jobless claims fell to 205,000, a low level that suggests layoffs remain contained. The four-week average also edged lower, reinforcing the idea that the labor market has not broken down.
However, continuing claims rose to 1.857 million, indicating that workers who lose jobs may now be taking longer to find new ones. At the same time, ADP weekly employment growth slowed to 9,000 from 15,500. This does not point to labor market deterioration, but it does fit the broader trend of gradual cooling rather than renewed strength.
Consumers are still spending, but housing remains weak
Consumer activity sent a similarly mixed signal. Redbook retail sales growth improved to 6.4% year over year, showing that household spending is still providing important support to the economy. That matters because consumer demand remains one of the main pillars of US growth.
But housing and financing activity stayed soft. MBA mortgage applications fell 10.9%, mortgage rates rose to 6.30%, and refinancing activity dropped sharply. Housing data reflected the same inconsistency. Pending home sales rose 1.8% month over month, homebuilder sentiment improved slightly to 38, and building permits came in a bit better than expected. But new home sales dropped sharply to 587,000, marking a steep 17.6% monthly decline.
The housing market is not collapsing, but it remains fragile, uneven, and highly sensitive to borrowing costs.
Energy and financial conditions are adding pressure
Energy and financial conditions added another layer of complexity to the outlook. The latest EIA report showed a 6.156 million-barrel increase in crude inventories, but that was offset by significant draws in gasoline and distillates. This suggests refined fuel balances are tightening even if crude availability improved.
In a normal week, that crude build might have eased concerns. But in the current environment, markets are far more focused on geopolitical supply risks and the inflationary impact of higher oil prices. Meanwhile, Treasury bill yields stayed relatively firm, real financing costs remained restrictive, and foreign demand for long-term US assets slowed sharply in the latest TIC data.
None of these signals immediate instability, but it does show that the US economy is moving into the next phase of the cycle without a comfortable macro cushion.
In short
The best way to describe the US economy right now is resilient, but increasingly uncomfortable. The soft-landing story is still alive because growth remains positive, layoffs are low, and parts of the industry continue to hold up. But it is becoming a messier soft landing.
Inflation is sticky, the Fed cannot pivot easily, housing remains soft, and Oil and geopolitical risks are making the outlook more uncertain. The US is not in recession, but the balance of risks has clearly become more difficult. The main near-term threat is that higher oil prices keep inflation elevated long enough to force the Fed to stay on hold longer than markets want, even as growth indicators continue to cool.
United States: Week Ahead Outlook
The U.S. economy enters the new week in a slower-but-still-expanding phase. Growth cooled sharply in Q4, with real GDP rising at a 1.4% annualized pace after 4.4% in Q3, showing that momentum had already faded into year-end even before the latest geopolitical energy shock. That softer backdrop now meets a much more complicated external environment, with markets increasingly shaped by war, oil, inflation risk, and the Federal Reserve’s cautious stance.
The US–Israel–Iran conflict is set to remain the main driver of market sentiment, both in the United States and globally, keeping energy prices and inflation concerns firmly in focus. In the U.S., the economic calendar is relatively light, but several releases still matter. The key reports include the flash S&P Global PMI for March, which will offer an early snapshot of business activity, and February foreign trade prices, with import prices expected to rise 0.2%, matching January’s increase. Other data to watch include the fourth-quarter current account balance, construction spending, the Chicago Fed National Activity Index, the Richmond Fed and Kansas Fed manufacturing indexes, as well as final readings on Q4 productivity and labour costs. The final University of Michigan consumer sentiment index for March will also be closely followed, especially after the preliminary reading pointed to early signs of strain linked to the Middle East crisis.
For the week ahead, the macro story is less about one blockbuster release and more about whether the incoming data confirms three themes:
• Growth is moderating but not collapsing,
• Inflation risks are being re-energized by imported cost pressure and oil, and
• The Fed is staying cautious after its March meeting.
The most important economic data and market expectations
1) Flash U.S. PMI — Tuesday, March 24
The first major market-moving release is the S&P Global flash PMI, scheduled for March 24. The February PMI backdrop showed U.S. activity still in expansion territory but losing momentum, with the composite index at 51.9, while manufacturing and services softened to 51.6 and 51.7, respectively. For March, expectations are that both indexes will remain steady above the 50 expansion threshold, suggesting continued growth, but not a strong reacceleration.
2) Productivity and Costs (Q4 revised) — Tuesday, March 24
The BLS calendar shows the revised Q4 productivity release on March 24. This matters because the Fed is still trying to assess whether wage growth can cool without creating new inflation persistence. Stronger productivity would help offset labour cost pressure, while weaker productivity would make the inflation mix less comfortable. Expectations are for both Unit Labor Costs and Nonfarm Productivity to remain unchanged at 2.8% (QoQ) in Q4, reinforcing the view that the overall labor market remains resilient despite some recent weaker signals.
3) Import and Export Prices for February — Wednesday, March 25
This is one of the most important inflation-related releases of the week. The BLS has the report scheduled for March 25, and market consensus is for both import and export prices to rise 0.1% month-on-month. Under normal conditions, that would be a modest print. This week, however, it matters more because markets want to know whether external price pressure is beginning to broaden. A firmer-than-expected import price reading would support the view that headline disinflation may stall.
The most important events to watch
Fed speakers on March 24–26 are the main policy events of the week. The Federal Reserve calendar shows Michael Barr speaking on March 24 and again on March 26, with Philip Jefferson and Lisa Cook also speaking on March 26. Jefferson’s topic explicitly includes “Economic Outlook and Energy Effects,” making that appearance especially important in the current environment.
Markets will listen for three things:
• whether officials treat the oil shock as mostly temporary,
• whether they show greater concern about second-round inflation effects, and
• whether they sound more worried about growth than about prices.
The Fed’s own calendar also shows the Senior Credit Officer Opinion Survey on Dealer Financing Terms (SCOOS) due on March 26. That matters because tighter financing conditions would reinforce the idea that financial conditions are already doing part of the Fed’s work.
Traders’ Note
For the U.S., the week ahead is mainly about whether incoming data keep the “Fed on hold, growth slowing, inflation sticky” narrative intact. That remains the core macro framework for markets. If both the PMI data and import prices come in stronger than expected, Treasury yields and the U.S. dollar could extend their recent strength. That would reinforce the idea that inflation pressure is not fading quickly enough for the Federal Reserve to shift toward a more dovish stance.
On the other hand, if business surveys soften while price data remain contained, markets may return to a more dovish medium-term interpretation. In that case, rate expectations could ease slightly, especially if investors conclude that growth is losing momentum without a renewed inflation shock. For traders, the most important practical watchpoints this week are PMI pricing components, import price data, and the Fed’s tone on energy pass-through into inflation.
USD Index (DXY) – Daily Technical View
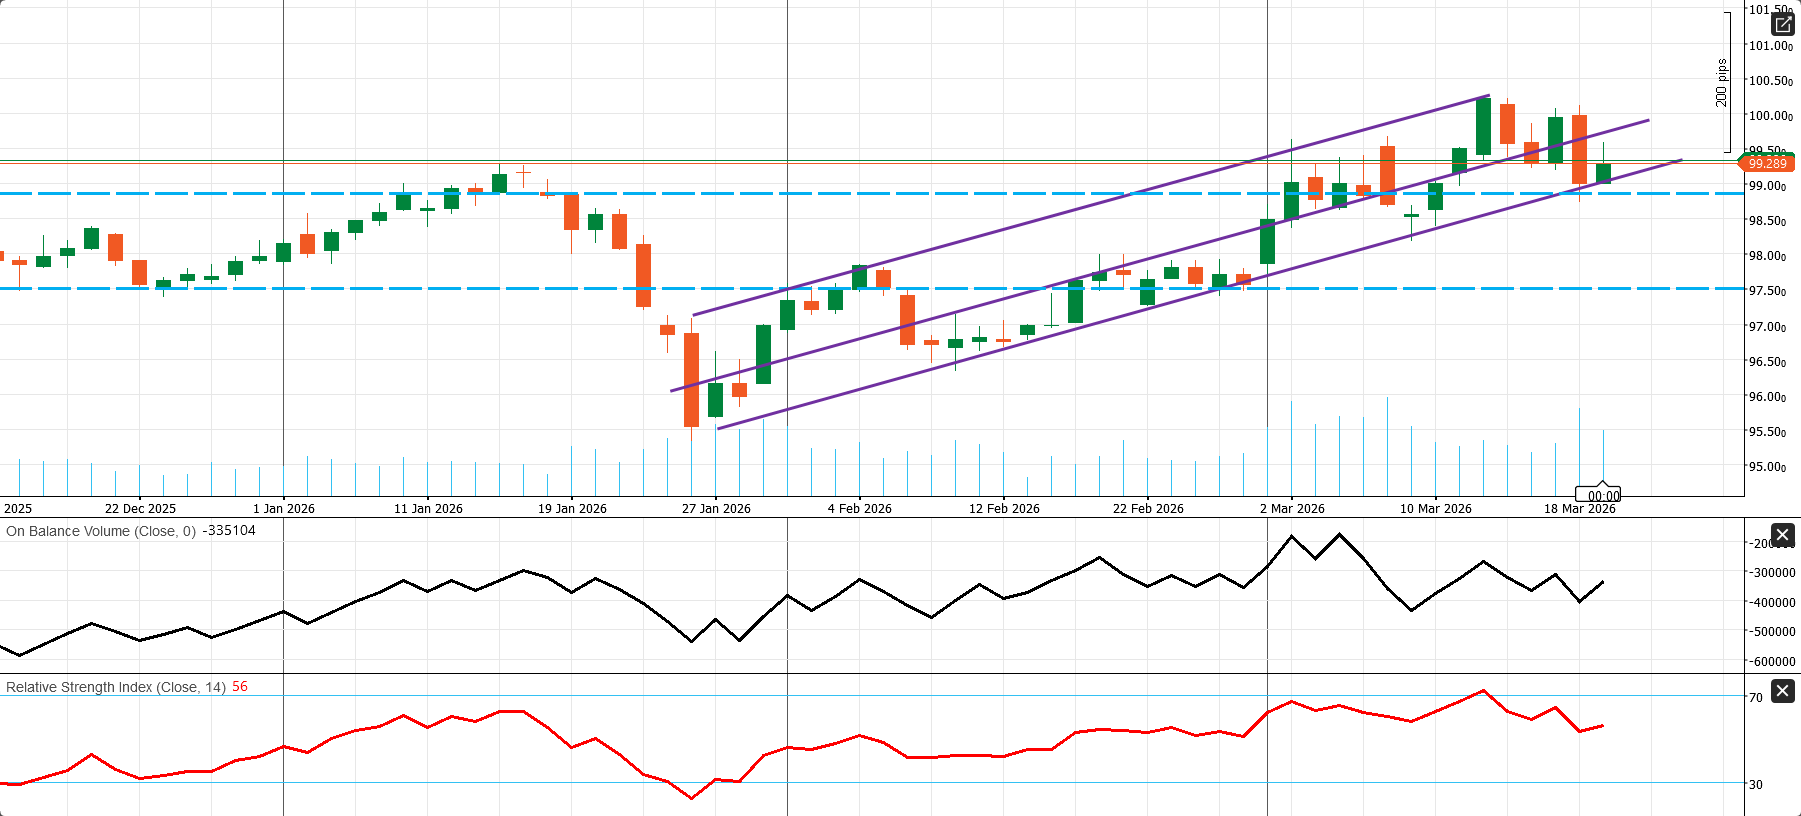
The daily structure for the USD Index (DXY) remains mildly bullish, with price still moving inside the purple rising channel. However, momentum has clearly cooled after the recent push toward the upper boundary of the ascending channel near the 100.20–100.40 region. The index has now pulled back toward the 99.20–99.30 zone, which sits close to an important horizontal level and near the middle-to-lower section of the rising channel.
As long as DXY holds above the 99.00 area, the broader short-term uptrend remains intact, leaving room for another move toward 100.00–100.30. A daily break below 99.00 would weaken the current setup and could open the way for a deeper correction toward 98.50 and possibly 97.50.
- RSI: Around 56, showing that momentum remains positive but is no longer overbought.
- OBV: Not especially strong, suggesting the latest rebound has lost some conviction.
Key levels to watch:
• Immediate support: 99.00, then 98.50, with stronger support near 97.50.
• Immediate resistance: 99.50–99.60, then 100.00, and above that, the recent high near 100.30+.
S&P 500 – Daily Technical View
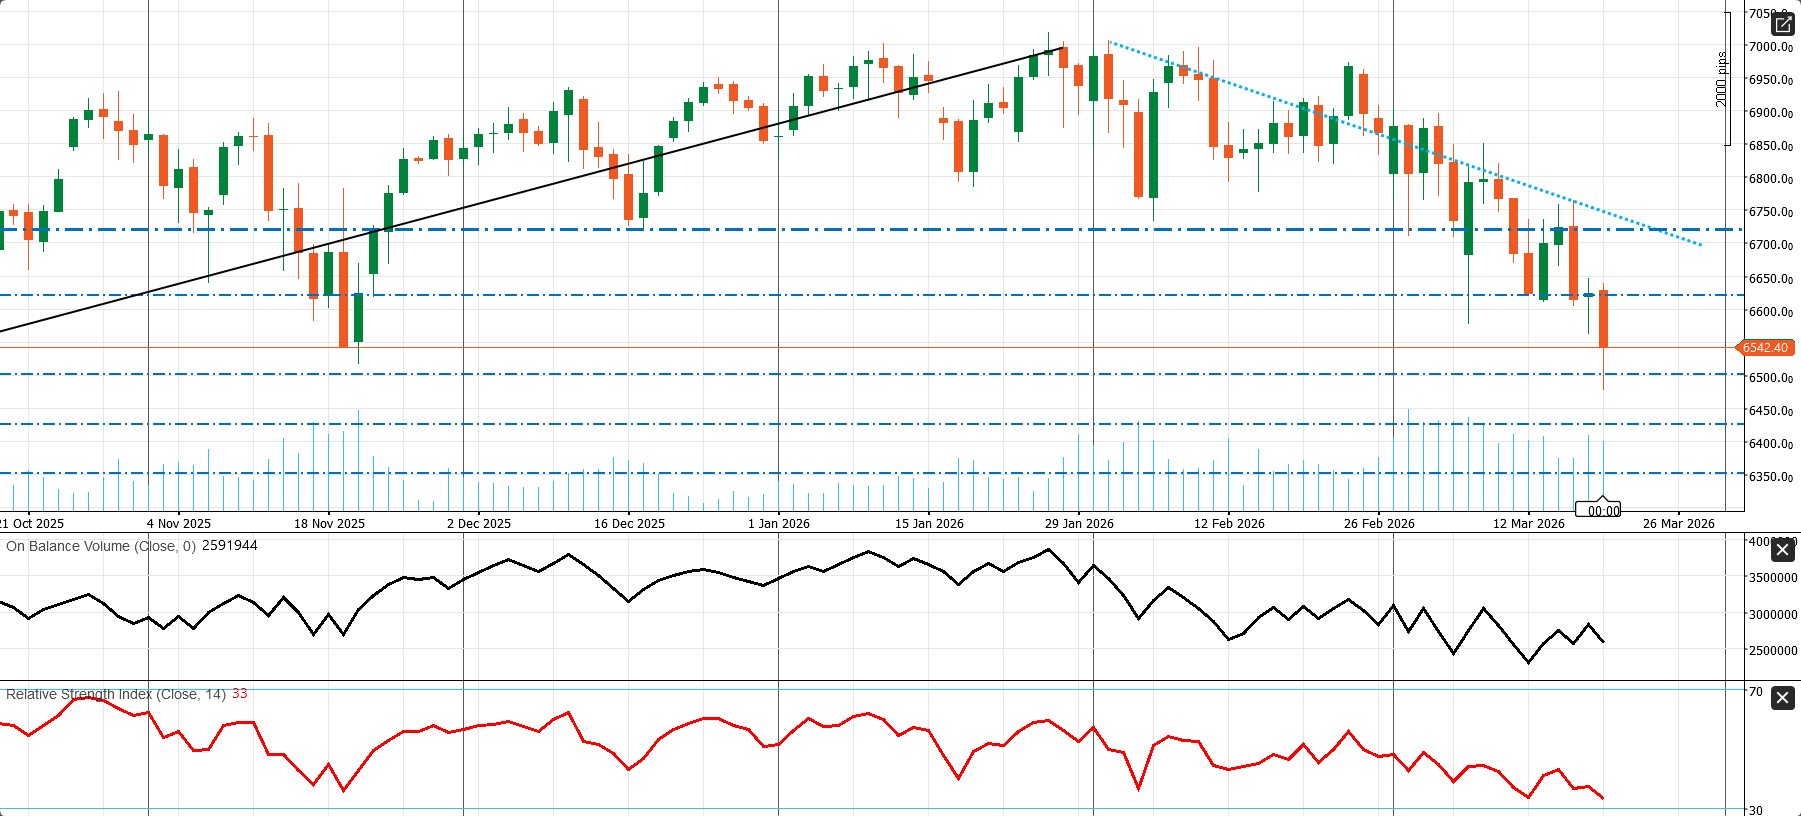
The short-term trend in the S&P 500 remains bearish after the index lost its previous uptrend structure. Since the late-January peak, price has continued to print lower highs and lower lows, while rebound attempts have remained capped below the descending trendline from February. This still looks like a sell-the-rally market, not a confirmed recovery.
The latest move matters because the index has now broken below the 6600 area and is trading close to the 6500–6540 support zone. That leaves the market in a weak technical position for the next few sessions.
As long as the price remains below 6600–6710, downside pressure stays dominant. A clean break under 6500 would expose 6420 next. To improve the setup, bulls need to reclaim 6600 first and then break the descending trendline with stronger volume.
- RSI: Around 33, showing strong downside momentum and a market approaching oversold territory, though not yet signaling a clear reversal.
- OBV: Still trending lower, suggesting distribution remains in place and buying conviction is weak.
Key levels to watch:
• Immediate support: 6500, then 6420, and below that around 6345.
• Immediate resistance: 6600, then 6700–6710, with stronger resistance near the falling trendline above.
UK
UK Economy Weekly Review:
Resilient Labour Market, Cooling Wages, and a BoE Still in No Hurry to Cut
The UK economy ended the past week with a mixed but still relatively stable macro backdrop. The labour market held up better than expected, the housing market posted a modest monthly increase, and industrial orders improved slightly. At the same time, domestic momentum remained soft, wage pressure continued to ease, and the Bank of England showed little sign that it is ready to begin cutting rates soon. Weaker public-finance data and higher gilt yields added to that cautious picture. The overall message is clear: the UK economy is not rolling over, but it is also not strong enough to justify optimism about a rapid policy easing cycle.
The most important signal of the week came from the Bank of England. The BoE left interest rates unchanged at 3.75%, which was widely expected. The bigger surprise was the vote split, with all 9 MPC members backing no change and zero votes for a cut. Markets had expected at least some support for easing, but the committee remained fully united behind holding policy steady. That makes this more than a simple pause. It was a hawkish hold, and it strongly suggests policymakers still view inflation risk as serious enough to justify patience.
That interpretation is consistent with the latest wage data. The UK labour market still looks resilient, but earnings growth is moving in a more comfortable direction from the BoE’s perspective. Average earnings, including bonuses, slowed to 3.9% from 4.2%, while average earnings excluding bonuses eased to 3.8% from 4.1%. This matters because sticky wage growth has been one of the main reasons the BoE has remained cautious for so long. Slower pay growth helps reduce inflation pressure, especially in the services sector. Even so, wage cooling has not yet gone far enough to convince the central bank that rate cuts should begin immediately.
The labour market itself did not look weak. The unemployment rate held at 5.2%, slightly better than the 5.3% expected, while employment change rose by 84K, well above both forecasts and the previous reading. On the surface, that is a solid labour-market result. However, the details were less clean. The claimant count rose by 24.7K, much higher than before, suggesting ongoing pressure beneath the surface in hiring conditions. The labour market is therefore best described as gradually cooling rather than re-accelerating.
The housing market also delivered a mixed signal. The latest Rightmove house price index rose 0.8% month-on-month, indicating some short-term support in asking prices, likely helped by seasonal demand. But the annual reading remained at -0.2%, showing that the broader market is still soft and struggling to generate sustained year-on-year price growth. Housing is not collapsing, but it is not meaningfully recovering either, and high borrowing costs continue to weigh on the sector.
Industry remained weak, although there was a slight improvement. The CBI Industrial Trends Orders reading improved to -27 from -28, beating the -30 expectation. That is a better number, but it is still deeply negative. Demand has not recovered; the degree of weakness has simply become a little less severe.
The fiscal picture was one of the weaker parts of the week. Public sector net borrowing came in at £14.30 billion, far above the £8.70 billion expected, while the public sector net cash requirement also returned to positive territory. At the same time, the latest 5-year gilt auction cleared at 4.228%, sharply above the previous 3.810%. That combination of higher borrowing and higher funding costs is not a crisis, but it does reinforce the view that UK financial conditions remain tight.
Bottom line: the UK economy looks more resilient than fragile, but still too soft for comfort and too inflation-prone for easy rate cuts. The BoE’s unanimous hold was the clearest signal of the week: policy is likely to remain restrictive for longer than markets had hoped.
United Kingdom: Week Ahead Outlook
The United Kingdom enters the new week with a more complicated macro backdrop than the United States. Economic activity has improved modestly in recent months, but the inflation outlook has become more fragile again following the latest Middle East shock. The Bank of England kept the Bank Rate at 3.75% on March 19, and unlike the split seen in February, the March meeting ended with all policymakers backing no change while they assess the scale and duration of the conflict and its effect on energy prices, inflation, and domestic demand.
That unanimous decision should not be interpreted as dovish. The meeting minutes made clear that the Monetary Policy Committee (MPC) believes a more prolonged external shock could require a more restrictive policy stance, especially if higher energy prices begin feeding into wage growth and corporate price-setting behaviour. At the same time, the Bank also acknowledged that weaker demand and squeezed real incomes could widen spare capacity and push unemployment higher. In practical terms, this means the UK now faces a more visible stagflation-style trade-off than it did only a few weeks ago.
The broader growth backdrop remains soft. According to ONS data, UK GDP rose only 0.1% in the three months to December 2025, confirming that the economy was already fragile before the latest energy shock hit markets. The Bank of England’s February Monetary Policy Report projected that CPI would return to around the target in Q2 2026, but that path now looks less secure after the March repricing in global energy markets. The central issue for investors is no longer just whether inflation is falling, but whether geopolitical developments will delay that progress and keep policy restrictive for longer.
The most important economic data and market expectations
The bias for the week ahead is caution rather than optimism. The latest CBI distributive trades survey showed that retailers experienced a sharp drop in February sales volumes, with part of the weakness blamed on wet weather, although expectations for March improved somewhat. That leaves the official February retail sales report carrying meaningful downside risk versus the strong January starting point.
1) Flash UK PMI — Tuesday, March 24
This is the most important UK release of the week. According to the S&P Global March 2026 PMI bulletin calendar, the Flash UK PMI is due on March 24. The February backdrop was relatively constructive. The UK composite PMI rose to 53.7, its highest level since August 2024, pointing to modest expansion led by the services sector at 53.9, while manufacturing remained only slightly above the 50 expansion threshold at 51.7. The market now wants to know whether March PMI readings can hold up despite the energy shock and rising uncertainty. With tensions still elevated, expectations for a clear positive improvement in service and non-service activity remain limited.
2) Consumer and Producer Inflation — Wednesday, March 25
The final February CPI and PPI readings will be released on Wednesday, March 25. In January, inflation eased by -0.5%, bringing the annual rate down to 3.0%. Under calmer conditions, that would support a more positive view on disinflation progress. However, with geopolitical tensions ongoing and affecting multiple price channels, especially in the energy sector, market participants may treat these figures as somewhat delayed and less relevant to the current market environment.
3) Retail Sales for February — Friday, March 27
The ONS shows that the February retail sales release is due on March 27. This report is critical because January surprised strongly to the upside, with retail sales volumes rising 1.8% month-on-month, helped by spending on artwork, antiques, and online jewellery. The key question now is whether that jump was only a temporary rebound or the beginning of firmer consumer demand. Given the latest survey evidence, markets will be especially sensitive to any sign that consumer momentum is fading again.
Traders' Note
For investors and traders, this week is mainly about whether the UK economy still looks like a story of slow expansion or whether it is shifting toward soft growth under inflation pressure. It is also about how markets will continue to digest last week’s Bank of England decision. That distinction is likely to drive gilt yields, sterling, and expectations for the future path of BoE policy.
On the data front, if PMI readings remain in expansion territory, retail sales avoid a sharp pullback, and price components do not show a renewed inflation surge, the tone for the UK economy and markets can remain constructive. If not, markets may move back toward a more defensive interpretation.
GBP/USD – Daily Technical View
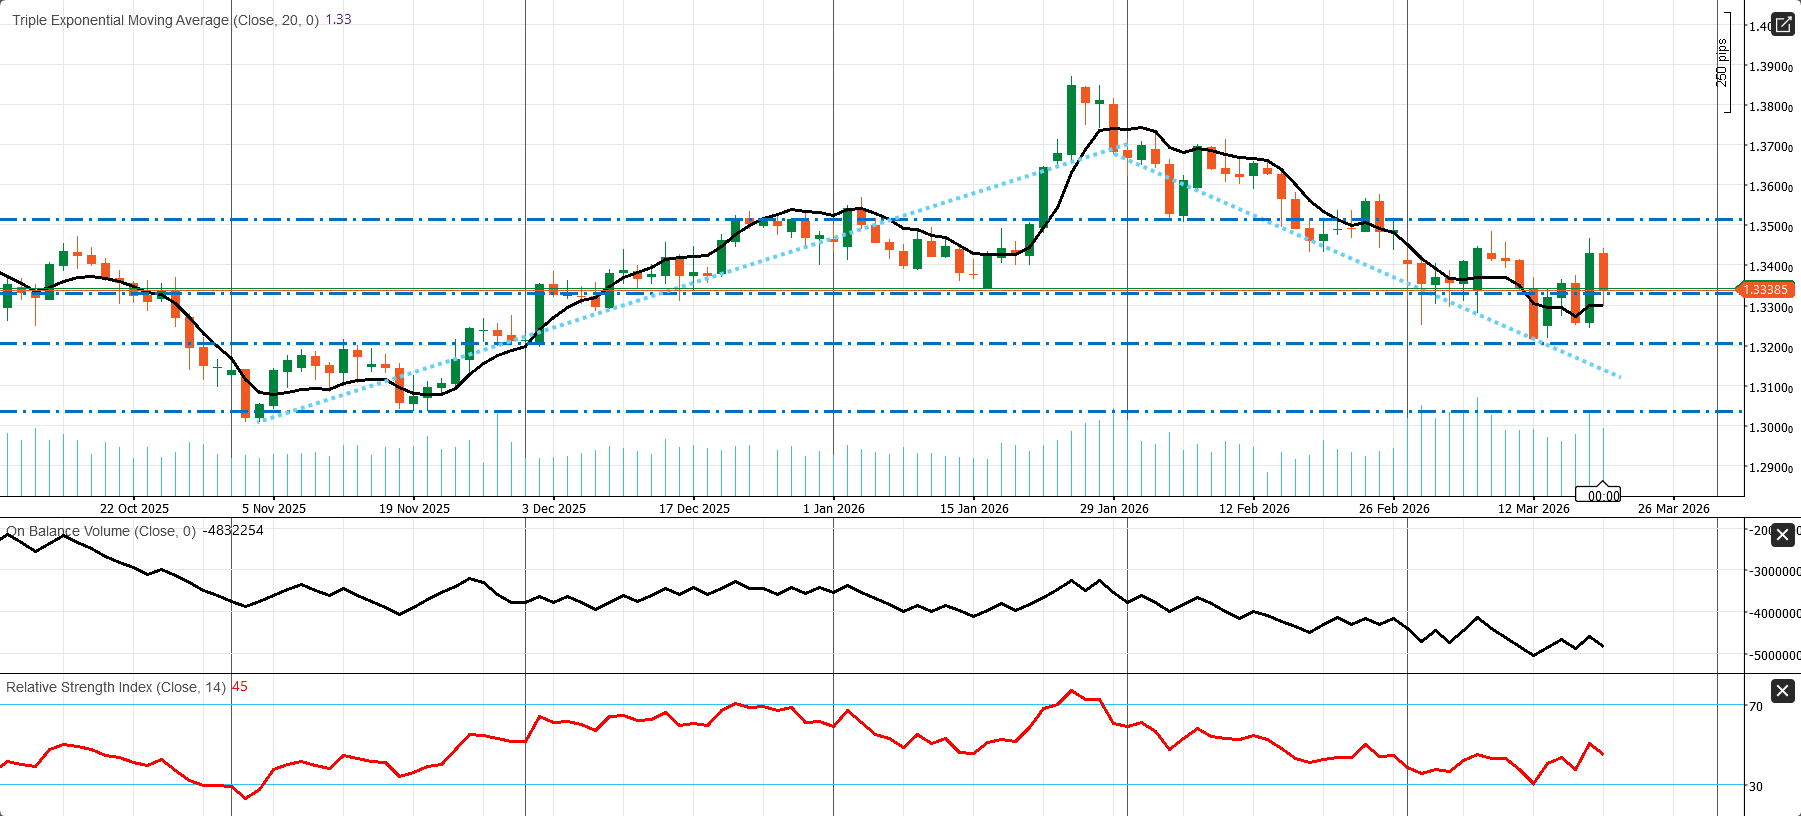
The daily bias in GBP/USD is neutral to slightly bearish, although the structure still looks more like a corrective consolidation than the start of a fresh bullish breakout. After peaking near the 1.38 area in late January, the pair moved into a corrective phase marked by lower highs and repeated rejection below the falling trendline.
At present, the price is trading around 1.3340, placing the pair near an important pivot zone. A modest rebound has developed, but there is still no clear bullish reversal signal.
- EMA (20): Price is hovering around the moving average, reflecting weak short-term trend conviction.
- RSI: Around 45, suggesting momentum is soft but not oversold.
- OBV: Still weak overall, indicating that buying pressure has not convincingly returned.
Key technical levels to watch:
Immediate resistance: 1.3350, then 1.3500. A stronger break above 1.3500 would improve the structure.
Immediate support: 1.3200, then 1.3050. Below that, downside pressure would deepen.
If GBP/USD remains below 1.3350–1.3500, rallies may stay limited. A clean move above 1.3500 would be needed to shift the tone back to bullish, while a break below 1.3200 would expose 1.3050 next.
Gold Weekly Outlook:
War Premium, Higher-for-Longer Rates, and a Fragile Short-Term Setup
Gold enters the new week under pressure, with the market caught between geopolitical risk and a macro environment that remains unfriendly for bullion. Despite the ongoing war in the Persian Gulf, gold just posted its sharpest weekly decline since 2020, with reports indicating a drop of roughly 8% to 10% over the week. April Comex gold settled near $4,574.90, while spot gold ended late Friday slightly below the $4,500 area. The core message from last week was clear: in the current market regime, a stronger U.S. dollar, firmer Treasury yields, and fading expectations for Federal Reserve rate cuts have outweighed gold’s usual safe-haven appeal.
The broader macro backdrop remains challenging. On March 18, the Federal Reserve kept the federal funds target range unchanged at 3.50% to 3.75% and emphasized that uncertainty around the outlook remains elevated, specifically noting that developments in the Middle East carry unclear implications. That policy stance leaves gold highly sensitive to any factor that pushes U.S. real yields and the dollar higher. If markets continue to interpret the oil shock primarily as an inflation problem rather than a growth or recession problem, gold may struggle to regain momentum in the near term.
Why Gold Has Fallen Despite Geopolitical Stress
Gold’s recent sharp decline should not be interpreted as a contradiction of geopolitical risk. Instead, it suggests that gold is currently trading more like a reserve-flow asset than a classic fear hedge. Under normal conditions, war, oil disruption, and volatility would be supportive for precious metals. This time, however, gold and silver have both weakened because the main structural buyers, especially central banks and sovereign reserve managers, are no longer offering the same level of support.
The recent gold bull market was built on two major forces. The first was the long period of monetary debasement after 2008, which boosted demand for hard assets. The second was the acceleration of de-dollarisation after Russia’s reserves were frozen in 2022, along with concerns about potential White House intervention and dominance over the Federal Reserve ahead of Kevin Warsh’s nomination. These dynamics encouraged countries such as China, Turkey, and several Persian Gulf states to shift part of their reserves away from U.S. Treasuries and into gold. In that environment, gold evolved from being only a safe-haven asset into a more strategic reserve asset.
Reserve Flows, Oil Disruption, and Pressure on Precious Metals
The current war in the Persian Gulf and the disruption around Hormuz have reversed part of those reserve-supportive flows. Oil-exporting countries such as Saudi Arabia, the UAE, and Kuwait depend on energy revenues to generate the surpluses that support reserve accumulation. When those flows are disrupted, they may buy less gold or even need to liquidate assets. China faces a related challenge through weaker growth and smaller external surpluses, which also reduce the pace of reserve accumulation and, by extension, demand for gold.
Silver has fallen even more sharply than gold, and the reason is important. Silver is not only a monetary metal; it is also deeply linked to industrial demand. As growth expectations weaken, demand from sectors such as electronics, solar, electric vehicles, and semiconductors also softens. That means silver is being hit from both sides: weaker reserve demand and weaker industrial consumption.
What to Expect This Week
Over the long term, the structural case for gold remains intact. In the short term, however, price action is being driven more by liquidity, reserve flows, and sovereign balance-sheet pressure than by fear alone. In other words, the marginal buyer has stepped back, and that helps explain why gold is falling despite an unstable geopolitical backdrop.
The key issue this week is whether markets continue to price gold mainly through the lens of inflation and interest rates, or whether they shift back toward direct safe-haven demand. The war in the Persian Gulf remains the dominant driver. If energy disruption worsens, gold could eventually benefit as a geopolitical hedge, but the first reaction may once again be a stronger dollar and tighter financial conditions.
The base case for the next few days is high volatility and two-way trading, rather than a clean rebound. Gold is oversold on a short-term macro basis after last week’s washout, so relief rallies are possible. But for a more durable recovery, bullion likely needs at least one of the following: a softer dollar, lower Treasury yields, weaker U.S. activity data, or a deeper risk-off move that revives direct haven buying. Without that, rallies may remain vulnerable.
Gold – Daily Technical View
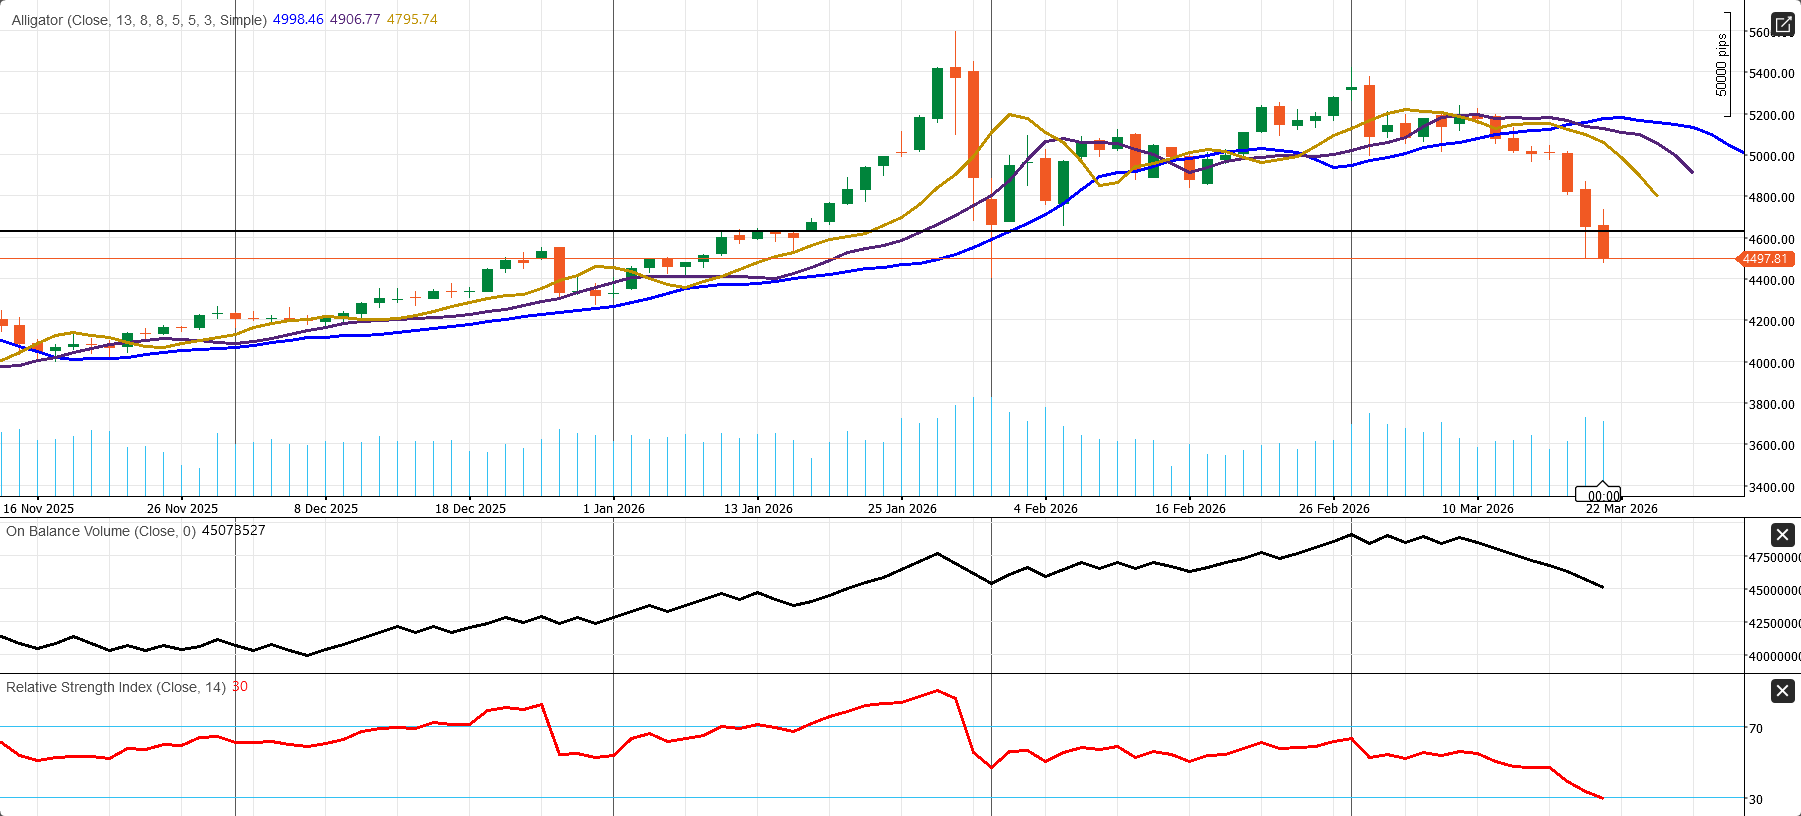
The short-term trend in XAU/USD remains clearly negative after a strong downside break. Gold is trading near 4498, well below the key 4600 support area.
- Alligator indicator: Price is below all three lines, and the lines are beginning to fan lower, reinforcing the bearish structure.
- RSI: Around 30, showing the market is near oversold territory. That allows for a short-term bounce, but not yet a reversal signal.
- OBV: Still falling, suggesting distribution remains active and buyers have not returned convincingly.
Key levels to watch:
Support: 4490–4500, then 4400, followed by 4300.
Resistance: 4600 first, then stronger resistance near the Alligator lines around 4800–5000.
As long as the price remains below 4600, rallies may stay corrective only. A move back above 4600 would be the first sign of stabilization, but bulls would need to reclaim much more of the 4800–5000 region to improve the broader picture.
WTI Weekly Outlook:
Supply Shock Keeps Oil Market in a Bullish but Highly Volatile Regime
The oil market enters the new week still trading as a war-driven supply shock, not as a normal cyclical crude market. By Friday, Brent settled at $112.19, while the front-month April WTI contract closed at $98.32 and the more active second-month WTI contract ended at $98.23. Reports also indicated that prices finished at their highest levels in nearly four years as the conflict intensified and supply disruptions in Iraq deepened. That backdrop continues to keep the market focused on physical scarcity, geopolitical risk, and emergency supply responses rather than on standard demand-cycle dynamics.
The core driver remains the Persian Gulf supply disruption. The Strait of Hormuz, which handles roughly 20% of global oil and LNG flows, has been severely disrupted, while Iraq has declared force majeure on foreign-operated oilfields and cut Basra Oil Company production to 900,000 barrels per day from 3.3 million barrels per day after southern exports were halted. Broader Gulf energy infrastructure has also come under attack, worsening an already fragile regional supply picture. This is the main reason oil prices remain elevated and highly reactive to every headline tied to shipping, production outages, or military escalation.
There are some buffers in place, but they do not yet look large enough to fully offset the scale of the shock. The IEA announced a 400 million barrel emergency stock release from member-country reserves, and U.S. officials have signaled that additional Strategic Petroleum Reserve (SPR) releases remain possible. At the same time, OPEC+ had already planned a modest 206,000 barrels per day production adjustment for April before the war intensified, but that increase is small relative to current disruptions. The United States has also temporarily lifted sanctions on Iran’s oil exports and on its 140 million barrels of oil reserves in an effort to inject more crude into the market and control prices, while similar flexibility was reportedly extended last week for Russian tanker reserves. Even so, these measures are being viewed more as partial relief than a full solution.
The U.S. domestic picture is supportive of oil, although not explosive on its own. EIA data for the week ended March 13 showed that U.S. commercial crude inventories rose by 6.2 million barrels to 449.3 million, while gasoline inventories fell 5.4 million barrels and distillates fell 2.5 million barrels. U.S. crude production stood at 13.668 million barrels per day, refinery utilization increased to 91.4%, and total products supplied averaged 21.0 million barrels per day over the last four weeks, up 2.1% from a year earlier. This combination suggests that crude supply is still available in the U.S., but refined-product balances are tightening. In a geopolitical supply shock, that matters because it keeps pressure on fuels even when headline crude inventories rise.
U.S. shale is also unlikely to solve this problem quickly. Total U.S. oil and gas rigs reportedly fell by one to 552 this week, although oil rigs rose by two to 414, the highest level since mid-December. Even with higher prices, producers are still keeping capital spending disciplined, while the EIA’s March outlook projects U.S. crude production at 13.6 million barrels per day in 2026, rising only modestly despite the recent surge in prices. That reinforces the broader market view that supply responsiveness remains limited, especially when the shock is this large and this sudden.
This is no longer just an oil story. The world is facing what has been described as an unprecedented energy shock, one that the IEA says is worse than the 1973 oil embargo, because it is affecting not only crude oil but also gas, LNG, refined fuels, chemicals, and fertilizer inputs across the global economy. Around 400 million barrels, or roughly four days of global supply, have already been removed from the market, pushing energy prices up by about 50%. Higher transport, heating, electricity, and industrial costs are now feeding into household budgets, corporate margins, and government policy responses. Countries are already responding with measures such as fuel rationing, travel cuts, export restrictions, lower energy use, and contingency planning.
The gas side of the crisis is especially severe. Strikes on major Gulf gas facilities, including South Pars and Ras Laffan, have pushed natural gas prices sharply higher in both Europe and Asia. The reported loss of LNG supply could last three to five years, which means the current crisis may not be temporary and could remain a structural factor for global energy pricing. That broader energy stress is one reason analysts now describe this episode as more dangerous than earlier periods of Gulf tension.
For the week ahead, the bias in WTI remains bullish but highly volatile. As long as Hormuz traffic stays restricted and Gulf outages continue, the path of least resistance remains higher. However, WTI may continue to underperform Brent because the U.S. benchmark is relatively better supplied, and its discount to Brent has already widened to the largest in 11 years. In practical terms, this remains a market with real upside risk, but also one that can produce violent reversals on any headline tied to safe-passage agreements, SPR releases, or faster-than-expected Iranian cargo flows back into Asia. The most important things to watch this week are Hormuz shipping headlines, further Iraqi or Gulf production losses, CERAWeek discussions on emergency supply responses, and the next EIA weekly petroleum report on Wednesday.
WTI – Daily Technical View
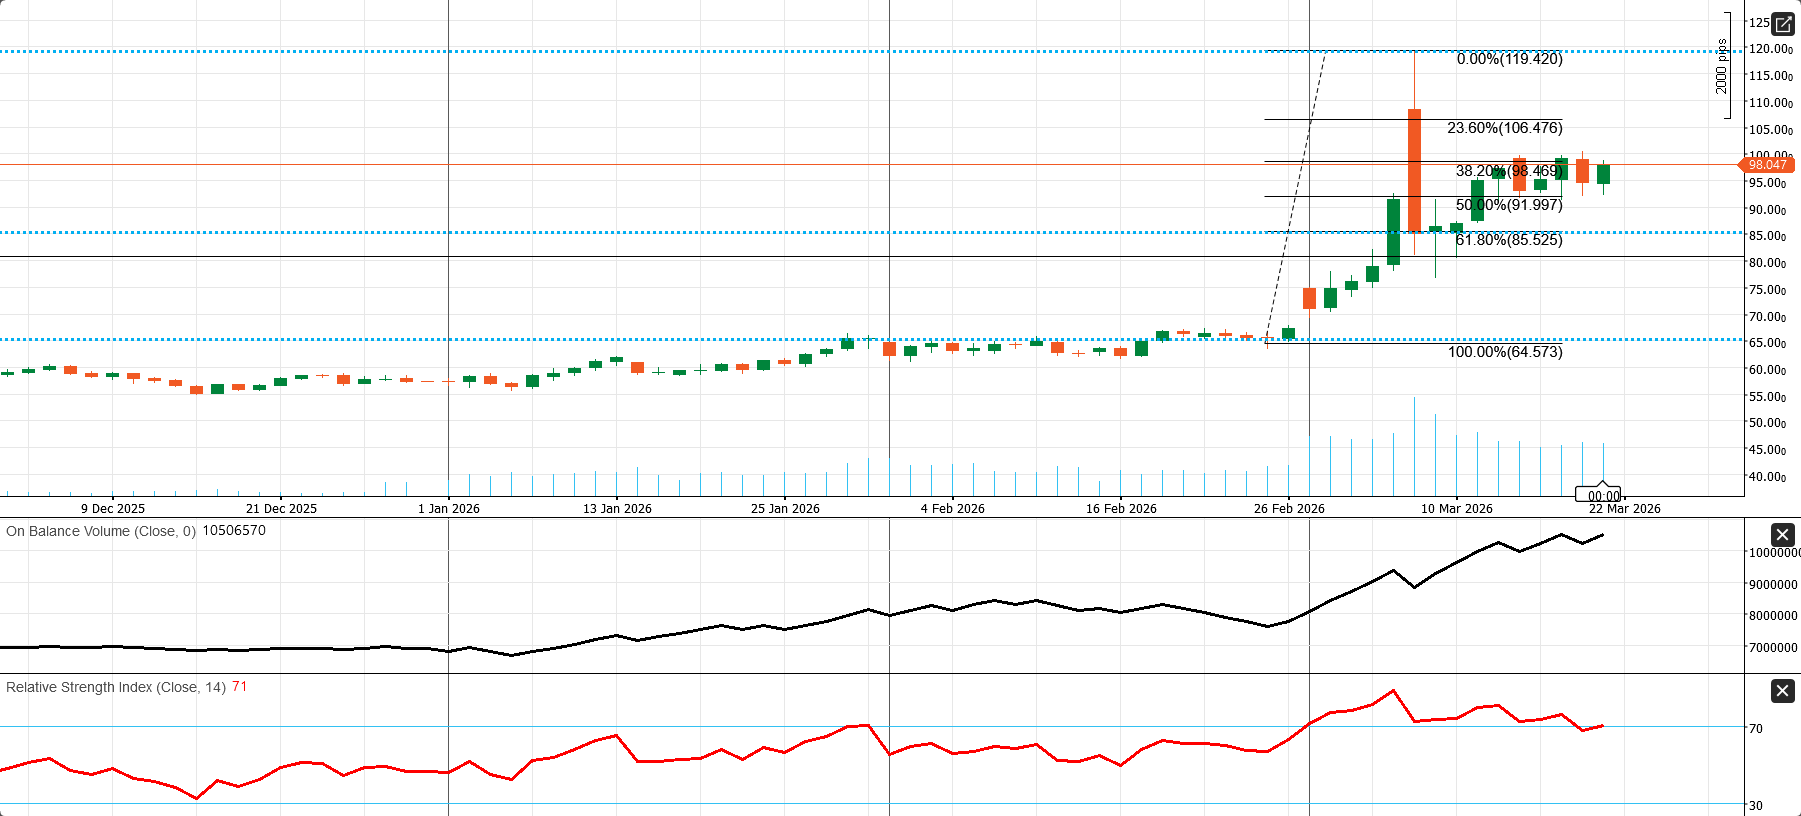
WTI still looks like a bullish market in consolidation, not a confirmed reversal. The broader bullish structure remains intact after the breakout from the long base around 64–65. Price is now trading near 98.0, just below the 38.2% Fibonacci retracement at 98.47, which makes this a key short-term pivot zone.
- RSI: Around 71, showing strong momentum but also signaling that the market is near overbought territory.
- OBV: Still rising sharply, supporting the idea that the broader move continues to be backed by strong buying pressure.
Key technical levels:
Immediate resistance: 98.5, then 106.5. A break above 106.5 would reopen the move toward the prior spike zone.
Immediate support: 92.0 (50% Fib), then 85.5 (61.8% Fib). The 85–92 area remains the key support band for bulls.
As long as WTI holds above 92.0, the broader upside structure remains favorable. A move back above 98.5 would strengthen the case for another test of 106.5, while a break below 92.0 would signal a deeper pullback toward 85.5.
Bitcoin Weekly Outlook:
ETF Inflows Support Recovery, but Macro Risks Keep BTC in a Fragile Range
Bitcoin enters the new week in a mixed but still fragile position, with the market showing signs of stabilization but not yet a fully convincing bullish breakout. The recovery from the early-February washout has been significant, especially after BTC briefly fell toward $60,000, but the broader structure still looks more like a macro-sensitive trading market than a clean, self-sustaining bull cycle. According to Reuters, Bitcoin was trading near $74,300 on March 17, while Citi said the coin is likely to remain range-bound around $70,000 as investors wait for clearer legislative and macroeconomic catalysts. That combination captures the current state of the market well: Bitcoin is no longer in panic mode, but conviction remains limited.
One of the most important developments supporting the crypto market has been the renewed strength in crypto ETF inflows. Since the start of the Iran-US conflict, crypto ETF assets have reportedly increased by $12 billion, showing that digital assets have attracted fresh attention during a period of instability in traditional markets. According to figures cited from The Kobeissi Letter, crypto ETFs attracted $1.06 billion in inflows over the past seven days, marking the strongest weekly result since mid-January and the third straight week of positive inflows. Over that three-week period, total inflows reached more than $2.8 billion, nearly offsetting the $3.9 billion of outflows seen during the previous five-week sell streak.
That rebound in ETF demand matters because it suggests that institutional investors are beginning to return after a more cautious period. The recovery has been led primarily by Bitcoin ETFs, which brought in approximately $793 million last week, representing nearly 75% of total ETF inflows. Over the last three weeks, Bitcoin ETFs have attracted around $2.2 billion, reinforcing the view that institutions still see Bitcoin as the preferred crypto exposure in volatile macro conditions. The idea that $70,000 may be acting as a key institutional entry zone has become increasingly important, especially in a market where traditional risk assets remain under pressure.
Ethereum ETFs have also contributed to the broader recovery in crypto ETF flows. They recorded $315 million in inflows last week, with the recent launch of the BlackRock Ethereum ETF (ETHB) potentially helping sentiment. Even so, the year-to-date picture for Ethereum remains more neutral, with net flows now close to zero. That contrast is important. It suggests that while institutional demand for crypto exposure is returning, the strongest conviction is still directed toward Bitcoin rather than the wider digital-asset complex.
The result of these inflows is that total crypto ETF assets under management have reportedly climbed to $140 billion, up 9.4% since the beginning of the Iran-US conflict. That is a notable development because it is happening during a period of broader geopolitical turbulence and volatility across traditional markets. In other words, while risk assets elsewhere have struggled, crypto ETFs have become an increasingly attractive vehicle for investors seeking exposure to digital assets without holding coins directly.
Still, the biggest issue for Bitcoin remains the macro backdrop. The Federal Reserve kept interest rates unchanged at 3.50%–3.75% on March 18 and emphasized that uncertainty around the economic outlook remains elevated, especially given the unclear implications of Middle East developments for the U.S. economy. That matters because Bitcoin tends to struggle when markets interpret higher oil prices and geopolitical stress as reasons for stickier inflation, firmer bond yields, and fewer rate cuts. In that environment, BTC behaves less like an isolated crypto story and more like a high-beta macro asset.
That is why the current market still feels like a trading market, not a clean trend market. Bitcoin has stabilized well above the February panic lows, but one of the key medium-term bullish pillars has weakened. Citi reportedly cut its 12-month BTC target to $112,000 from $143,000, largely because progress on U.S. crypto market-structure legislation has stalled. That reduction matters because clearer legislation had been seen as a major catalyst for broader institutional adoption and stronger ETF-driven demand.
For the week ahead, the base case remains choppy, two-way trading, with only a slight recovery bias if macro conditions improve. The $70,000 area remains the central anchor. As long as Bitcoin stays around or above that level, the market can still argue that February’s capitulation marked a panic bottom and that the current phase is a rebuilding period rather than the start of a fresh collapse. The bullish scenario is relatively straightforward: softer U.S. data, lower Treasury yields, calmer oil prices, and a steadier dollar could allow BTC to push back into the mid-$70,000s and rebuild momentum. The bearish scenario is equally clear: stronger inflation signals, firmer yields, another rise in oil, or a broader risk-off move could send Bitcoin back toward the $70,000 pivot and force the market to retest whether that support truly holds.
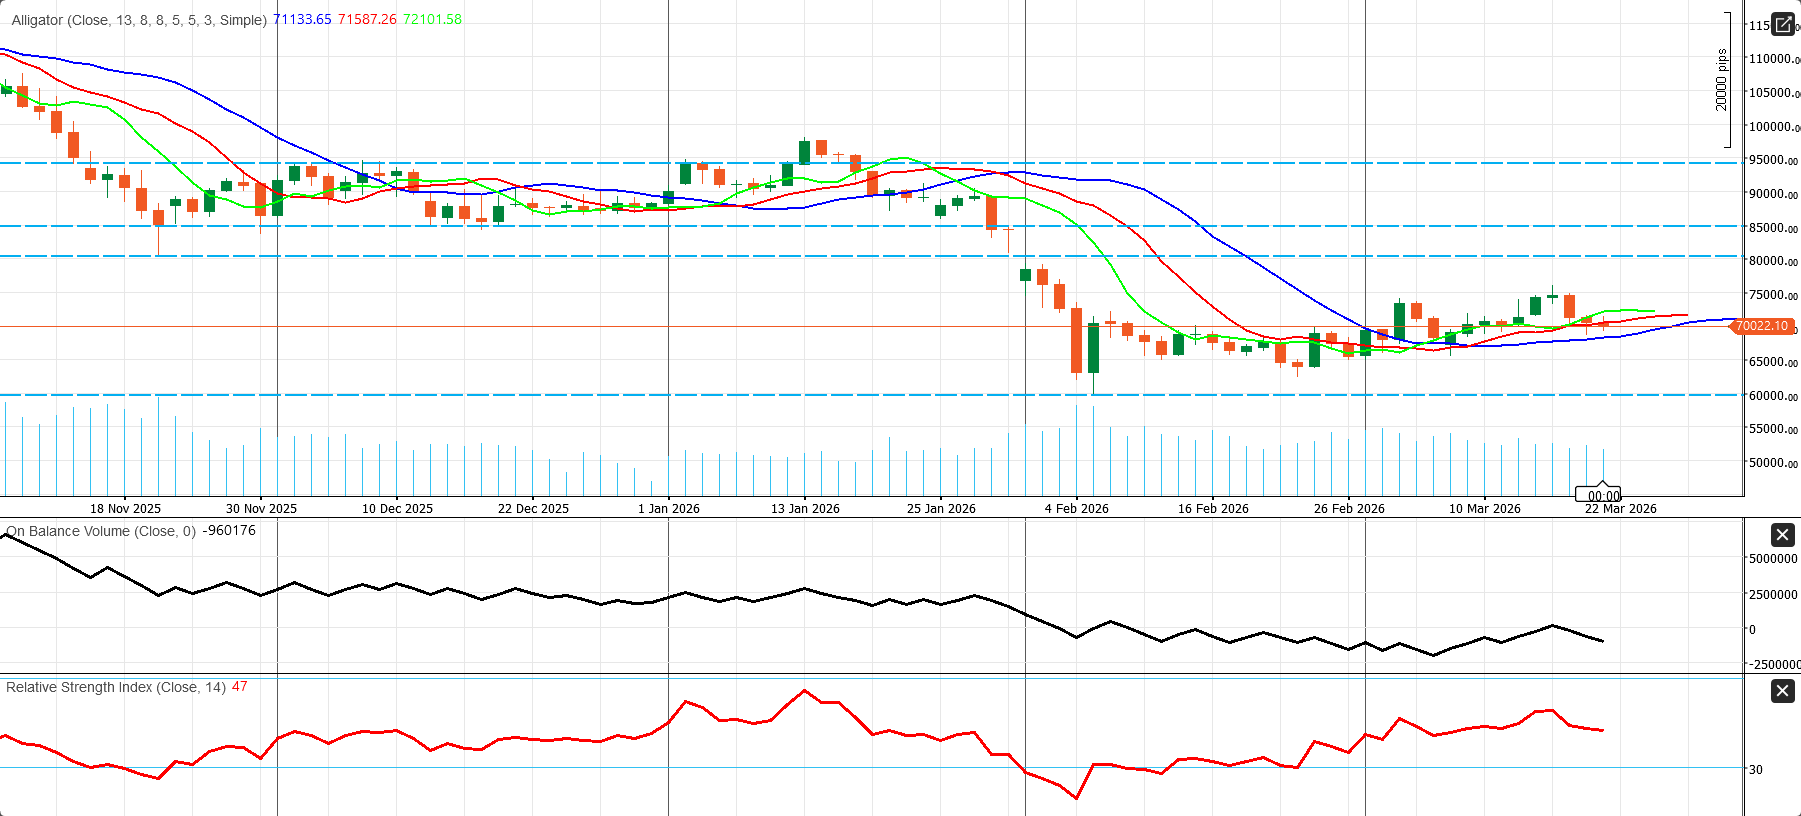
From a technical perspective, BTC/USD appears to be trying to form a base above $70,000, but the chart still needs a stronger upside break to improve sentiment decisively. The larger move from January remains bearish, while the last few weeks look more like a bottoming or consolidation phase. Price is still struggling around the $70,000–$72,000 pivot zone. The Alligator indicator shows the three lines flattening and compressing, suggesting the previous downtrend has slowed, though the price is not yet clearly above them. RSI is near 47 points to neutral momentum, while OBV remains weak, indicating that buying conviction has improved only modestly. Immediate resistance stands at $72,000–$73,000, followed by $80,000 and $85,000. Immediate support is located at $68,000–$70,000, with a break lower opening the way back toward $64,000–$60,000.
Bottom line: the crypto market looks more stable than it did in early February, but Bitcoin is still trading inside a fragile macro-driven range. ETF inflows have improved sentiment and helped rebuild the market’s foundation, but rates, yields, oil, and broader risk appetite remain the real drivers. For now, $70,000 remains the key support zone, while the low-to-mid $70,000s remain the area bulls need to reclaim to strengthen the outlook.
Comments