 English
 پارسی


Watch The Analytical Video
Global Weekly Macro Review (Last week):
War-Driven Risk Premium, Energy Shock, and Slower Growth
The global economy entered a more fragile phase this week as financial markets shifted away from the earlier theme of gradual expansion and easing inflation. Instead, investors focused on a new macro regime shaped by geopolitical risk, rising energy prices, and renewed growth concerns. The escalation of conflict in the Middle East became the main driver of global sentiment, pushing oil prices sharply higher and creating a broad war-driven risk premium across commodities, currencies, bond yields, and equities.
The strongest transmission channel was energy. Higher Brent and WTI prices increased short-term inflation risks, especially for oil-importing economies in Europe and Asia. Rising energy costs also threatened consumer spending and made central banks less likely to adopt a more dovish stance. Even though OPEC+ announced a modest output increase, markets remained focused on supply disruption risks and Gulf shipping flows.
In the United States, the biggest surprise came from the labor market. Nonfarm payrolls turned negative, and unemployment edged up, raising fears that growth may be losing momentum. However, the broader economy did not show signs of collapse. Consumer spending remained resilient, services activity stayed in expansion territory, and jobless claims were still relatively contained. This created a difficult macro mix: slower growth combined with sticky price pressures.
In Europe, the picture was similarly mixed. Eurozone growth softened, while inflation came in hotter than expected. Producer prices turned positive on the month, and labor-market conditions remained relatively resilient. Manufacturing showed signs of improvement, but construction remained weak and country-level performance stayed uneven, with Germany and Italy looking firmer than France. This leaves the region more exposed to any prolonged energy shock.
China continued its policy shift toward technology, innovation, and industrial upgrading, while economic activity signals remained inconsistent. Japan looked steadier, supported by stronger capital expenditure and continued services growth.
Overall, the global economy is not yet in recession, but downside risks clearly increased. Markets are now pricing a world of higher inflation uncertainty, geopolitical stress, and weaker growth momentum, making the near-term global macro outlook more volatile and risk-sensitive.
USA
In the week ahead, the U.S. outlook is cautiously fragile. Growth is not obviously collapsing, but the labor story has worsened, inflation is still not decisively beaten, and oil has added a fresh complication. The week’s hierarchy is clear: Wednesday CPI, Friday PCE/GDP, and Treasury auctions throughout the week. This is the last heavy run of inflation and labor-demand inputs before the March 17–18 FOMC, so markets are likely to treat every major release as part of one broader question: is the Fed moving toward relief, or being forced to stay restrictive into a softer labor market?
U.S. Weekly Macro Review:
Growth Holds, Labor Cracks, and Inflation Stays Noisy
The U.S. economy still looks like it is expanding, but this week’s macro picture became noticeably more fragile. The broad story is no longer one of steady growth and smooth disinflation. Instead, markets are now dealing with a more difficult combination: economic activity is still positive, but labor-market momentum has weakened sharply, while inflation signals remain mixed enough to keep the Federal Reserve cautious.
Growth has not collapsed, but it is clearly slowing from the stronger pace seen earlier. One of the clearest signs came from the Atlanta Fed’s GDPNow estimate for first-quarter growth, which fell from 3.0% to 2.1%. That is still consistent with expansion, but it suggests the economy is losing momentum. Inventory data offered only limited support. Retail inventories excluding autos rose 0.4%, while business inventories increased 0.1%. These figures may help GDP mathematically, but they also raise a concern: higher inventories can reflect weaker final demand if goods are not being sold as quickly as expected.
Consumer spending sent a similarly mixed message. Headline retail sales for January fell 0.2% month over month, and core retail sales were flat. At first glance, that looked soft. However, the details were not as weak as the headline suggested. The retail control group, which feeds directly into GDP calculations, still increased modestly, while sales excluding gasoline and autos also rose. On a year-over-year basis, retail sales growth improved to 3.16% from 2.43%. This suggests that the U.S. consumer is cooling, but not breaking. Households appear more cautious and selective, yet spending has not fallen enough to signal a major demand shock.
The most important development of the week came from the labor market. February non-farm payrolls fell by 92,000, far below expectations for a gain. Private payrolls also declined sharply, and revisions to prior months reduced the recent trend even further. The three-month average payroll gain dropped to just 6,000, showing a major loss of hiring momentum. Weakness was broad across sectors, which made the report harder to dismiss as a one-off distortion. The household survey also softened, with the unemployment rate rising to 4.4% and labor-force participation slipping to 62.0%.
Still, not every labor indicator pointed to a collapse. Initial jobless claims remained low at 213,000, suggesting layoffs have not surged. Challenger job cuts also fell sharply, and ADP payrolls still posted a modest gain. However, continuing claims rose to 1.868 million, indicating that unemployed workers may be taking longer to find new jobs. At the same time, wage growth remained firm, with average hourly earnings rising 0.4% on the month and 3.8% from a year earlier. That is an uncomfortable mix for policymakers: payroll growth weakened sharply, but wage pressure has not eased enough to give the Fed full confidence.
Inflation data did not provide a clean signal either. Import prices rose only slightly and were lower than a year earlier, suggesting imported inflation is still relatively contained. Export prices also showed some moderation on an annual basis. However, domestic cost pressures remained more stubborn. Unit labor costs rose 2.8% in the fourth quarter, beating expectations, while productivity also increased 2.8%. Stronger productivity is one of the brighter parts of the macro backdrop because it can help absorb wage pressure over time. Even so, near-term inflation signals remain noisy.
Business surveys reinforced that concern. Manufacturing prices paid jumped sharply, while services prices paid stayed elevated. These readings are not consistent with a fully benign inflation environment. Some of the pressure appears linked to tariffs, especially in industrial metals such as steel and aluminum. Higher energy prices added another layer of uncertainty. If oil remains elevated or supply risks worsen, inflation concerns could intensify even if domestic demand is slowing.
At the same time, business activity surveys still painted a more resilient picture than the payroll report. ISM manufacturing rose to 52.4, and ISM services strengthened to 56.1, with both reports showing solid new orders and expanding backlogs. S&P Global PMIs also remained in expansion territory. That suggests the economy is still growing, with services continuing to provide the main support.
The bottom line is that the U.S. economy is still expanding, but the balance has become more delicate. Consumer spending remains positive, services are still strong, and productivity offers an important cushion. But the payroll shock changed the tone of the macro outlook. If labor weakness continues, downside growth risks will become harder to ignore. Yet with wage growth still firm, survey-based price pressures elevated, and oil adding fresh uncertainty, the Fed is not facing a simple case for rapid rate cuts. The U.S. macro outlook now looks like a fragile balancing act between slower employment growth and inflation signals that remain too noisy for comfort.
U.S. Economic Outlook for the Week Ahead:
The week of March 9–13, 2026, is one of the most important macro weeks for the United States ahead of the March 17–18 FOMC meeting. This is not a classic growth-heavy week driven by payrolls and ISM surveys. Instead, it is a week dominated by inflation, interest-rate expectations, labor-demand signals, and Treasury supply, all of which will shape how markets interpret the Federal Reserve’s next move.
The key events are clear. Wednesday’s CPI report will be the first major release, followed by Friday’s PCE inflation data, the second estimate of Q4 GDP, and the JOLTS labor-demand report. Alongside those releases, markets will also have to absorb a full round of 3-year, 10-year, and 30-year Treasury auctions from Tuesday through Thursday. Together, these data points will help determine whether the Fed is moving closer to policy relief or whether sticky inflation and higher energy prices will force it to remain restrictive for longer.
The backdrop is already complicated. At its January meeting, the Fed kept the policy rate unchanged at 3.50%–3.75%, describing the economy as still expanding at a solid pace, with low job gains and inflation that remained somewhat elevated. Since then, the incoming data have become more mixed. The latest payroll report showed a 92,000 decline in February nonfarm payrolls, the unemployment rate rose to 4.4%, and wage growth remained firm at 0.4% month over month and 3.8% year over year. That combination has made the labor picture less comfortable without yet confirming a full breakdown.
Consumer activity has also softened but not collapsed. January retail sales fell 0.2% month over month, although annual growth still stood at 3.2%. Meanwhile, the Atlanta Fed GDPNow estimate for first-quarter growth was 2.1% as of March 6, pointing to continued expansion but at a slower pace than earlier expectations suggested. This means the U.S. economy is still growing, but the margin for policy error has become narrower.
Another major complication is energy. Oil prices have jumped sharply as the Middle East conflict intensified, adding a fresh inflation risk just as markets were already uncertain about the timing of Fed rate cuts. Importantly, next week’s CPI and PCE reports were compiled before the latest energy shock fully hit. That means investors may treat the inflation data as partly backward-looking while simultaneously repricing for a potentially hotter near-term path for oil and gasoline prices.
The week begins with a relatively lighter Monday, when attention is likely to stay on market positioning after Friday’s weak payrolls report and ahead of the inflation data. Housing will also remain in focus. Existing home sales likely recovered somewhat in February after weather-related weakness in January, helped by slightly better affordability and inventory conditions. Even so, the housing market remains constrained by elevated mortgage rates, which have moved back up to around 6.1%, and by still-high homeownership costs relative to household income. That suggests housing may stabilize gradually, but not rebound strongly.
The biggest macro driver, however, will be inflation. Wednesday’s CPI report is expected to show that disinflation progress has slowed again. Headline CPI is forecast to rise modestly in February, with energy contributing renewed upward pressure as oil and gasoline prices were already climbing last month. Food inflation may provide some offset, but the broader message is that inflation is not falling cleanly. Core CPI is expected to moderate slightly, helped by some cooling in services categories, but goods inflation may remain firmer due to higher used vehicle prices and tariff-related pass-through effects. On balance, both headline and core CPI are expected to remain around 2.4% year over year, which is still above a fully comfortable level for the Fed.
Friday’s personal income and spending report, including the PCE inflation measures, will then provide the second inflation check of the week. Personal income is expected to remain solid, supported by wage growth and annual Social Security adjustments, while personal spending is likely to continue expanding at a moderate pace. This would reinforce the view that households are still holding up reasonably well. However, real disposable income growth is expected to lag real consumption growth, suggesting that the consumer’s financial cushion is becoming thinner.
The Fed's path into the March meeting will depend less on any single release and more on the overall combination of CPI, claims, PCE, and labor-demand data. If inflation cools while claims stay contained, markets may revive hopes for a more dovish turn later this spring. But if inflation remains sticky and labor softens only gradually, the Fed may feel compelled to hold a restrictive stance for longer.
Finally, Treasury auctions will matter more than usual. Strong demand for new supply could calm markets and limit upward pressure on yields. Weak demand, however, could intensify bond-market volatility, especially if inflation surprises to the upside or oil continues to climb.
The bottom line is that the U.S. economic outlook for March 9–13, 2026, is cautiously fragile. Growth is still alive, but labor-market momentum has weakened, inflation progress has become less convincing, and geopolitical energy risks have raised the stakes. This week may not deliver a final answer, but it will strongly shape expectations for the March Fed meeting and the broader macro outlook.
Market Outlook:
Fed Pricing, USD Strength, and Wall Street Under Pressure
The market outlook for the week ahead is centered more on Federal Reserve pricing than on a pure growth narrative. Markets already absorbed a weak U.S. payrolls report, so the next decisive tests are inflation data, especially Wednesday’s CPI and Friday’s PCE. These releases will help determine whether softer labor conditions can actually push the Fed toward a more dovish path, or whether sticky inflation and higher oil prices will keep policymakers cautious.
The key question is not simply whether growth is slowing, but whether inflation is cooling enough to allow easier policy. If CPI and PCE both come in softer, and jobless claims remain calm, front-end Treasury yields would likely fall, and markets could price in a more confident easing path ahead of the March 17–18 FOMC meeting. By contrast, if inflation stays firm, especially with oil prices rising in the background, the Fed would probably remain in wait-and-see mode. In that case, shorter-dated yields may stay elevated even if labor indicators continue to soften. This makes the week more about rates, inflation expectations, and policy repricing than about broad economic momentum alone.
For equities, that setup means the market is likely to be more sensitive to interest rates and duration risk than to corporate earnings stories. Growth stocks and other long-duration assets would benefit the most from softer inflation prints, because lower yields tend to support higher valuations. On the other hand, financials and cyclicals are likely to react not only to CPI but also to Treasury auction demand and the broader rate backdrop. If auctions are weak and inflation is sticky, equities may struggle to hold rebounds.
U.S. dollar outlook
The U.S. dollar outlook remains tied to the same policy and risk mix. Through most of the previous week, the dollar kept a strong bias due to safe-haven demand, oil-related inflation concerns, and broad geopolitical uncertainty. It only eased slightly by Friday as markets stabilized modestly. Normally, a weak payroll report might pressure the dollar, but this time, that did not happen in a meaningful way. The reason is that softer labor data did not translate into a clean Fed pivot signal. Wage pressures remained firm, broader cost signals stayed sticky, and global risk-off conditions continued to favor dollar demand.
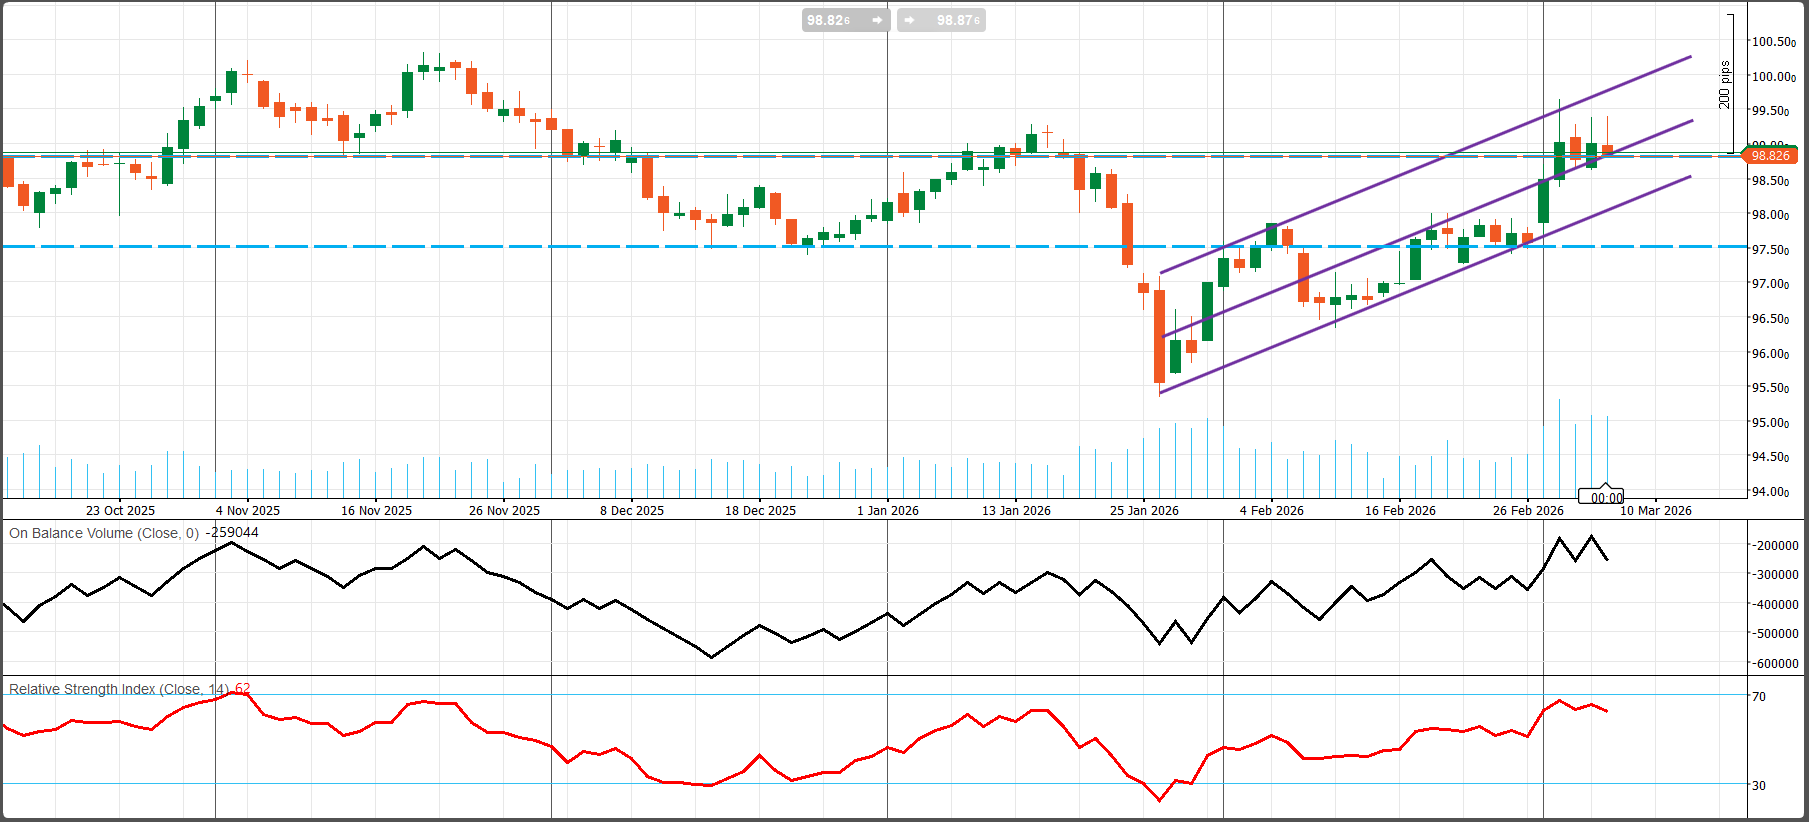
From a technical perspective, the U.S. Dollar Index daily chart still looks constructive in the near term. The trend has turned bullish on a short-term basis, with higher highs and higher lows inside an ascending channel. The rebound from the January low has been orderly rather than impulsive, suggesting that the recovery has genuine support. However, the broader picture is not fully bullish yet, because price is now approaching a major resistance zone near 98.80 to 99.00 rather than already breaking above it decisively.
Momentum indicators support the rebound, but they do not signal an overstretched move. RSI near 62 suggests positive momentum without overbought conditions, while improving On-Balance Volume shows that buying pressure has been meaningful. The key technical question is whether the index can clear resistance around 98.80 to 99.00. A confirmed break higher would open the way toward 99.40 to 99.60, followed by the broader upside target near 100.20 to 100.50. On the downside, support stands at 98.50 to 98.70, then 97.50, with deeper protection around 96.40 to 96.70 and finally the January low zone at 95.40 to 95.60.
Wall Street
On Wall Street, the tone weakened notably into the end of the week. Equities initially showed some ability to rebound from war-driven losses, but those rallies lacked follow-through as inflation risk and macro uncertainty remained elevated. By Thursday, risk appetite deteriorated again, and Friday delivered the clearest risk-off close of the week. The Dow Jones fell 0.91%, the S&P 500 lost 1.33%, and the Nasdaq dropped 1.60%. The sharper weakness in the Nasdaq reflected investor caution toward long-duration growth exposure amid rising rates, inflation, and geopolitical risks.
The S&P 500 technical picture has also deteriorated. The chart is now bearish in the short term and corrective in the medium term. The prior uptrend line has been broken; lower highs have formed since early February, and a descending trendline now caps rallies. The index has fallen back to a major support zone around 6730 to 6720, making this the central battleground for the near term.
Technical internals are not especially supportive for bulls. RSI near 39 shows weak momentum without yet reaching a fully oversold condition, which means there may still be room for additional downside. Falling OBV suggests real distribution and confirms that selling pressure is not superficial. Heavier downside volume in recent sessions adds to the bearish case.
The main support remains 6730 to 6720. If that area holds, the market could attempt a relief bounce. If it breaks on a daily closing basis, the next downside zones come in near 6620 to 6630, followed by the larger support around 6500. On the upside, resistance stands at 6810 to 6820, then 6900 to 6910, with the major swing-high barrier at 7000 to 7020.
Overall, this is a Fed-pricing week first and a growth week second. Inflation data, Treasury auctions, and policy expectations are likely to drive the dollar, yields, and equities together. Unless inflation clearly cools, markets may remain defensive, with the dollar supported and Wall Street vulnerable to further volatility.
EU
The EU outlook is modestly constructive but still fragile. Growth is positive, unemployment is low, and inflation is much closer to target than it was a year ago. But services inflation remains sticky, financing conditions are only gradually improving, and industry still needs to prove it can sustain a rebound. The key checkpoints are German production and trade early in the week, Eurogroup and ECOFIN fiscal-policy headlines, Thursday’s euro-area industrial production, and Friday’s broader labour-market data.
Eurozone Economic Review: What Happened Last Week
Last week’s eurozone data delivered a mixed but important message: the economy is still growing, but the expansion remains slow, uneven, and more inflation-challenging than markets had hoped. For the European Central Bank, the overall picture was slightly uncomfortable. Growth softened into the end of 2025, inflation surprised to the upside in February, and producer prices rebounded on a monthly basis. At the same time, the labour market remained resilient, and business surveys suggested that parts of the private sector, especially manufacturing, are starting to stabilise. The eurozone is still moving forward, but it is doing so in a fragile and highly data-dependent way.
The clearest sign of softer momentum came from GDP. Eurozone output rose 0.2% quarter on quarter in the fourth quarter, below expectations of 0.3% and slower than the previous quarter. On an annual basis, growth also eased to 1.2% from 1.4%. These numbers do not point to recession, but they do show that the region entered 2026 without much speed or buffer. In practical terms, the euro area remains in a low-speed expansion, not a broad-based or self-sustaining recovery.
Inflation was the bigger problem from the ECB’s perspective. Preliminary February data showed headline inflation rising to 1.9% year on year from 1.7%, while core inflation accelerated to 2.4% from 2.2%. Monthly momentum was also firm, with headline CPI up 0.7% and core CPI up 0.8%, reversing the previous month’s declines. Even the broader measure excluding energy and food edged higher. This matters because it interrupts the recent disinflation trend and makes it harder for markets to argue for fast or aggressive ECB easing. With services inflation still sticky and energy risks still in the background, the central bank is likely to remain cautious.
Producer prices reinforced that message. Eurozone PPI was still negative on an annual basis at -2.1%, so producer-price deflation has not disappeared. However, the 0.7% monthly rise was much stronger than expected and marked a sharp turnaround. That suggests pipeline price pressures can re-emerge quickly even when annual data still look benign. In other words, disinflation is continuing, but not cleanly or linearly.
The labour market remained one of the eurozone’s main strengths. The unemployment rate fell to 6.1%, slightly better than expected, while employment grew 0.2% quarter on quarter and 0.7% year on year in the fourth quarter. Total employment reached about 172.57 million. A firm labour market matters because it helps support household income and consumption even when growth is weak. However, for the ECB, labour resilience also means domestic inflation pressure cannot yet be ignored.
Business surveys offered a somewhat more constructive signal. The eurozone manufacturing PMI rose to 50.8, moving back above the 50 threshold and pointing to renewed expansion in factory activity. The services PMI held at 51.9, while the composite PMI also remained at 51.9, showing modest private-sector expansion. This is an encouraging sign, especially since manufacturing had been one of the weakest parts of the euro-area economy for much of the previous cycle.
Still, national divergence remains a major theme. Germany looked firmer, with stronger services and composite PMI readings pointing to solid expansion. Italy also remained in growth territory and appeared relatively stable. France remained the weakest large economy, with services and composite PMIs still slightly below 50, confirming ongoing softness. This means the eurozone recovery is real, but highly uneven.
Construction stayed under pressure, with the eurozone construction PMI improving to 46.0 but still signaling contraction. Germany and France remained weak, while Italy was the exception and returned to expansion. Retail sales also reflected a mixed demand backdrop. Eurozone retail sales fell 0.1% month on month, although they were still 2.0% higher year on year, suggesting the consumer is not collapsing but remains inconsistent.
Overall, last week left the eurozone with a more stagflationary tone at the margin. Growth slowed, inflation came in hotter, and pipeline price pressures reappeared. Yet labour markets held up, and business surveys improved. The result is a eurozone economy that is not in immediate trouble, but still trapped in a fragile, low-speed recovery. For the ECB, the message is clear: the economy is not weak enough to force urgent support, but inflation is still noisy enough to prevent easy confidence.
EU Economic Outlook for the Week Ahead
The EU and euro-area economic outlook for the week ahead remains modestly positive, but the overall backdrop is still fragile. Growth has not stalled, and the region continues to expand at a slow pace, supported mainly by household consumption, government spending, and fixed investment. At the same time, inflation has become more complicated again, industrial momentum remains uneven, and financing conditions are improving only gradually. That leaves this week as an important pre-ECB positioning week, even though no policy decision is expected until the March 18–19 ECB meeting.
The latest GDP data confirm that the euro area is still growing, but only at a low-speed pace. Eurostat’s latest estimate showed that GDP rose 0.2% quarter on quarter in Q4 2025 in both the euro area and the broader EU. This means the region is avoiding contraction, but it is not yet delivering a strong or self-sustaining recovery. Domestic demand remains the main source of support, while trade has continued to drag on growth. That imbalance is important because it shows that Europe is still relying more on internal resilience than on external demand.
Inflation remains one of the most sensitive issues for markets and policymakers. Although weaker demand in recent months helped reduce pricing pressure, the latest data showed CPI rising to 1.9% in February from 1.7% in January. That increase matters because it suggests that underlying price pressure has not disappeared, even in an environment of modest demand. If growth stays soft while inflation starts to re-accelerate, markets may become more concerned about a mild stagflationary risk building in Europe. This does not yet mean the region is in stagflation, but it does make the inflation backdrop less comfortable for the ECB.
The labour market remains one of the strongest pillars of the euro-area economy. Employment rose 0.2% quarter on quarter, and the euro-area unemployment rate fell to 6.1% in January from 6.2% in December. That is a constructive signal because a resilient labour market helps support income, spending, and confidence even while broader growth remains weak. However, firm labour conditions can also keep wage and services inflation more persistent, which is one reason the ECB is unlikely to rush into a more dovish stance.
This week’s calendar places a strong focus on Germany, which remains the euro area’s most important industrial economy. Monday brings several key German indicators, including manufacturing new orders, turnover, the production index, and the truck toll mileage index. These releases will help markets assess whether the German industrial sector is stabilizing after a weak production backdrop but stronger order data. Tuesday’s German foreign trade data will also be important because Germany’s export cycle still plays a major role in shaping the broader EU industrial narrative.
Beyond Germany, Thursday’s euro-area industrial production data will be the most important hard-data release for the bloc as a whole. This report should give the clearest indication of whether industrial activity across the eurozone is genuinely improving or still moving in an uneven pattern. Recent country-level data have been mixed. France showed some rebound in industrial production, while Spain’s data were more inconsistent. The aggregate euro-area figure will help determine whether the bloc is leaning toward stabilization or renewed softness.
Policy headlines will matter as well. The Eurogroup meeting on Monday and the ECOFIN meeting on Tuesday could shape the fiscal-policy narrative, especially through discussions on macroeconomic developments, budget plans, the economic effects of the war in Ukraine, and broader financial legislation. These meetings may not trigger immediate market moves on their own, but they can affect expectations around fiscal support, sovereign spreads, and longer-term financial integration across the EU.
Another key theme is ECB repricing into the March meeting. The ECB kept rates unchanged in February, with the deposit rate at 2.00%, the main refinancing rate at 2.15%, and the marginal lending rate at 2.40%. Markets now need to assess whether incoming data justify a more dovish tone later in March. Stronger German and euro-area data would support the view that the economy is still grinding forward, but they would not automatically be euro-positive if inflation remains sticky and the ECB sees less reason to ease.
The final major driver is financing conditions. Borrowing costs in the euro area are no longer tightening sharply, but they are also not easing fast enough to create a strong cyclical boost. That means credit conditions remain a constraint rather than a clear tailwind.
Overall, the EU economic outlook for the week ahead is cautiously constructive, but still vulnerable. Growth is positive, labour markets remain supportive, and industry may be stabilizing. Yet inflation has become less comfortable again, trade remains soft, and the ECB is still likely to stay cautious.
EUR/USD Technical Analysis – Daily Chart
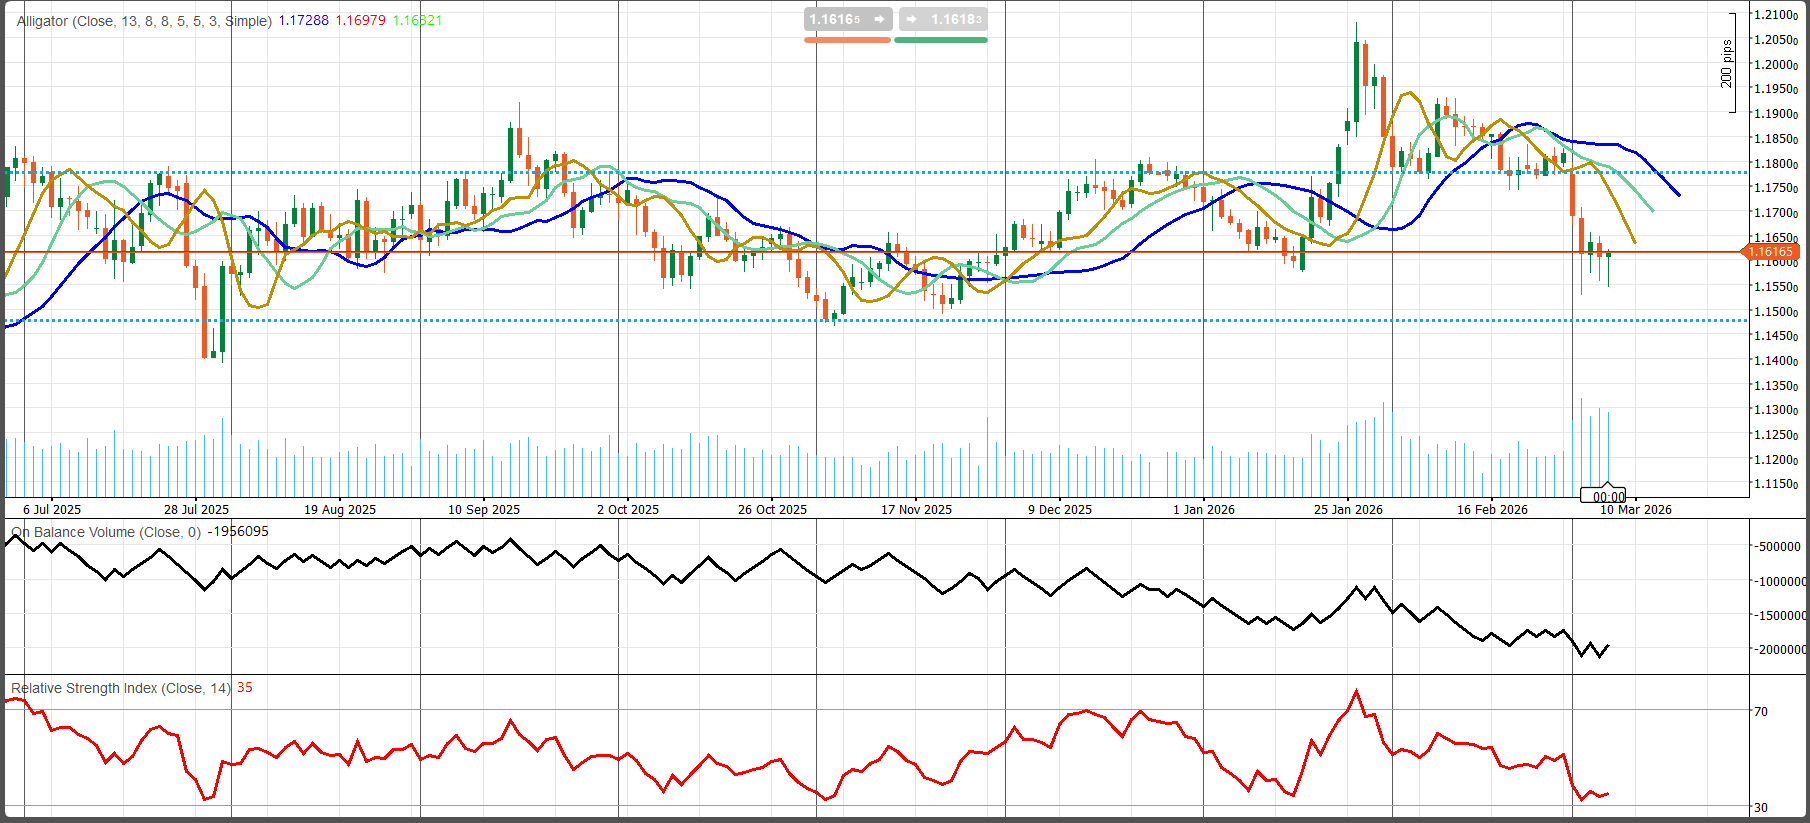
EUR/USD has shifted from a choppy consolidation phase into a clearer bearish structure on the daily chart. The most important change is the pair’s retreat toward the 1.1615 support zone, a major horizontal pivot that previously acted as a key decision area. After the late-January and early-February rally failed near the 1.20–1.21 region, the price lost momentum sharply, and the chart is now testing whether this support can hold or whether a deeper downside move is beginning.
The short-term trend has turned negative. Price rolled over from the recent highs, rallies have become weaker, and sellers are pressing the pair directly into support. The Alligator indicator also supports the bearish outlook. The fast line has turned lower and moved below the other averages, while the slower blue line is also starting to roll over. This setup usually signals that the market is leaving a consolidation phase and entering a trending environment, with the current direction pointing down.
Momentum indicators confirm that pressure remains on the downside. RSI near 35 shows weak momentum and places the pair close to oversold territory, but not yet at a level that would suggest the selloff is fully exhausted. This means bearish momentum is still dominant, and another downside extension remains possible before a stronger rebound develops. On-Balance Volume (OBV) is also trending lower, confirming that selling pressure is backed by volume rather than temporary weakness.
From a technical perspective, 1.1615 is the main level to watch. If it holds, EUR/USD could stage a short-term rebound. If it breaks decisively on a daily closing basis, the next downside target comes near 1.1450. On the upside, resistance stands at 1.1780, followed by 1.1850–1.1900. The broader bullish structure would only improve meaningfully above 1.2050–1.2100.
Gold Market Outlook: Current Market Condition and Weekly Outlook
Gold enters the new week with its long-term bullish structure still intact, but the short-term picture has become far more complicated. The metal is no longer trading in a clean, one-directional rally. Instead, it is moving through a headline-driven environment shaped by geopolitical risk, weaker U.S. labor data, higher oil prices, and uncertainty over the Federal Reserve’s next move. That makes the coming week especially important for the gold market, with Wednesday’s U.S. CPI report and Friday’s PCE inflation data likely to be the decisive macro catalysts.
The current market condition in gold reflects a clash between bullish and bearish forces. On the bullish side, gold continues to benefit from its traditional role as a safe-haven asset. The escalation of geopolitical tensions in the Middle East triggered an early-week surge in haven demand, pushing gold sharply higher. At the same time, weaker U.S. labor data added a second supportive force. February nonfarm payrolls fell by 92,000, and the unemployment rate rose to 4.4%, reinforcing the argument that the U.S. economy may be losing momentum and that rate-cut expectations could revive later in the year.
However, gold has not been able to move straight higher because two important bearish forces have offset that support. The first is the rise in oil prices, which has increased inflation fears and complicated the macro outlook. The second is the related firmness in the U.S. dollar and Treasury yields, which tends to reduce gold’s appeal in the short term. In other words, the same geopolitical shock that helped gold through haven demand also lifted oil prices enough to create an inflation problem, which in turn made markets less confident that the Fed can ease policy quickly.
That tension explains why gold spiked first and then consolidated rather than extending higher in a straight line. The metal behaved like a classic crisis hedge during the initial shock phase, but later traded more like a volatility and positioning instrument as cross-asset signals diverged. Stocks attempted rebounds, crypto stayed unstable, oil surged, and Treasury yields remained influential. In this environment, gold stayed supported, but it was no longer a simple panic-buy trade.
Fundamentally, gold is not in a bearish regime. The broader trend remains constructive. Structural support continues to come from geopolitical instability, persistent macro uncertainty, and signs that U.S. growth is cooling at the margin. Even so, the short-term backdrop is messy because the inflation implications of the oil shock are reducing the likelihood of a quick Fed pivot. Gold bulls would normally prefer a combination of weaker growth, softer inflation, lower yields, and a weaker dollar. Instead, the market currently has weaker labor data alongside higher oil and sticky inflation concerns.
Physical demand also sends a mixed signal. High and volatile prices have started to hurt jewelry demand in some markets, especially India, where buyers have become more price-sensitive. In contrast, Chinese demand has remained firmer, suggesting that investment and strategic buying in Asia still provide an important cushion. This combination shows that while discretionary physical demand may weaken when prices become too elevated, broader investment interest in gold remains intact.
The weekly outlook for gold now depends heavily on whether markets lean more toward a growth-scare narrative or an inflation-scare narrative. Geopolitics remains the main background driver, so war-related headlines will still matter. But the most important scheduled macro events are Wednesday’s CPI report and Friday’s PCE inflation release. With the next Federal Reserve meeting set for March 17–18, these are effectively the final major inflation checkpoints before policymakers meet.
Recent Fed communication has not been especially supportive for gold in the short term. Officials have signaled that they are in no rush to ease policy and remain concerned that inflation may not be on a smooth path back to target. That matters because even though labor data have weakened, the Fed is still treating inflation and energy risks as live concerns. As a result, gold’s upside next week likely depends less on geopolitical headlines alone and more on whether the inflation data allow Treasury yields and the dollar to ease.
If CPI and PCE both come in softer than feared, gold would likely benefit from a powerful combination of factors. Markets would be more likely to revive the rate-cut story, shorter-term yields could move lower, the dollar could soften, and haven demand would still remain in the background because of geopolitical uncertainty. That would be a clearly bullish mix for bullion.
If, however, inflation remains sticky while oil stays elevated, gold may struggle to break out despite continued geopolitical support. In that case, the market could conclude that the Fed must stay patient for longer, keeping yields and the dollar relatively firm. That would not necessarily trigger a major bearish reversal in gold, but it could keep prices volatile and trapped in consolidation rather than starting a fresh, sustained rally.
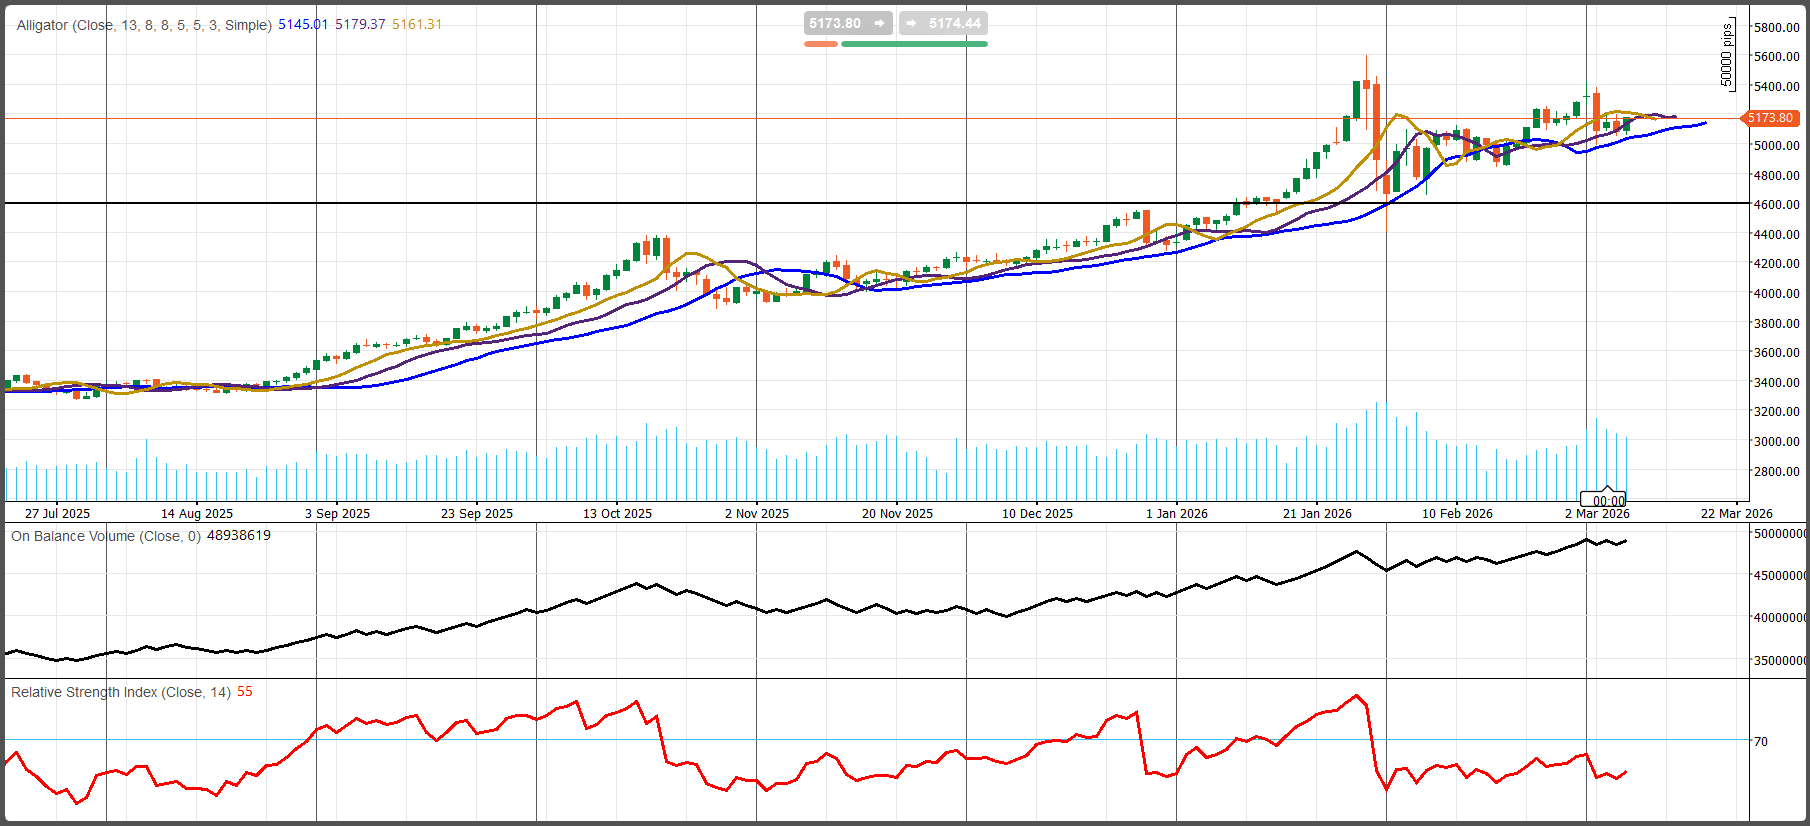
From a technical perspective, the daily chart for gold still supports the broader bullish thesis. Gold made a very strong trend advance from mid-2025 into the late-January 2026 peak near 5,500, then corrected sharply and has since been building a base above the 5,000 to 5,100 area. This is an important pattern because it looks more like consolidation within an uptrend than a full trend reversal. Price remains above the major rising long-term moving structure, and the broader sequence of higher highs and higher lows is still intact.
In the short term, momentum has cooled. Gold is no longer in a vertical rally and is instead digesting gains around the 5,150 to 5,200 zone. The Alligator lines are flattening and compressing, which usually signals a pause in trend expansion and a shift into consolidation. RSI near 55 suggests momentum has reset without turning bearish, leaving room for another upside move. OBV also remains near its highs, a constructive sign that accumulation is still broadly intact and that recent sideways movement has not turned into major distribution.
The most important near-term pivot is 5,170 to 5,180. Holding above this zone keeps the short-term tone constructive. Initial support stands at 5,050 to 5,100, followed by stronger support at 4,950 to 5,000. On the upside, the first target is 5,250 to 5,300, while the major breakout barrier remains 5,450 to 5,500.
Overall, the gold market outlook remains bullish in structure but complex in execution. The macro floor under gold is still strong, but the next directional move will depend heavily on whether softer U.S. inflation can outweigh the inflationary pressure coming from oil and geopolitics.
WTI: Current Market Condition and Weekly Outlook
WTI crude enters the new week in a strong geopolitical risk-premium regime, with prices holding above $90 not because of booming global demand, but because of an acute supply disruption centered on the Middle East. This is the most important feature of the current market. Oil is no longer trading like a standard inventory-driven commodity market. Instead, it is trading like a supply-shock market, where geopolitics, shipping disruption, and replacement-barrel risk matter far more than routine weekly fundamentals. That keeps the broader fundamental bias tilted upward, although volatility is likely to remain extreme.
The current market condition is defined by the rapid repricing of supply risk linked to the Strait of Hormuz and wider Gulf shipping routes. Throughout the week, oil traded with large swings as markets reacted to escalation headlines, partial pauses, and shifting expectations about whether the disruption might worsen or stabilize. Even when prices paused mid-week, the market kept a heavy geopolitical premium embedded, showing that traders still see meaningful downside risk to global supply flows.
WTI ended the week with an explosive gain, settling around $91.40 per barrel, up more than 12% on the week. This kind of move is not consistent with a normal rebalancing story. It reflects a market suddenly forced to price the possibility that a large amount of crude and refined product exports may remain delayed or trapped. The core issue is not whether the global market looked balanced before the shock. It is whether key barrels can move through the region quickly enough now.
That is why the usual bearish arguments have lost much of their influence in the short term. In ordinary conditions, traders would focus more closely on U.S. crude builds, refinery utilization, OPEC+ output adjustments, and rig counts. Those factors still matter, but they are secondary for now. U.S. inventory data were mixed rather than strongly bullish. Crude inventories rose, yet gasoline inventories fell, refinery runs improved, and utilization moved higher. That combination suggests domestic end-demand and refining activity have not rolled over. In other words, the U.S. balance sheet does not point to a major collapse in demand. It simply matters less than the global supply disruption story.
OPEC+ has offered only limited relief. A modest production increase helps soften panic somewhat, but it does not meaningfully offset the scale of barrels perceived to be at risk if Gulf flows remain impaired. The same is true for U.S. production signals. Oil rig counts moved slightly higher, but not enough to suggest an immediate supply surge. Markets are therefore focusing far more on disrupted shipping, product tightness, and the difficulty of quickly replacing medium and heavy barrels.
There is also clear support from the physical market. Refiners are seeking alternatives to disrupted Middle East supply, and that has pushed some U.S. Gulf heavy crude benchmarks sharply higher relative to WTI. At the same time, rising gasoline and diesel prices indicate that the market stress is already feeding into downstream pricing. This strengthens the case that the current rally is not only speculative. It also has a physical supply basis underneath it.
The weekly outlook for WTI remains bullish, but with very high volatility. The market has shifted away from concerns about future oversupply and toward a more immediate question: can blocked Gulf barrels be replaced or rerouted quickly enough? As long as the Strait of Hormuz disruption or broader war-related shipping risks remain unresolved, the path of least resistance for crude prices stays higher. In this environment, the bullish case remains in control.
At the same time, the biggest downside risk is no longer inventories or OPEC+ policy. It is a fast geopolitical de-escalation. If there is credible evidence that shipping flows are normalizing, that producer shut-ins are limited, or that the broader conflict is cooling, WTI could correct sharply. The reason is simple: a large amount of geopolitical premium has been added in a short period of time. If the shock fades quickly, part of that premium could unwind just as fast.
Looking ahead, the most important scheduled catalysts include Tuesday’s EIA Short-Term Energy Outlook, Wednesday’s EIA Weekly Petroleum Status Report, Wednesday’s OPEC Monthly Oil Market Report, and Wednesday’s U.S. CPI release. These reports will help refine the market’s view on balances, demand, and supply expectations. However, they are still likely to rank below war and shipping headlines in importance. The real order of market drivers remains: geopolitical developments first, Gulf supply risks second, product tightness and refinery demand third, inventory data fourth, and broad macro releases such as CPI after that.
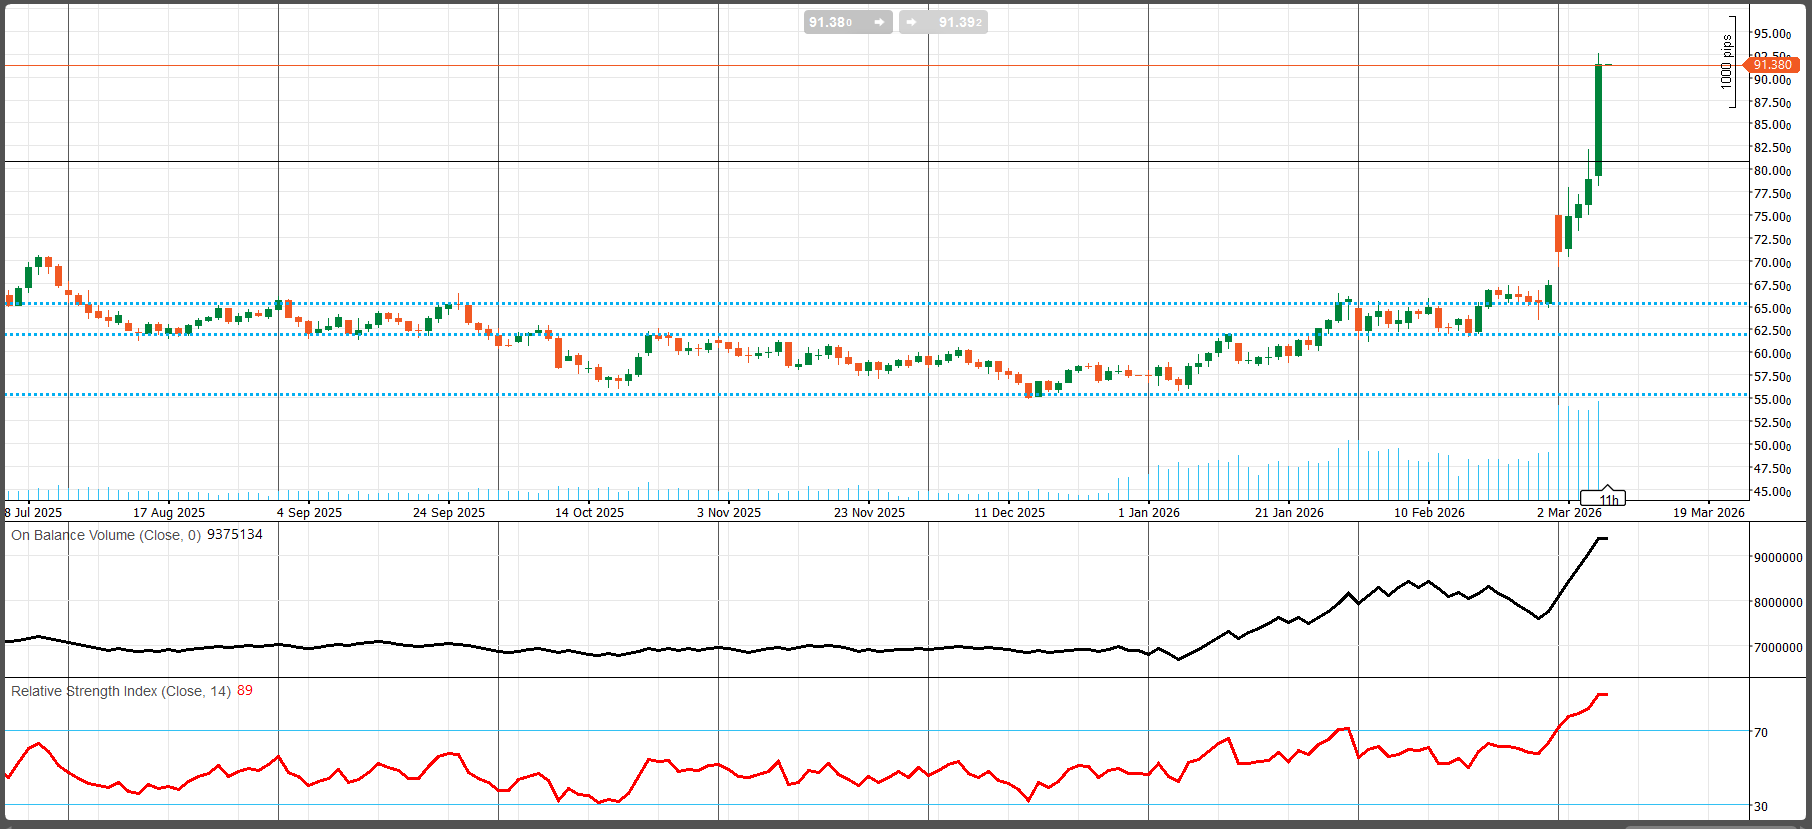
From a technical perspective, the daily WTI chart remains strongly bullish, but also increasingly stretched. Price has broken out of a long base, cleared former resistance near 65 and 80, and is now testing the major 91.40 resistance zone. This is a momentum breakout rather than a slow trend rise. That is bullish, but it also leaves the market vulnerable to violent pullbacks if momentum cools.
The strongest technical signal is still trend control by the bulls. Higher highs and higher lows remain intact, and volume confirms the breakout. However, an RSI near 89 signals an extremely overbought condition. That does not automatically mean the trend is bearish, but it does warn that chasing new highs carries greater risk. OBV remains very strong, confirming that buyers are still supporting the move with real participation.
The key technical level is 91.40. A clean break above it would open the way toward 95.00 and higher. On the downside, 80.00 is the first major support, followed by the more important medium-term breakout zone near 65.00.
Overall, the WTI market outlook remains bullish in structure and is driven primarily by geopolitics. As long as Hormuz-related disruption remains active, oil is likely to stay elevated and volatile.
Crypto Market Condition and Weekly Outlook
The crypto market outlook for the week ahead remains fragile, corrective, and heavily dependent on macroeconomic developments rather than on crypto-specific momentum. Bitcoin and Ether have recovered from their recent washout lows, but the broader market is still far from a clean bullish re-acceleration. Instead, crypto is behaving more like a high-beta macro risk asset, reacting quickly to changes in oil prices, Treasury yields, the U.S. dollar, and overall market sentiment.
That is the most important takeaway for the coming week. Crypto is not trading as a stand-alone asset class right now. It is trading as part of the broader global liquidity and risk complex. This means the key drivers are not only internal crypto narratives, but also U.S. inflation data, interest-rate expectations, and the Federal Reserve outlook ahead of the March 17–18 FOMC meeting.
At current levels, Bitcoin is near $67,873, and Etheris near $1,983.75 show that both major cryptocurrencies are still above their February lows, but they also confirm that recovery remains incomplete. The market has stabilized after the earlier breakdown, yet it has not rebuilt the kind of structure that usually supports a confident new bull leg. Instead, recent price action points to a nervous market that rebounds when macro pressure eases, then quickly slips again when inflation fears, energy prices, or bond yields rise.
This fragility has been visible over the last several sessions. Crypto rebounded earlier, but then weakened again as oil jumped, yields moved higher, and global risk appetite deteriorated. That pattern matters because it reveals the market’s current hierarchy of drivers. Right now, crypto is responding primarily to real yields, dollar strength, oil shocks, and broader risk-off conditions, not to a distinct crypto-only catalyst. In this environment, Bitcoin has behaved less like digital gold and more like a volatile extension of tech and liquidity-sensitive assets.
That macro linkage is especially important because next week is one of the last major data windows before the next Fed decision. The main scheduled catalyst is U.S. CPI on Wednesday, March 11, followed by weekly jobless claims on Thursday, and then Personal Income and Outlays, including PCE inflation, plus the second estimate of Q4 GDP on Friday, March 13. Together, these releases will strongly influence market expectations for the March 17–18 FOMC meeting.
The base case for the week ahead is that crypto remains choppy, unstable, and macro-led. Bitcoin is likely to remain the market’s main benchmark, while Ether and higher-beta altcoins may remain more vulnerable if volatility rises again. This view fits the current structure of the market. First, crypto is still only partially recovering from February’s deep selloff. Second, the latest sessions show that crypto is still highly reactive to the same macro pressures hitting equities and bonds.
The bullish scenario is relatively clear. If CPI and PCE come in softer than feared, and if oil prices stop rising, Treasury yields and the U.S. dollar could ease. In that setup, markets would likely revive hopes for future rate cuts, financial conditions would feel less restrictive, and risk sentiment could improve. That would create a much friendlier environment for crypto, especially for Bitcoin, which remains the first asset investors tend to use when rebuilding risk exposure in digital markets. A softer inflation path would not guarantee a full bullish breakout, but it could support a stronger rebound and improve sentiment across the sector.
The bearish scenario is equally straightforward. If inflation stays sticky while oil remains elevated, markets are likely to continue pushing back expectations for Fed easing. That would keep the macro backdrop difficult for crypto. Higher yields and a firmer dollar tend to weigh on speculative and liquidity-sensitive assets, and crypto has already shown that it struggles in that environment. Under this scenario, Bitcoin would likely remain under pressure, while Ether and more aggressive altcoins could become even more fragile.
There is also a regulatory backdrop, although it appears secondary to macro conditions in the near term. In the United States, the Clarity Act remains stuck after renewed pushback from banks over stablecoin rewards and yield-bearing products. Traditional financial institutions argue that such incentives could draw deposits away from the banking system, while crypto firms argue that rewards are essential for user adoption and fair competition. This debate remains relevant for the medium-term structure of the crypto industry, especially around stablecoins and market access, but it does not appear to be the main price driver for the coming week. For now, macro dominates.
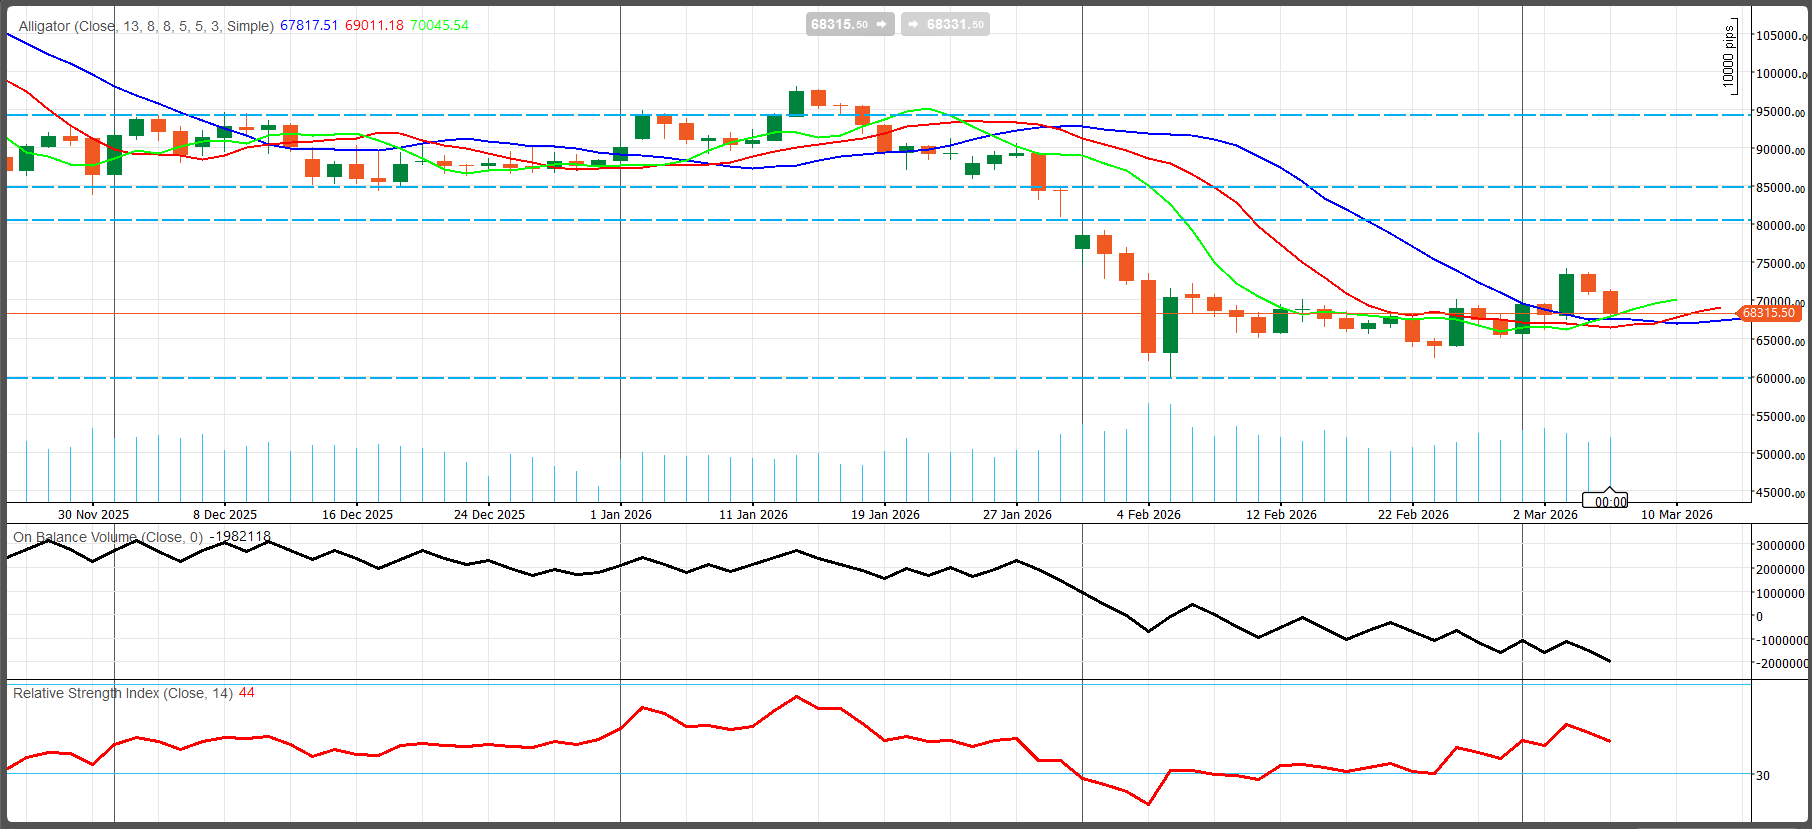
From a technical perspective, the Bitcoin daily chart still looks damaged rather than fully repaired. The market previously traded in a much higher range around 85,000 to 95,000, but the sharp break lower in late January and early February changed the regime. Since then, BTC has stopped falling aggressively and started to stabilize in a basing range around 65,000 to 70,000. This suggests that the market has moved from breakdown into consolidation, not yet into renewed trend expansion.
The short-term trend remains neutral to bearish. The previous higher-range bullish structure is broken, and the price is still trading well below major resistance zones. Rebounds have not yet produced a convincing sequence of higher highs, and the market remains close to important moving-average resistance. The Alligator indicator still reflects a corrective structure. Its lines are flattening, which usually signals that the sharp downtrend impulse has cooled and that the market is shifting into consolidation. However, that is not the same as a confirmed new uptrend.
Momentum indicators support that cautious reading. RSI near 44 shows that momentum is still weak and below the bullish threshold of 50, although it is not yet oversold. This means Bitcoin is not showing strong upside energy, but it also still has room to fall again if sellers return. More importantly, OBV remains under pressure, suggesting that accumulation is still not strong enough to confirm a durable recovery. This is one of the biggest technical warning signs on the chart.
The most important near-term zone is 68,000 to 70,000, which acts as the immediate pivot and first real recovery barrier. If BTC can reclaim and hold above that region, the technical picture would improve. On the downside, 65,000 is the first important support, followed by the major support at 60,000. If Bitcoin falls back below 60,000, the broader bearish structure would strengthen again. On the upside, key resistance levels sit at 80,000, then 85,000, and finally 95,000, which remains the major long-term recovery zone.
Overall, the crypto weekly outlook remains cautious. The market is recovering, but not cleanly. Bitcoin and Ether are stabilizing, yet they remain highly exposed to inflation data, oil prices, yields, and Fed expectations. Unless macro conditions become more supportive, crypto is likely to stay volatile, reactive, and vulnerable to another defensive phase.
Comments