 English
 پارسی



Whatch the Video
Global Economy Weekly Review — Resilient Markets, Fragile Growth, and Oil-Driven Policy Risk
The global economy ended the week with a split message: financial markets improved, but the macro backdrop became more fragile. The main driver was the U.S.-Iran conflict and its impact on oil, inflation expectations, bond yields, central-bank policy, and risk sentiment. Markets rallied when peace hopes improved and oil prices fell, but the underlying risk remains active because the Strait of Hormuz, Iran’s nuclear position, and U.S.-Iran negotiations are still unresolved.
The U.S. economy remained the strongest major economy. Growth signals were resilient, with the Atlanta Fed GDPNow estimate rising to 4.3% and the S&P Global Manufacturing PMI improving to 55.3. The labor market also stayed stable, as initial jobless claims fell to 209K. However, consumer sentiment weakened sharply, with the University of Michigan Consumer Sentiment index falling to 44.8, while inflation expectations rose to 4.8% for one year and 3.9% for five years. That made the U.S. picture strong, but increasingly inflation-sensitive.
Federal Reserve policy became one of the biggest global themes. The Fed minutes showed that policymakers are more open to rate hikes if inflation remains above the 2% target. Kevin Warsh was sworn in as the new Fed Chair at a time when markets are already pricing in a 25-basis-point rate hike by year-end. The U.S. dollar stayed near a six-week high around 99.24, supported by higher-rate expectations and safe-haven demand, although improved risk sentiment limited further upside.
Wall Street performed strongly. The S&P 500 posted its eighth straight weekly gain, the Dow Jones closed at a record 50,579.70, and the broader market was supported by lower oil prices, easing yields late in the week, and strong earnings. Nvidia’s report confirmed that AI infrastructure demand remains powerful, but valuation concerns also became more visible. The U.S. remains the clear leader in the global equity story because of AI exposure, energy resilience, and stronger earnings momentum.
Europe looked much weaker from a macro perspective. The eurozone’s Composite PMI fell to 47.5, with services dropping to 46.4, signaling contraction across private-sector activity. France was especially weak, with its Services PMI falling to 42.9, while Germany showed stabilization but not real strength. German GDP grew 0.3% QoQ and the Ifo index improved, but German PMI data remained in contraction. European equities still rose, helped by technology stocks and Iran peace hopes, but Europe remains more exposed than the U.S. to oil shocks and energy-driven inflation.
The UK also weakened. The sharp fall in Services PMI to 47.9 and Composite PMI to 48.5 showed that the UK private sector moved into contraction. Retail sales disappointed badly, with monthly retail sales falling 1.3%, while public borrowing jumped to £24.30B. Higher gilt yields added another pressure point. The UK economy therefore looks fragile, with weak consumer demand and rising fiscal concerns weighing on GBP sentiment.
China showed a selective recovery rather than broad strength. The PBOC kept the 1-year LPR at 3.00% and the 5-year LPR at 3.50%, confirming a cautious policy stance. Domestic demand remains soft, but AI-linked companies performed well. Lenovo reported record annual revenue of $83.1B, with AI-related revenue rising 105% and accounting for one-third of group revenue. China’s equity market improved, but the macro story remains uneven: technology is strong, while consumption and industrial momentum remain fragile.
Japan’s economy sent a mixed signal. Inflation cooled more than expected, with National Core CPI slowing to 1.4% YoY, below the BoJ’s 2% target. However, the decline was partly driven by subsidies, so expectations for a possible BoJ rate hike remain alive. The yen weakened back above 159 per dollar, keeping intervention risk near 160. Japanese equities rallied strongly, with the Nikkei 225 rising more than 2.5% on Friday and nearly 3% for the week, supported by AI-linked optimism and SoftBank gains.
Emerging economies were mixed. India remained strong on growth, with Services PMI at 58.9, but the rupee stayed under pressure and FX reserves fell to $688.89B. Indonesia’s external position weakened as the current-account deficit widened and the balance of payments dropped sharply. Turkey showed better manufacturing confidence and exports, but tourism weakened and reserves remained a mixed signal. South Korea benefited from AI and chip-sector strength, while the won stayed under pressure. Overall, emerging markets remain vulnerable to a strong dollar, high U.S. yields, and oil volatility.
Commodities were dominated by the Iran conflict. Oil prices swung sharply as peace hopes rose and ships reportedly crossed the Strait of Hormuz under Iranian supervision. Late Friday, Brent traded around $103.20 and WTI around $96.28, both heading for steep weekly losses. Lower oil helped risk sentiment, but the market remains highly sensitive to weekend headlines. Gold weakened, with spot gold falling to around $4,509/oz, as rate-hike expectations outweighed safe-haven demand.
Overall Assessment
The global economy is not collapsing, but it is becoming more fragile. The U.S. remains resilient and market-leading, Europe and the UK are losing momentum, China is recovering selectively through AI and technology, Japan is caught between softer inflation and yen weakness, and emerging markets remain exposed to external pressure.
The central macro theme is now clear: oil is driving inflation expectations, inflation expectations are driving central-bank pricing, and central-bank pricing is driving currencies, bonds, equities, and gold.
If U.S.-Iran diplomacy succeeds and oil prices continue falling, global equities could extend their relief rally, especially in Europe and emerging markets. If talks fail and the Hormuz risk premium returns, the next move could be higher oil, stronger inflation expectations, higher yields, a stronger dollar, weaker gold-adjusted risk appetite, and renewed pressure on global equities.
Global Weekly Economic Outlook — May 25–30, 2026
Markets are still dealing with a difficult macro mix: sticky inflation, weaker consumer demand, high energy prices, and geopolitical risk. This is not a clean risk-on environment. Investors are waiting to see whether inflation remains too strong for central banks to ease policy, or whether demand is weakening fast enough to reduce the pressure on interest rates. For global markets, the most important event of the week is the U.S. data package on Thursday, May 28. The release includes April PCE inflation, Core PCE, personal income, personal spending, and the Q1 GDP second estimate. Because PCE is the Federal Reserve’s preferred inflation gauge, this report can directly affect expectations for Fed policy, Treasury yields, the U.S. dollar, equities, gold, crypto, and emerging-market risk appetite.
U.S. Outlook: PCE Inflation Will Drive the Global Market Reaction
The U.S. remains the most important market driver this week. A hot PCE inflation or Core PCE print would likely support the U.S. dollar and Treasury yields. That would be negative for Wall Street, gold, crypto, and emerging-market assets because higher yields usually reduce appetite for risk.
If the inflation data come in softer while personal spending remains stable, the reaction could be more positive. Lower inflation pressure would reduce the need for a more hawkish Fed stance, while stable spending would suggest the U.S. economy is slowing but not collapsing.
The key question is simple: can the U.S. economy keep growing without creating more inflation pressure? If the answer is yes, risk assets may recover. If the answer is no, the market may return to defensive macro trading.
Europe Outlook: Stagflation Risk Remains the Main Problem
Europe enters the week with a fragile macro setup. Growth is weak, but inflation pressure remains alive because of high energy costs. This keeps the euro area exposed to stagflation risk, where economic activity slows while inflation stays uncomfortable.
The key European release is the EU Economic Sentiment Indicator on May 27. This will show whether businesses and consumers are becoming more cautious. Weak sentiment would confirm that Europe’s growth outlook remains under pressure.
The next major test comes on May 29, when Germany releases preliminary May CPI and France publishes provisional May CPI/HICP. These inflation figures will matter for the European Central Bank because another sticky inflation reading could make it harder for policymakers to shift toward a more dovish position.
For European markets, the risk is clear: weak growth plus persistent inflation is not a strong environment for equities. It can also create volatility in the euro and European bond markets.
China Outlook: Weak Demand Is Still the Central Story
China remains a weak-demand story. Recent April data showed slower industrial output, very weak retail sales, and falling fixed-asset investment. That combination shows that China’s recovery remains uneven and not yet strong enough to create a broad global growth impulse.
The next focus will be industrial profits. Markets will watch whether corporate margins are under pressure from weak demand, softer pricing power, and slower investment activity.
For global investors, China matters because weak Chinese demand can weigh on commodities, Asian equities, and global trade expectations. If industrial profits disappoint, it would reinforce the view that China’s recovery is still selective rather than broad-based.
Japan Outlook: Inflation and Activity Data Matter for the Bank of Japan
Japan will also be important this week through inflation and activity signals. Markets will watch Tokyo CPI, unemployment, retail sales, and industrial production.
The Bank of Japan remains in a difficult position. Inflation pressure has not fully disappeared, but domestic demand is still fragile. Japan’s March industrial production was revised to -0.4% MoM and +2.4% YoY, showing some resilience but not a strong industrial cycle.
If Tokyo CPI remains firm, markets may increase expectations that the Bank of Japan will stay cautious about easing policy. However, weak retail sales or industrial data would show that the real economy is still not strong enough to absorb aggressive policy tightening.
USA
The week is not about the number of events; it is about one question: does the U.S. still have strong growth with sticky inflation, or is the consumer finally starting to weaken? Thursday’s PCE, GDP, and spending data should give the clearest answer.
U.S. Economy Weekly Review: Resilient Growth Meets Inflation Risk
The U.S. economy ended the week with a resilient but more inflation-sensitive profile. Growth indicators stayed firm, financial markets recovered, and corporate earnings continued to support risk appetite. However, the macro picture became more complicated as Middle East tensions, high oil prices, rising inflation expectations, and a more hawkish Federal Reserve outlook reshaped market expectations.
The strongest signal came from growth and business activity. The Atlanta Fed GDPNow estimate for Q2 increased to 4.3%, up from 4.0%, showing that near-term momentum remains solid. The S&P Global Manufacturing PMI rose to 55.3, beating expectations and pointing to stronger factory activity. The Composite PMI stayed in expansion at 51.7, while the Services PMI softened to 50.9 but avoided contraction. This mix suggests the economy is slowing in parts, but not breaking.
Regional manufacturing data were less encouraging. The Philadelphia Fed Manufacturing Index dropped sharply to -0.4, while the Kansas City Fed Manufacturing Index eased to 9 from 10. These figures show a gap between stronger national surveys and weaker regional signals. The message is not recessionary, but it confirms that industrial momentum remains uneven.
The labor market remained one of the economy’s strongest supports. Initial jobless claims fell to 209K, and the four-week average declined to 202.5K. Continuing claims rose slightly to 1.782M, but stayed below forecast. This still points to a stable employment backdrop, helping consumption and reducing near-term recession risk.
Housing also delivered a mixed but acceptable picture. Building permits rose to 1.442M, while permits increased 5.8% MoM after a previous decline. Housing starts beat expectations at 1.465M, although monthly starts fell 2.8%. The sector is not showing broad weakness, but higher Treasury yields remain a clear risk.
The biggest concern came from consumers and inflation expectations. The University of Michigan Consumer Sentiment Index fell to 44.8, while 1-year inflation expectations climbed to 4.8% and 5-year expectations rose to 3.9%. This matters because rising long-term inflation expectations can force the Fed to stay restrictive for longer.
Fed policy became the key market theme. The April Fed minutes showed that many policymakers believe rate hikes may become appropriate if inflation stays above the 2% target. Markets are now pricing a 25-basis-point rate hike by year-end. Bond yields also moved sharply higher, with the 10-year yield reaching levels not seen in more than a year and the 30-year yield touching levels last seen in 2007.
The U.S. dollar stayed supported, with the Dollar Index near 99.24, close to a six-week high. Rate-hike expectations, safe-haven demand, and U.S. energy resilience helped the dollar. However, improving U.S.-Iran diplomacy limited stronger upside.
Equities still performed well. The S&P 500 rose 0.9% for the week, the Nasdaq gained 0.5%, and the Dow climbed 2.1%. The Dow closed at a record 50,579.70, while the S&P 500 posted its eighth straight weekly gain. Nvidia’s strong revenue and guidance reinforced the AI investment story, although valuation concerns above the $5 trillion market-cap zone limited enthusiasm.
Energy remained the main external shock. WTI traded near $96.28, while Brent was around $103.20. Lower oil helped equities, but the risk remains unresolved. Gold weakened to $4,509.12/oz, as higher real yields and hawkish Fed expectations outweighed safe-haven demand.
Overall, the U.S. economy remains stronger than many global peers, supported by growth, jobs, AI leadership, and corporate earnings. But strength also gives the Fed less reason to cut rates. The market outlook is therefore split: equities can keep rising if oil and yields cool, while the dollar and Treasury yields may stay supported if inflation expectations remain elevated.
U.S. Weekly Economic Outlook: Inflation, GDP, and the Consumer Take Center Stage
The U.S. economy enters the week of May 25–30 with one clear macro tension: growth is still holding, but inflation pressure, high energy costs, weak consumer sentiment, and “higher-for-longer” Federal Reserve expectations remain the key market drivers. The week starts quietly because of the Memorial Day holiday on Monday, May 25, when U.S. equity and bond markets are closed and no major economic data are scheduled.
The main event comes on Thursday, May 28, when markets receive a heavy package of U.S. data, including April PCE inflation, Core PCE, personal income and spending, the Q1 GDP second estimate, durable goods orders, weekly jobless claims, and new home sales. This will be the most important day of the week because it combines inflation, growth, consumption, housing, and labor-market signals in one session.
The key report is PCE inflation, the Federal Reserve’s preferred inflation gauge. Markets will focus on whether April inflation confirms renewed pressure from energy prices and whether core inflation remains too sticky for the Fed to shift toward a dovish stance. Forecasts cited from BofA point to headline PCE rising 0.4% MoM and 3.8% YoY, while Core PCE is expected at 0.3% MoM and 3.3% YoY. Both remain clearly above the Fed’s 2% inflation target, keeping policy risk tilted hawkish.
Consumer spending is another major focus. Retail activity carried some momentum into April, supported by a 0.5% gain in control group retail sales, which exclude gas, autos, building materials, and restaurants. This suggests goods spending started the second quarter on a decent footing. However, the consumer backdrop is becoming more difficult. Higher prices are eroding real purchasing power, and the conflict in Iran has kept energy costs elevated. If nominal spending rises but inflation absorbs most of that gain, real consumption momentum could weaken.
Personal income will also matter. Expectations point to broad personal income rising 0.4%, but real income growth may remain weak if the PCE deflator also rises 0.4%. That combination would suggest households are still spending, but with less real financial flexibility. A cooling labor market and slower wage growth add to the risk that consumer strength may not be sustainable.
Housing data will add another important layer. New home sales improved in March to 682K, a 3.3% YoY gain, but the market remains soft beneath the surface. Builders continue to use incentives such as mortgage-rate buy-downs and price cuts to protect demand. The median new home price fell 6.2% YoY, while available inventory stayed high at 481K. For April, new home sales are expected to fall back to 669K, partly because mortgage rates are hovering near 6.5% and affordability remains stretched.
The calendar is straightforward. Tuesday brings the S&P CoreLogic Case-Shiller Home Price Index and Conference Board Consumer Confidence. Wednesday focuses on Fed speakers, including Lorie Logan, Philip Jefferson, and Austan Goolsbee. Thursday is the main macro day. Friday brings the advance trade balance, wholesale inventories, Chicago PMI, and more Fed commentary.
My base case is that the U.S. economy will show resilience, but with rising stagflation risk. A hot PCE print combined with firm spending would support the U.S. dollar and Treasury yields, while pressuring Wall Street, gold, and rate-sensitive sectors. A softer inflation print with cooling but stable consumer data could improve risk appetite. Still, consumer sentiment remains fragile, with the University of Michigan’s final May reading at 44.8, down from 49.8 in April.
USD and Wall Street Weekly Outlook: PCE Will Test the Rally
The U.S. dollar and Wall Street enter the week of May 25–30 with strong momentum, but the same risk: Thursday’s inflation and growth data could decide whether recent trends extend or reverse. The dollar remains supported by higher rate expectations, elevated Treasury yields, and inflation risk, while equities are still constructive after another powerful weekly advance. However, after an eight-week rally in the S&P 500 and a record Dow close, the risk-reward for stocks is more fragile.
The U.S. Dollar Index held near 99.24, close to a six-week high. The dollar did not break sharply higher, but its resilience was important because risk appetite improved across equities. Normally, stronger equity sentiment can weaken safe-haven demand, but this time the Fed story kept the dollar supported. The April Fed minutes showed that most policymakers could support rate hikes if inflation remains above the 2% target, pushing markets toward pricing a 25-basis-point hike by year-end.
Kevin Warsh’s arrival as Fed Chair also kept policy direction in focus. Inflation pressure remains too high, Core PCE is still around 3.2% YoY, and energy-related price risks remain active. Bond markets reinforced this message, with the 10-year Treasury yield recently reaching levels not seen in more than a year and the 30-year yield touching levels last seen in 2007.
Wall Street finished the week strongly. The S&P 500 rose 0.4% on Friday to 7,472.73, the Nasdaq gained 0.2% to 26,343.97, and the Dow climbed 0.6% to a record 50,579.70. For the week, the S&P 500 gained 0.9%, the Nasdaq advanced 0.5%, and the Dow outperformed with a 2.1% rise. The S&P 500 also posted its eighth straight weekly gain, while Wall Street has risen around 17% during the eight-week rally.
The main support came from lower oil, softer yields late in the week, earnings strength, and optimism around U.S.-Iran talks. WTI traded near 96.28, while Brent was around 103.20, both heading for steep weekly losses. Lower oil reduced fears that the Middle East conflict would force more aggressive central-bank tightening.
Corporate earnings also helped sentiment. Nvidia delivered strong results and guidance, confirming that AI infrastructure demand remains powerful. Still, the stock reaction was muted because investors questioned whether a valuation above the 5 trillion market-cap area already reflects much of the AI boom. Strong reactions in Workday, Zoom, Ross Stores, and Estee Lauder showed investors are still rewarding earnings quality, but Take-Two’s weaker move proved the market remains selective.
The week ahead is all about Thursday, May 28. The U.S. releases April PCE inflation, Core PCE, personal income, personal spending, the Q1 GDP second estimate, corporate profits, durable goods orders, jobless claims, and new home sales. If Core PCE stays firm while spending and GDP remain resilient, the dollar could extend higher because markets would price a more hawkish Fed path. If PCE softens and growth cools without collapsing, yields may fall, helping equities and weakening the dollar.
Tuesday’s Consumer Confidence report also matters because the University of Michigan survey already showed sentiment falling to 44.8 from 49.8 in April. A further decline would question the strength of consumption. Friday’s trade, inventories, Chicago PMI, and Fed comments will shape final weekly positioning.
My outlook is USD Neutral-to-Buy and Wall Street constructive but vulnerable. The Dow has positive momentum, the S&P 500 remains bullish but extended, and the Nasdaq is supported by AI demand but sensitive to yields. The main risks are an oil rebound, higher Treasury yields, or failed U.S.-Iran talks. The main supports are strong earnings, AI demand, lower oil, and stable growth data.
USD Technical Analysis
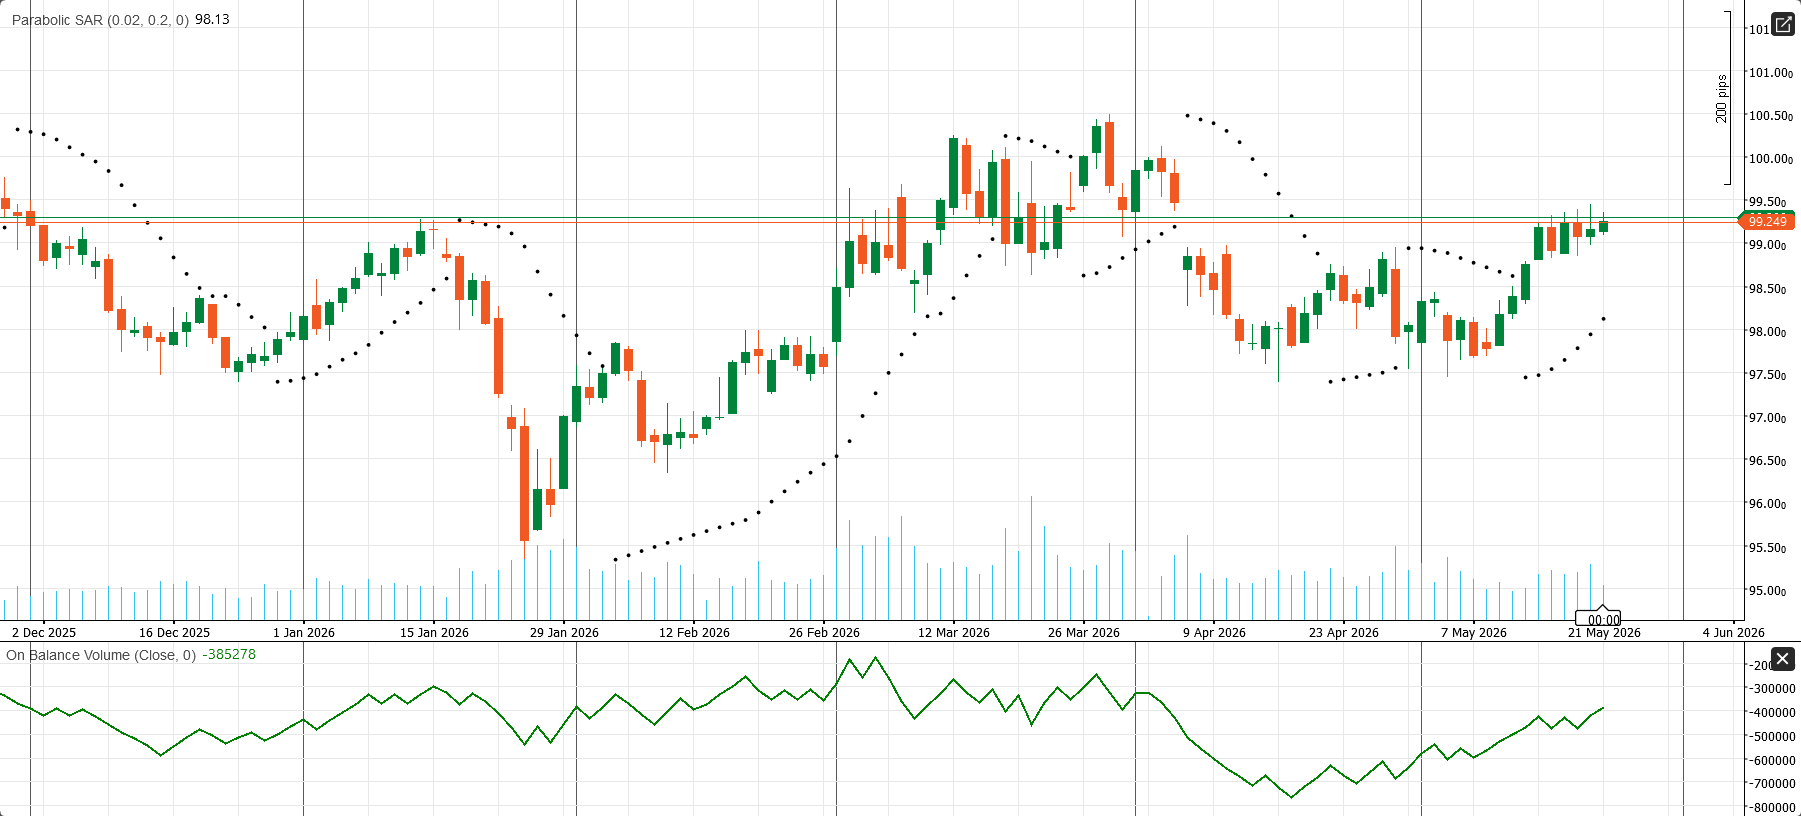
The daily U.S. Dollar Index (DXY) chart has improved and now shows a constructive recovery structure. Price is trading around 99.249, while the Parabolic SAR stands near 98.13 and remains below price. That alignment tells me the short-term trend has turned supportive again and that buyers still hold the near-term edge.
From a price-structure perspective, the index has recovered from the early-May base and pushed back into the upper part of its recent range. The immediate resistance zone is now 99.25–99.50. A clean daily close above 99.50 would strengthen the bullish continuation case and open room toward 100.00 first, followed by 100.50. On the downside, the first support sits near 98.80, while the more important technical floor remains around the Parabolic SAR near 98.13. If DXY falls back below that area, the recovery structure would weaken materially.
The supporting indicators also lean constructive. On-Balance Volume has improved from the deeper April–May lows and is recovering toward the -385,278 area, which suggests selling pressure has eased and accumulation is improving. In practical terms, this is a firmer daily chart, but it still needs a confirmed break through 99.50 to shift from recovery into a stronger directional bullish move.
S&P 500 Technical analysis
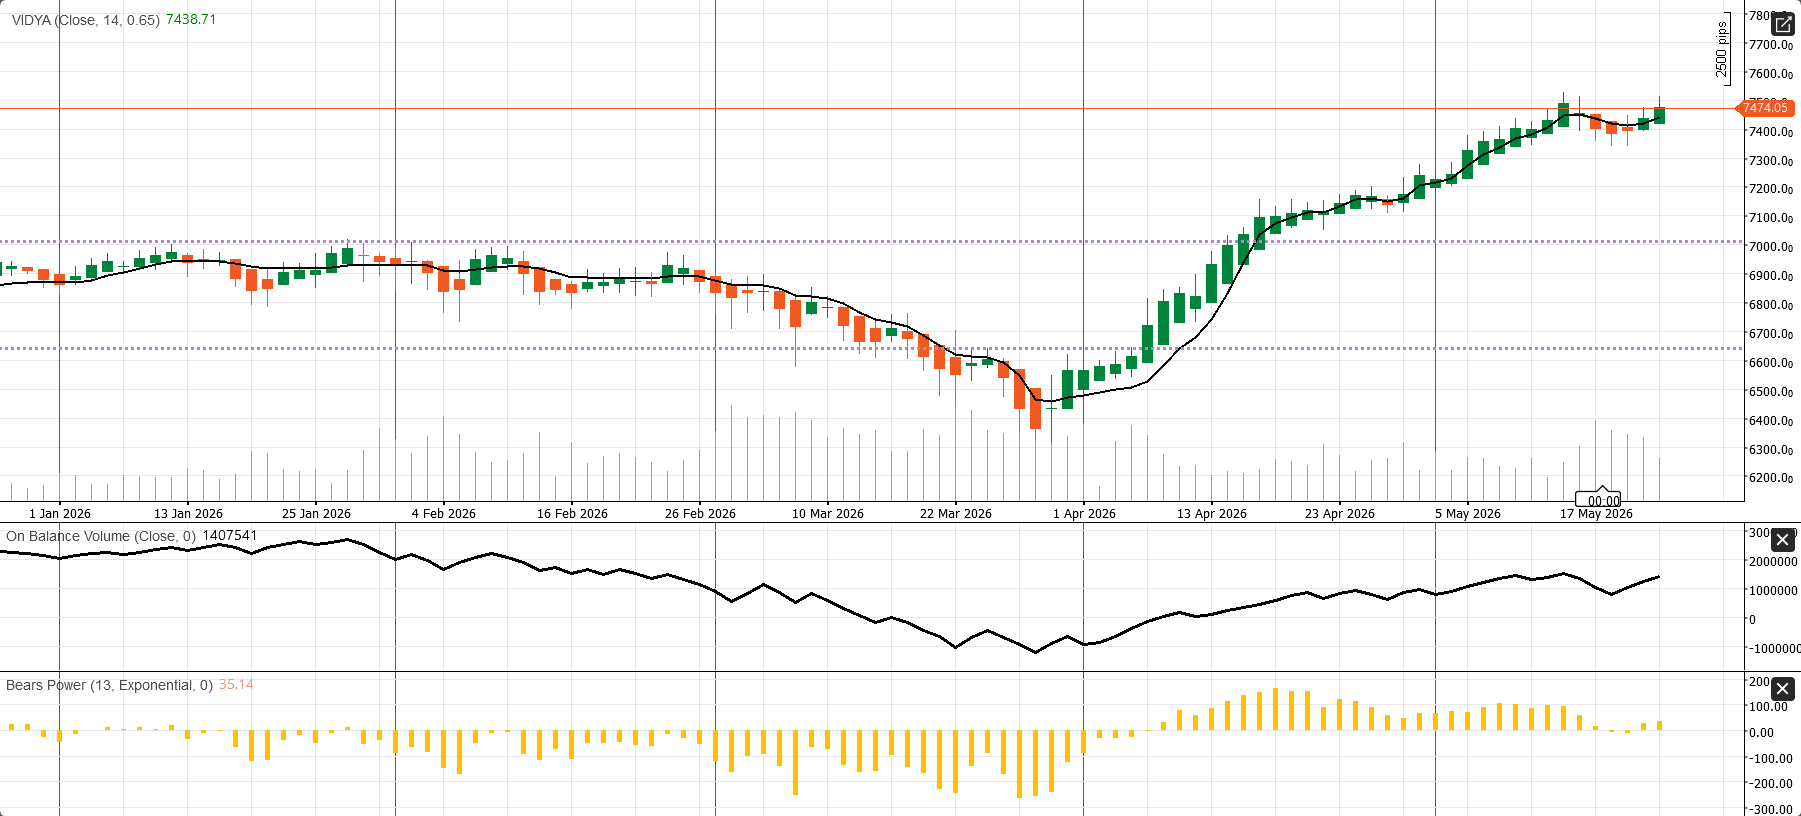
The daily S&P 500 / US500 chart remains constructive. Price is trading around 7,474.05, slightly above the VIDYA line at 7,438.71, which shows that the medium-term trend is still pointing higher. The rebound from the late-March low has been strong and orderly, and the market has continued to print higher highs and higher lows into May.
The key issue now is extension, not direction. Price is pressing the immediate resistance zone around 7,474, which is the local breakout ceiling on this chart. As long as the index stays above the 7,438–7,440 trend support area, bulls remain in control. A clean daily break above 7,474 would expose the next upside zones near 7,550 and then 7,650. On the downside, the first meaningful support comes in around 7,200, followed by the broader support band near 6,650.
The supporting indicators are positive, but they also show that the rally is no longer early. On-Balance Volume is still trending higher, which confirms that the advance has been backed by improving participation. Bears Power remains positive near 35.14, meaning sellers have not taken control back, but the indicator has cooled from stronger levels, which suggests upside momentum is still intact yet less explosive than in the first leg of the rebound.
EU
For the week of May 25–30, the EU outlook is Neutral-to-Defensive. Europe is facing a difficult mix of weak growth and sticky energy-driven inflation. The two key dates are May 27 for sentiment and May 29 for Germany and France inflation. Until the data show either lower inflation or stronger demand, the European macro story remains fragile, and markets should treat rallies in European risk assets with caution.
EU Economic Review: Weak PMIs Expose Europe’s Growth Risk
The EU economy ended the week with a weaker growth profile, as the latest data showed fading private-sector momentum, deeper services contraction, softer external-account support, and fragile business confidence. At the same time, European equities performed better than the macro data suggested, supported by AI-linked technology strength and optimism around U.S.-Iran diplomacy. This created a clear split between the economic outlook and market sentiment.
The most important signal came from eurozone PMI data. Manufacturing PMI fell to 51.4, below the 51.7 forecast and down from 52.2, but it still remained above the 50 expansion line. The bigger concern was services. Services PMI dropped to 46.4, below the 47.8 forecast and previous 47.6, while the Composite PMI fell to 47.5. This confirms that eurozone private-sector activity is contracting, with services leading the slowdown.
Germany looked more stable than the broader eurozone, but not strong. Q1 GDP confirmed a modest recovery, rising 0.3% QoQ and 0.4% YoY, beating the annual forecast. German consumer sentiment also improved, with the GfK Consumer Climate Index rising to -29.8, while the Ifo Business Climate Index increased to 84.9. However, Germany’s PMI data remained weak. Manufacturing slipped to 49.9, services improved to 47.8, and the composite index rose to 48.6. This means Germany is stabilizing, but still operating in contraction territory.
France delivered the weakest signal of the week. Manufacturing PMI fell to 48.9, while Services PMI collapsed to 42.9, far below expectations. The Composite PMI dropped to 43.5, showing a deep private-sector contraction. The only positive French signal came from the business survey, which improved to 102, but that was not enough to offset the sharp deterioration in services activity.
The eurozone’s external position also weakened. The current account surplus fell to 14.9B, below the 26.3B forecast and down from 25.6B previously. This matters because the eurozone usually benefits from external-account support, but a smaller surplus reduces that cushion at a time when energy prices, geopolitical risk, and weak demand are already pressuring the region.
There were some limited positives. Eurozone construction output rose 0.78% MoM, recovering from the previous 0.77% decline. Labor costs stayed at 3.30% YoY, showing wage pressure is still present but not accelerating. Consumer confidence improved to -19.0, better than the -21.0 forecast and previous -20.6. Still, sentiment remains clearly negative, so this should be viewed as stabilization rather than real strength.
The bond market remains a risk. Spain’s 7-year bond auction yield rose to 3.164%, while broader European yields faced pressure from inflation concerns and energy-market uncertainty. This creates a difficult setup for the ECB: growth is weakening, but oil-related inflation risk remains active, especially if Persian Gulf tensions return.
European equities had a better week. The STOXX 600 closed at 625.12, up 0.73% on Friday. Germany’s DAX gained 1.15%, France’s CAC 40 rose 0.37%, and the UK’s FTSE 100 also moved higher. Technology stocks benefited after Nvidia’s outlook strengthened confidence in AI infrastructure demand, supporting chip-linked names such as ASML, Infineon, and STMicroelectronics.
Overall, the EU economy looks fragile and growth-negative. The euro remains Neutral-to-Sell, pressured by weak PMIs, softer external support, and energy exposure. European equities are Neutral, but could shift to Buy only if oil falls and U.S.-Iran peace progress becomes credible. The key risk remains energy: lower oil could trigger a relief rally, while renewed Persian Gulf stress could expose Europe’s weak growth base quickly.
Europe Weekly Economic Outlook: Stagflation Risk Becomes the Main Market Story
The EU and euro area enter the week of May 25–30 in a Neutral-to-Defensive macro condition. The central issue is no longer only weak growth. Europe now faces a more difficult mix of higher energy-driven inflation, weaker demand, soft business activity, fragile consumer sentiment, and a more complicated ECB policy path. This is why stagflation risk has become the main European story for markets.
The latest outlook is clearly uncomfortable. EU officials have warned that Europe is facing a stagflationary trend after the energy-price shock linked to the Iran war. At the same time, the European Commission now expects euro area growth to slow to 0.9% in 2026, while inflation is projected to rise to 3.0%, above the ECB’s 2% target. That combination is negative for confidence, purchasing power, corporate margins, and policy flexibility.
The weakness is already visible in business activity. The Flash Euro Zone Composite PMI fell to 47.5 in May, its lowest level since October 2023 and clearly below the 50 expansion line. Services activity contracted at the sharpest pace since February 2021, while new orders weakened and cost pressures intensified because of higher energy and living costs. This matters because Europe is more exposed than the U.S. to imported energy shocks. If oil and gas prices stay elevated, the pressure can spread into transportation, production costs, food prices, and household spending.
This creates a difficult problem for the ECB. Inflation risk argues for tighter policy, but weak growth argues for caution. The ECB kept rates unchanged on April 30, with the deposit facility rate at 2.00%, the main refinancing rate at 2.15%, and the marginal lending facility at 2.40%. However, policymakers also acknowledged that upside inflation risks and downside growth risks have intensified because of the Middle East war and energy shock.
The week starts quietly on Monday, May 25, with Whit Monday affecting several European countries, although Euronext and Frankfurt are scheduled for regular trading. Liquidity may be thinner, so energy prices, geopolitical headlines, and bond-market moves could have an outsized impact. On Tuesday, markets should continue watching oil, gas, ECB commentary, and whether European yields price a more hawkish path or begin to reflect weaker growth.
Wednesday brings the EU and euro area Economic Sentiment Indicator and Business and Consumer Survey results for May. This is important because April sentiment was already weak, with the EU ESI at 93.5 and the euro area ESI at 93.0, both below the long-term average of 100. A further decline would confirm that confidence is deteriorating across businesses and consumers.
Thursday will be driven partly by U.S. data, especially PCE inflation, GDP, income, spending, and corporate profits. A hot U.S. inflation print could strengthen the dollar, push global yields higher, and pressure European equities. Friday is Europe’s key inflation day, with Germany and France releasing preliminary May CPI and HICP data. Sticky inflation in both economies would increase the risk of more hawkish ECB pricing.
Germany remains the key domestic test. The Ifo business climate index rose to 84.9 from 84.5, Q1 GDP was confirmed at 0.3%, and consumer sentiment improved to -29.8 from -33.1. But the recovery remains fragile. France matters mainly through inflation, especially after April price pressure accelerated.
For markets, the euro outlook is mixed. Higher inflation may support EUR through a more hawkish ECB path, but weak PMIs and recession risk limit upside. European equities face a defensive setup: weak activity, high energy costs, and higher yields are not equity-friendly. Bund yields could rise if German and French inflation surprise higher, while peripheral spreads may become more sensitive to fiscal risk.
EURUSD Technical Analysis
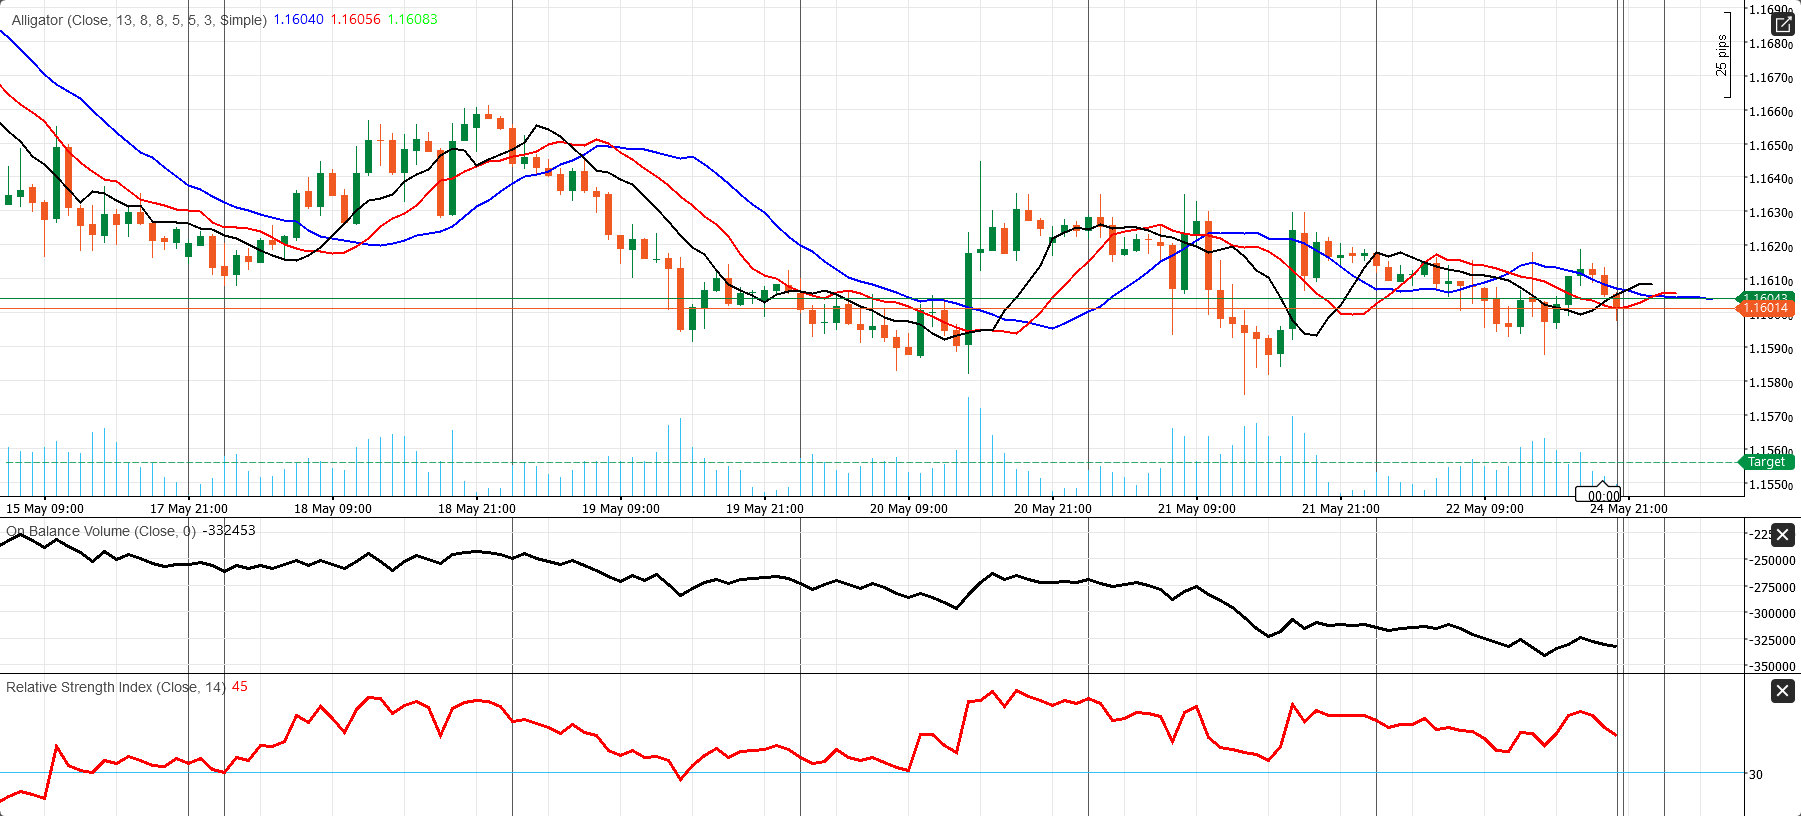
The EUR/USD chart shows a compressed and fragile structure. Price is trading around 1.16014, almost exactly inside the Alligator cluster, with the jaw at 1.16040, the teeth at 1.16056, and the lips at 1.16083. When price trades inside a tightly compressed Alligator structure, it usually signals a market that is losing directional momentum and is close to a breakout decision.
At the moment, the bias is slightly negative. Price is sitting below the faster Alligator lines, while the market has struggled to build a clean move above the 1.1610–1.1615 area. That keeps the immediate resistance zone around 1.1608–1.1615, followed by 1.1625–1.1630. On the downside, the first support is the psychological 1.1600 level, then 1.1585, and after that the broader downside zone near 1.1560.
The secondary indicators also support a cautious view. On-Balance Volume remains negative and still trends weakly lower, which suggests the latest rebound has not been confirmed by strong accumulation. RSI is near 45, below the neutral 50 line, which tells me bullish momentum is limited. In practical terms, the chart does not show a strong trend breakout yet, but it does favor selling weakness unless EUR/USD can reclaim and hold above 1.1615.
Gold Weekly Outlook: Fed Pressure Keeps XAU/USD Defensive Before PCE
Gold enters the week of May 25–30 in a Neutral-to-Defensive condition, with the market caught between two powerful forces: geopolitical safe-haven demand and rising rate-hike pressure. The broader bullish structure is not fully broken, but short-term momentum has weakened because the U.S. dollar remains firm, Treasury yields are elevated, and sticky inflation expectations are keeping the Federal Reserve story hawkish.
Spot gold ended the previous week near $4,509.12/oz, down 0.8% on Friday and on track for a 0.7% weekly loss. Gold futures also fell 0.7% to around $4,510.70/oz, heading for a 1.1% weekly decline. This was not a major bearish breakdown, but it showed that gold struggled to attract strong upside momentum even while the U.S.-Iran conflict remained unresolved.
The main pressure came from interest-rate expectations. The Federal Reserve’s April minutes showed that more policymakers were open to rate hikes if inflation stays above the 2% target. At the same time, U.S. inflation expectations moved higher, with the University of Michigan’s 1-year inflation expectation rising to 4.8% and the 5-year expectation jumping to 3.9%. This is important for gold because rising inflation expectations can push markets to price tighter monetary policy, especially when the labor market and consumption are not collapsing.
Real yields were the most damaging factor. The U.S. 10-year TIPS auction yield rose sharply to 2.169% from 1.896%, confirming tighter real-rate conditions. Gold does not pay income, so when real yields rise, the opportunity cost of holding gold increases. This explains why safe-haven demand was not strong enough to push prices higher.
The dollar also remained a headwind. The U.S. Dollar Index held near 99.24, close to a six-week high, supported by Fed-hike expectations and safe-haven demand. A stronger dollar usually pressures gold because it makes the metal more expensive for non-dollar buyers. However, the dollar did not surge because improving U.S.-Iran diplomacy reduced some demand for defensive assets.
Geopolitics created two-way volatility. Early in the week, gold found support from uncertainty around the Iran war, the Strait of Hormuz, and the risk of escalation. Later, reports of progress in U.S.-Iran talks and ships passing through Hormuz under Iranian supervision reduced the immediate war-risk premium. That shift weakened safe-haven demand and helped push gold lower.
Oil remains central to the gold outlook. Brent traded near $103.20, while WTI was around $96.28 late Friday, both heading for steep weekly losses. Lower oil reduced inflation panic and supported equities, but it also reduced urgent safe-haven buying in gold. Still, oil is the key risk variable. If talks fail and crude rebounds, inflation expectations could rise again, and gold could quickly regain support.
Technically, gold is correcting, not collapsing. The key support zone is $4,480–$4,500/oz. A sustained break below this area would weaken the short-term structure and open the door to deeper profit-taking. On the upside, gold needs to reclaim $4,560–$4,600/oz to rebuild bullish momentum. Without either a decline in yields or a fresh geopolitical shock, upside may remain limited.
The most important event this week is Thursday, May 28, when the U.S. releases April PCE inflation, Core PCE, personal income, personal spending, the Q1 GDP second estimate, durable goods, jobless claims, and new home sales. PCE matters most because it is the Fed’s preferred inflation gauge. If Core PCE stays hot and spending remains resilient, markets may price a more hawkish Fed path. That would likely support the dollar and Treasury yields, putting renewed pressure on XAU/USD.
The day-by-day focus is clear. Monday is quieter because U.S. markets are closed for Memorial Day, so gold may respond mainly to geopolitical headlines. Tuesday’s Consumer Confidence report will test whether households are weakening. A weak reading could support gold through defensive demand, while a strong number could support yields. Wednesday may bring consolidation before the main inflation event. Thursday is the key trading day, and Friday will be used to digest the PCE reaction alongside trade, inventory, Chicago PMI, and Fed commentary.
The trading scenarios are straightforward. A hot Core PCE + strong spending outcome would be bearish for gold and could trigger a retest of $4,480–$4,500. A softer PCE + stable spending outcome would be the best bullish setup, potentially pushing gold toward $4,560–$4,600. A weak spending + weak GDP revision outcome could create mixed price action at first, but safe-haven demand may support gold if recession fears rise.
Overall, gold remains structurally supported by geopolitical risk, inflation uncertainty, and defensive portfolio demand. But in the short term, monetary policy pressure is winning. The market condition is Neutral-to-Defensive, and the bias remains Neutral, with downside risk if PCE confirms sticky inflation.
Gold Technical Analysis
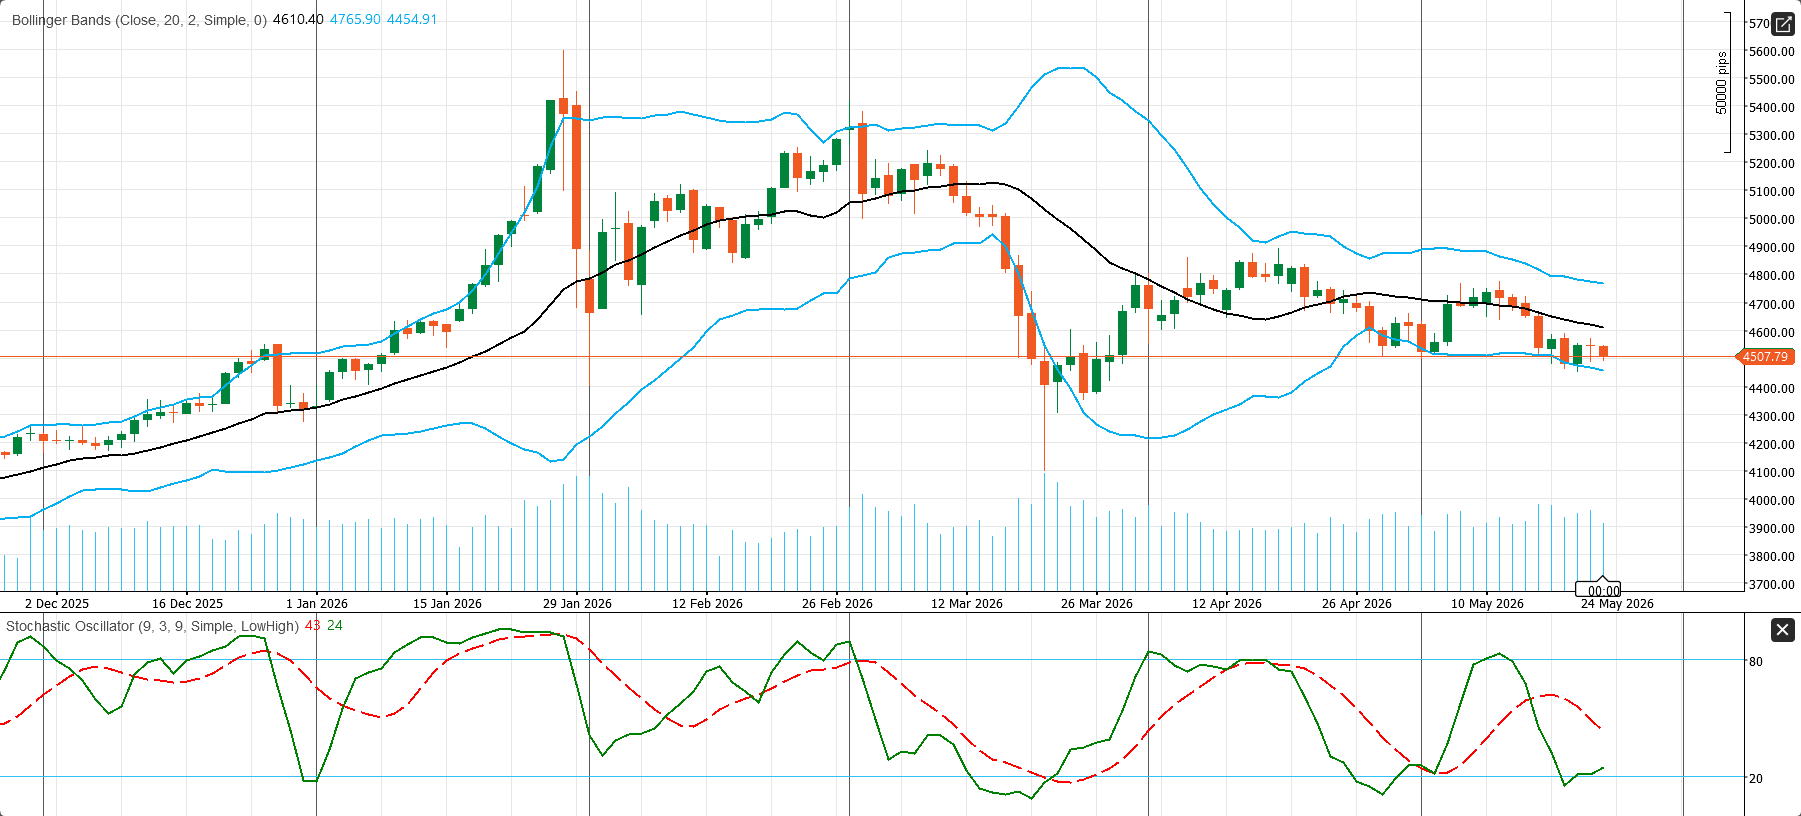
The daily XAU/USD chart remains under pressure. Price is trading around 4,507.79, below the Bollinger middle band at 4,610.40, while the upper band stands at 4,765.90 and the lower band at 4,454.91. This positioning shows that gold is trading in the lower half of its volatility range, which keeps the short-term structure tilted to the downside.
From a price-structure perspective, the market has failed to reclaim the mid-band and is now hovering just above the lower Bollinger support. That makes 4,454.91 the immediate technical floor. A decisive daily break below that area would strengthen the bearish continuation case and expose the next downside zone around 4,400. On the upside, the first recovery barrier remains the 4,610.40 mid-band, and above that the broader resistance zone comes in near 4,765.90.
Momentum is trying to stabilize, but it is not strong yet. The stochastic oscillator is around 43/24, with the fast line above the signal line, which suggests a rebound attempt from weak levels. Even so, as long as price remains below the Bollinger mid-band, that recovery still looks corrective rather than trend-changing. In practical terms, this is a weak daily chart with bounce risk, not a confirmed bullish reversal.
Energy Market Weekly Outlook: WTI Remains a Geopolitical Trade as Hormuz Risk Controls Oil Prices
The energy market enters the week of May 25–30 in a Neutral-to-Buy condition, with oil still trading more like a geopolitical asset than a normal demand-and-supply commodity. The main driver remains the U.S.-Iran conflict, the status of the Strait of Hormuz, and whether diplomatic efforts can reduce or extend the current oil-risk premium. WTI is supported by tight global supply, falling inventories, and Persian Gulf risk, but the short-term upside is not clean because traders are also watching peace headlines, demand concerns, and Thursday’s heavy U.S. macro calendar.
By late Friday, Brent traded near $103.20 per barrel, up 0.6% on the day, while WTI traded around $96.28 per barrel, down 0.1%. Despite this late-week stabilization, both contracts were heading for sharp weekly losses. Brent was on track to fall nearly 6%, while WTI was set for a weekly decline of almost 9%. This price action shows that traders removed part of the geopolitical premium as U.S.-Iran peace hopes improved and partial ship movement through Hormuz reduced fears of a worst-case supply shock.
The most important development was the reported movement of ships through the Strait of Hormuz. Iran’s state media said 35 merchant vessels, including oil tankers and container ships, passed safely through the strait over 24 hours under Iranian supervision. Earlier in the week, 26 ships reportedly crossed the route. Since around one-fifth of global oil and gas flows through Hormuz, any sign of restored transit immediately reduces the extreme supply-disruption premium in crude.
However, this is not full normalization. Hormuz traffic remains far below pre-war levels, and Iran’s proposed permit and toll system keeps uncertainty high. The market is not pricing a normal supply environment; it is pricing a controlled, politically sensitive transit regime. Flows can improve quickly if diplomacy progresses, but they can also deteriorate sharply if negotiations fail.
U.S.-Iran diplomacy is the second major driver. Markets reacted positively to signs of progress, while Pakistan continued mediation between Washington and Tehran. Still, the diplomatic picture remains fragile. Iran said differences with the U.S. are still “deep and significant,” and the nuclear issue remains a major obstacle. Reports that Iran would not allow enriched uranium to leave the country added another layer of uncertainty. This keeps weekend and headline risk extremely high.
The inventory picture remains supportive for oil. U.S. crude inventories showed a large weekly drawdown, helped by stronger exports as Washington tried to offset supply gaps linked to Hormuz disruption. Normally, this would be clearly bullish for crude. However, geopolitical headlines dominated the inventory signal, meaning oil sold off when peace hopes improved and rebounded when military risk returned.
U.S. supply data were mildly bearish for the medium term. The Baker Hughes U.S. oil rig count rose to 425, above the 416 forecast and up from 415 previously. The total rig count increased to 558 from 551. Higher rig activity suggests future U.S. supply capacity may improve, although the immediate impact is limited because geopolitical risk remains the dominant short-term driver.
Natural gas gave a weaker signal. U.S. natural gas storage increased by 101B, above the 96B forecast and higher than the previous 85B build. This larger-than-expected injection points to comfortable supply conditions and is generally negative for gas prices. While oil remains driven by Persian Gulf risk, natural gas is more pressured by storage and supply availability.
The macro impact is also important. Earlier in the week, high oil prices strengthened fears of an inflation shock, feeding into global bond volatility and expectations that central banks, including the Fed and ECB, may need to stay hawkish. Later, falling oil eased some inflation panic, supported equities, and improved risk sentiment. For the global economy, energy remains the main transmission channel from geopolitics to inflation.
For WTI, the key technical and fundamental levels are clear. The market condition is Neutral-to-Buy, with a bullish bias while prices hold above $94–$95. Key support sits at $94.00–$95.00, while resistance is near $99.50–$100.00, followed by $103.00–$105.00. A clean move above $100 would signal that traders are rebuilding the risk premium. A break below $94 would suggest peace headlines and demand concerns are taking control.
The day-by-day focus is simple. Monday is the U.S. Memorial Day holiday, so liquidity may be thin and headlines may create sharp moves. Tuesday focuses on U.S.-Iran negotiations. Failed talks could quickly push WTI back toward $100, while real diplomatic progress could pressure crude. Wednesday is a positioning day before inventory data. Thursday is the main event, with the delayed EIA Weekly Petroleum Status Report, U.S. PCE inflation, and GDP data all due. Friday will be a digestion day.
Bottom line: WTI remains supported by a genuine supply shock, not just speculation. Oil can correct on peace headlines, but unless Hormuz risk clearly fades and inventories stop drawing, the broader weekly bias remains Neutral-to-Buy.
WTI Technical analysis
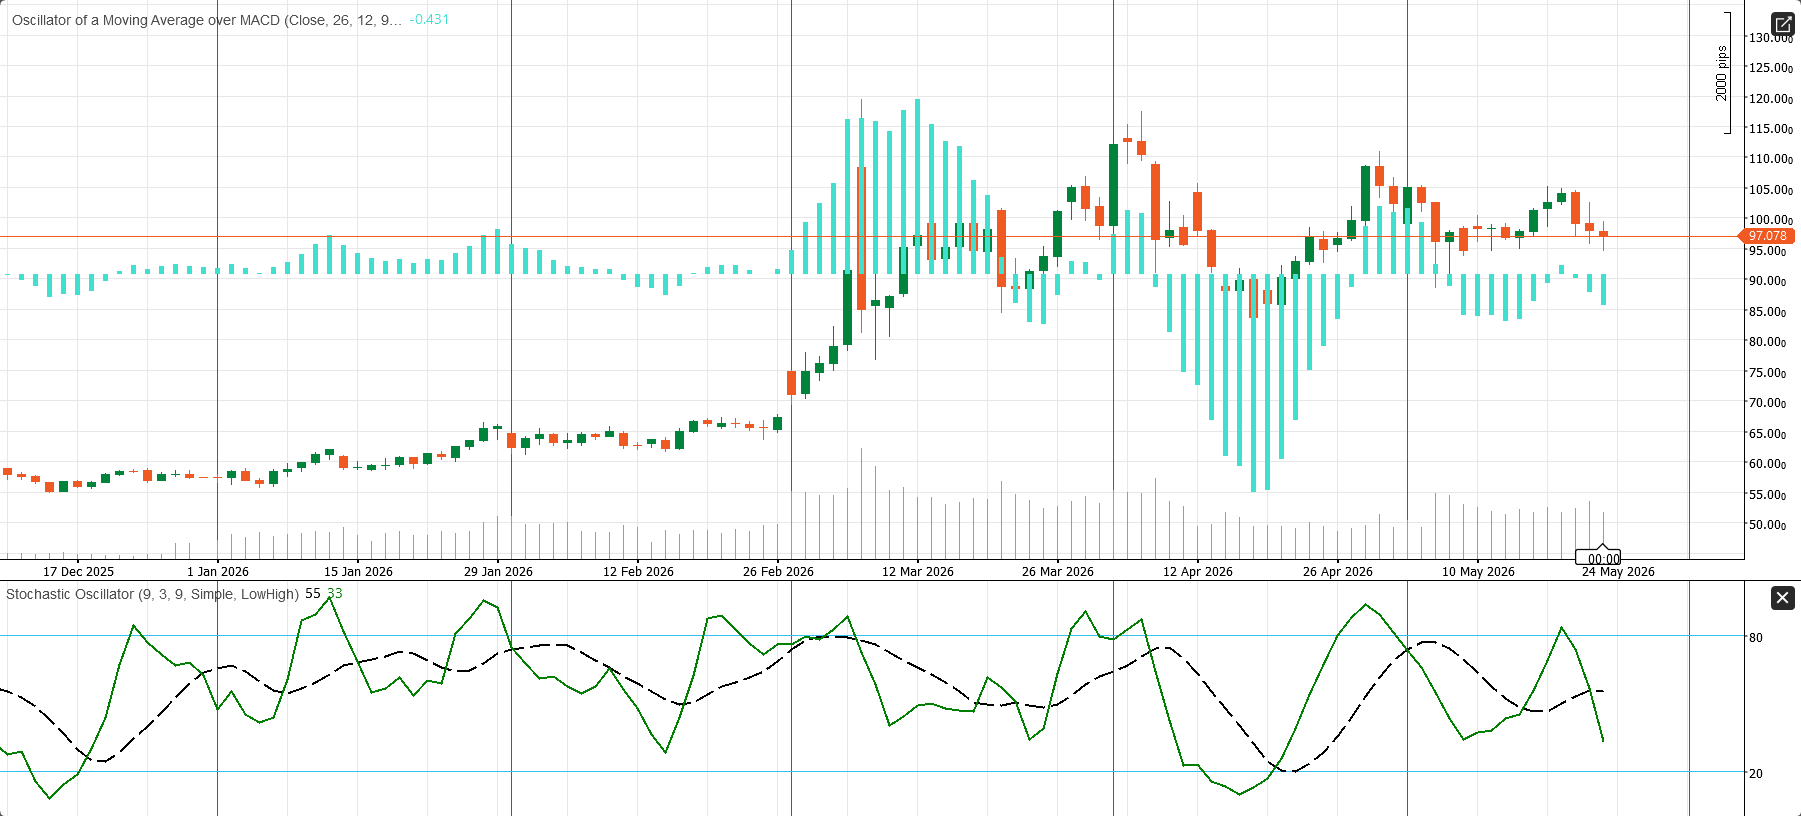
The daily WTI chart shows a market that is still elevated in a broader sense, but short-term momentum has weakened. Price is trading around 97.078, while the oscillator of a moving average over MACD is slightly negative at -0.431, which tells me upside momentum has faded again after the latest rebound. The recent candles also show that crude has failed to hold a move back above the $100 area, leaving the market stuck under an important resistance zone.
From a price-structure perspective, $97.00 is now the immediate pivot. As long as WTI remains below $100.00, the chart still looks like a corrective range with a mild downside bias rather than a fresh bullish breakout. The first support sits near $95.00, and if that zone breaks on a daily close, the next downside area comes in around $90.00–$91.00. On the upside, the first resistance remains $100.00, followed by $105.00 and then the prior swing zone near $110.00.
Momentum is mixed, not strong. The stochastic oscillator is around 55/53, which keeps it in neutral territory, but the latest turn lower suggests buyers are losing urgency rather than building fresh acceleration. In practical terms, this is a market with geopolitical support underneath, but a chart that still needs a clean break above $100 to turn technically constructive again.
Crypto Weekly Outlook: Bitcoin Faces a Macro Test as Momentum Slows
The crypto market enters the week of May 25–30 in a Neutral-to-Defensive condition. Bitcoin remains the main stabilizer for the broader digital-asset market, but short-term momentum has weakened after failing to hold above the $80,000–$82,000 resistance area. The latest quoted levels show BTC near $75,395 and ETH near $2,064, confirming that the market is still under pressure after last week’s pullback.
The previous week ended in a fragile stabilization phase. Bitcoin managed to stop part of its short-term decline, but the rebound lacked conviction. The issue was not only crypto-specific. Elevated U.S. Treasury yields, stronger Fed rate-hike expectations, ETF outflows, and uncertainty around the U.S.-Iran conflict kept risk appetite cautious. Positive structural crypto headlines helped the long-term adoption story, but they were not strong enough to offset the macro pressure.
Bitcoin traded around $77,700–$77,800 late last week after briefly recovering from a five-day losing streak. Earlier, BTC had fallen from levels above $82,000, even though markets received a U.S. Senate regulatory breakthrough. This price action showed that regulatory progress alone was not enough to overpower higher yields, weaker liquidity conditions, and softer institutional demand.
The clearest warning came from spot demand. U.S. spot Bitcoin ETFs recorded $1.84 billion in outflows across six sessions after the April CPI release on May 13. That ended a two-and-a-half-month inflow run that had added $4.4 billion to the ETF complex. Spot order flow also weakened sharply, with Bitcoin seeing nine consecutive sessions of net selling from May 12 to May 20, totaling around $1.2 billion in sell aggression. The streak only broke on May 21, when Nvidia-linked risk appetite helped bring in about $98 million from buyers.
This means institutional demand has cooled. Bitcoin is not collapsing, but the market no longer has the same ETF inflow support that powered earlier gains. Thin trading volumes also show that the rebound is not yet broad-based. For a stronger recovery, BTC needs both price confirmation and a return of spot demand.
Macro conditions remain the main driver. The Federal Reserve minutes showed that policymakers are more willing to consider rate hikes if inflation stays above the 2% target. Kevin Warsh was sworn in as the new Fed Chair, and markets priced in a 25-basis-point rate hike by year-end. Higher real yields and a firm U.S. dollar usually hurt crypto because they reduce liquidity appetite and pressure long-duration risk assets.
The U.S.-Iran conflict added two-way pressure. Geopolitical uncertainty and Strait of Hormuz risk weighed on risk sentiment, but reports of diplomatic progress and partial ship transit through Hormuz helped equities recover. Crypto benefited modestly from better risk appetite, but not enough to generate a clean breakout.
Altcoins mostly followed Bitcoin’s cautious stabilization. Ethereum traded around $2,134–$2,139, XRP stayed near $1.37, Solana performed slightly better near $86.9, Cardano remained around $0.25, and Dogecoin traded near $0.105–$0.106. Overall, altcoin gains were limited, and the market did not show strong rotation into higher-beta crypto assets.
There were still positive structural headlines. SpaceX disclosed 18,712 Bitcoin in its IPO prospectus as of March 31, reinforcing the corporate treasury narrative. Blockchain.com confidentially filed for a U.S. IPO, signaling that crypto infrastructure companies are preparing to return to public markets. In Europe, a banking consortium expanded its euro-pegged stablecoin initiative to 37 financial institutions across 15 countries, showing that regulated tokenized finance is becoming more serious.
The key event this week is Thursday, May 28, when the U.S. releases April PCE inflation, Core PCE, personal income, personal spending, the Q1 GDP second estimate, durable goods, jobless claims, and new home sales. PCE matters most because it is the Fed’s preferred inflation gauge. A hot Core PCE print would likely support the dollar and Treasury yields, which is negative for BTC, ETH, and high-beta altcoins. A softer PCE print could reduce Fed-hawkish pressure and help crypto recover.
Technically, Bitcoin’s setup is fragile but not fully bearish. BTC needs to reclaim $78,000–$80,000 to rebuild bullish momentum. A sustained move above $80,000 would suggest buyers are returning, while a clean breakout above $82,500 would confirm a stronger recovery structure. However, a daily close below $75,000 would shift the short-term outlook bearish and could open the way toward $73,500 or lower.
Ethereum remains weaker than Bitcoin. ETH needs to recover above $2,150–$2,200 to reduce downside pressure. Until then, rallies may remain vulnerable to selling. Altcoins are still selective and high-risk because macro weeks dominated by inflation and yields usually concentrate liquidity in Bitcoin first.
For the week ahead, the strategy is patience. Monday’s U.S. Memorial Day holiday may create thinner liquidity. Tuesday’s Consumer Confidence report can affect risk appetite. Wednesday is a positioning day before PCE. Thursday is the decisive macro test, and Friday will show whether buyers can defend support or whether another round of de-risking begins.
The bottom line: crypto remains Neutral-to-Defensive. Bitcoin is not broken, but it needs a clean recovery above $80,000 to rebuild confidence. Until then, $75,000 is the key support, and $80,000–$82,500 is the confirmation zone.
BTC/USD Technical analysis
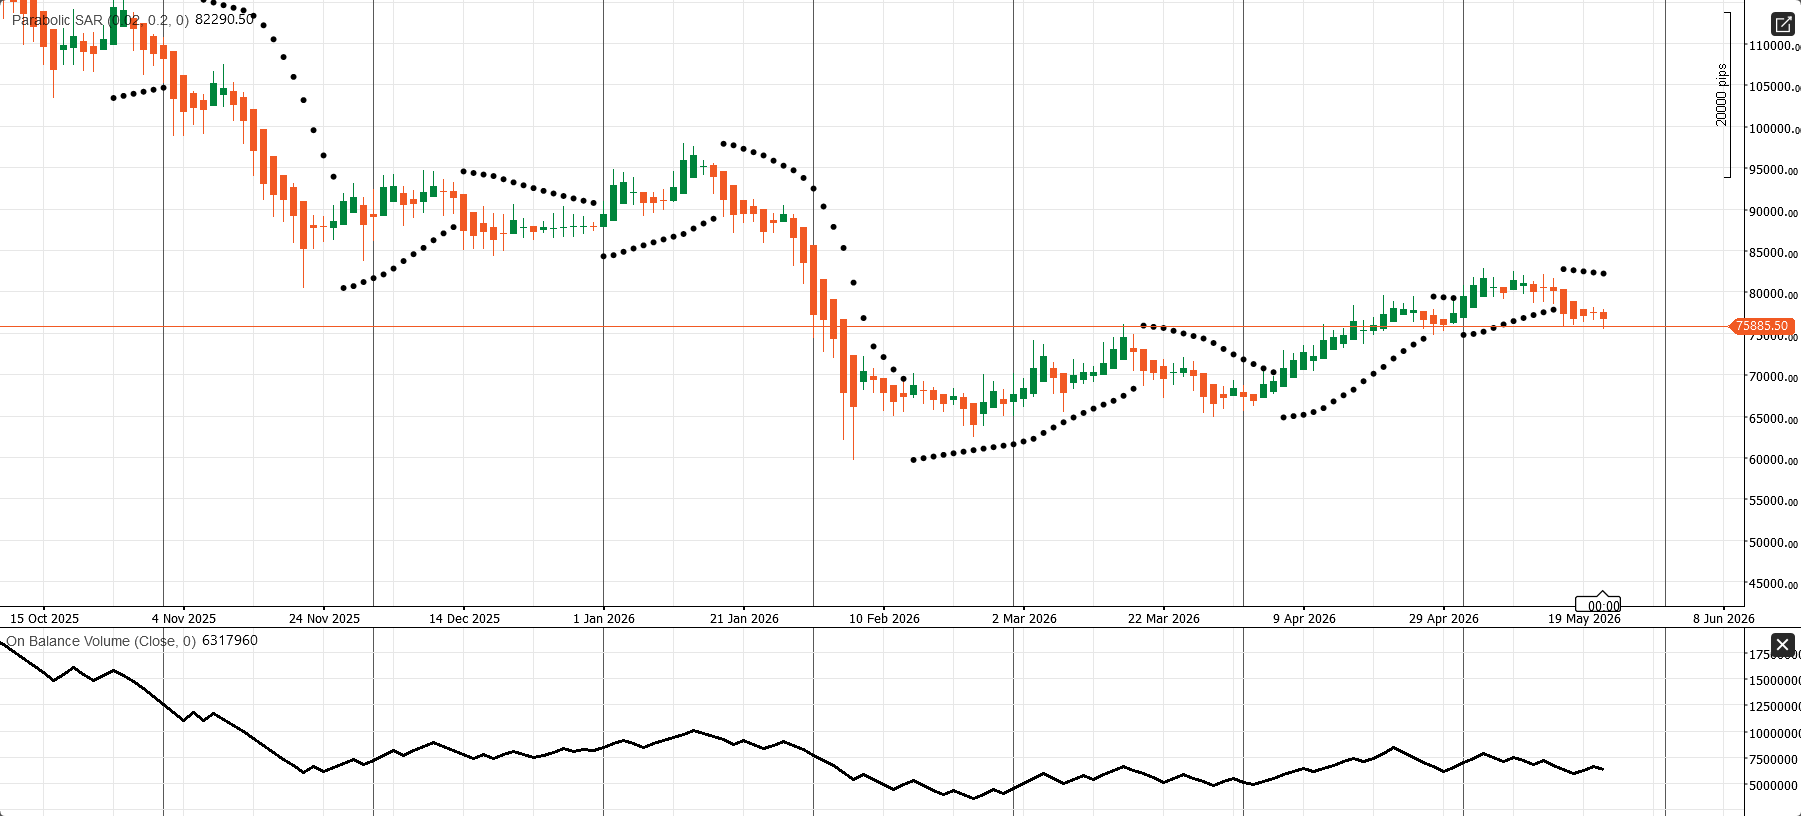
The daily BTC/USD chart has lost momentum after failing to extend the recent recovery. Price is trading around 75,885.50, while the Parabolic SAR sits much higher near 82,290.50, with the dots clearly above price. That structure tells me the short-term trend has turned negative again and that the latest rally phase has already lost control.
From a price-structure perspective, 75,885 is now the immediate pivot. Bitcoin has pulled back from the recent 80,000–82,000 zone and is now sitting close to a support area that matters. If price breaks decisively below 75,500, the next downside zone comes in around 72,000, followed by the broader support area near 68,500–70,000. On the upside, the first resistance sits near 78,500, while the more important trend-reversal barrier remains around the Parabolic SAR near 82,290.
The supporting volume picture is not strong enough to cancel the bearish bias. On-Balance Volume remains well above the February low, which means the broader recovery has not completely failed, but the line has flattened and softened during the latest pullback. In practical terms, this is a chart where buyers have not disappeared, but they are no longer pressing with conviction.
FAQ
Why is U.S. PCE inflation the most important data point this week?
U.S. PCE inflation is important because it is the Federal Reserve’s preferred inflation measure. A hot PCE print could support higher Treasury yields and a stronger U.S. dollar, while pressuring equities, gold, crypto, and emerging-market assets.
What is the global market condition for May 25–30, 2026?
The global market condition is Neutral-to-Defensive. Sticky inflation, weaker demand, high energy prices, and geopolitical risk are keeping investors cautious.
Why is Europe facing stagflation risk?
Europe is facing stagflation risk because growth remains weak while inflation pressure is still supported by higher energy costs. This creates a difficult environment for the European Central Bank and European risk assets.
What should traders watch in China this week?
Traders should watch China’s industrial profits and broader signs of corporate margin pressure. Recent data already showed slower industrial output, weak retail sales, and falling fixed-asset investment.
Why does Japan matter for global markets this week?
Japan matters because Tokyo CPI, unemployment, retail sales, and industrial production can affect expectations for Bank of Japan policy. The BoJ is still balancing inflation pressure against fragile domestic demand.
What would be bullish for global risk assets this week?
A softer U.S. PCE print combined with stable personal spending would be bullish for risk assets. It could reduce Fed-hawkish pressure, weaken the U.S. dollar, lower yields, and support equities, gold, and crypto.
What would be bearish for global risk assets this week?
A hot U.S. PCE print would be bearish for global risk assets. It could lift Treasury yields and the U.S. dollar, while pressuring Wall Street, gold, crypto, and emerging markets.
Comments