 English
 پارسی



Watch the Analytical Video
Global Economy Weekly Review:
Growth Holds, but the World Economy Looks More Uneven and More Sensitive to Energy and Confidence Shocks
The past week’s data suggest the global economy is still expanding overall, but the expansion is increasingly uneven across regions and sectors. The broad picture is one of resilient labor markets, selective manufacturing stabilization, and still-firm parts of consumer demand, offset by weaker services momentum in some major economies, softer business investment, mixed inflation trends, and persistent geopolitical pressure through energy and risk sentiment.
The most important global theme was that headline recession signals did not dominate the data, but neither did a clean reacceleration story emerge. Instead, the week showed an economy that is still moving forward, but with less synchronized momentum than earlier in the cycle.
USA
The United States remained resilient, but the quality of growth softened.
The U.S. produced the strongest major labor-market headline of the week. Nonfarm payrolls rose 178K in March, far above the 65K forecast and a sharp rebound from -133K previously, while private payrolls increased 186K and the unemployment rate fell to 4.3%. Retail demand was also solid: headline retail sales rose 0.6% month-on-month, core retail sales rose 0.5%, and consumer confidence improved to 91.8. Vehicle sales were strong as well, with total vehicle sales rising to 16.30M.
But underneath those headline positives, the U.S. growth profile became less clean. Average hourly earnings slowed to 0.2% month-on-month and 3.5% year-on-year, average weekly hours slipped to 34.2, JOLTS job openings fell to 6.882M, and the Atlanta Fed GDPNow estimate for Q1 was revised down to 1.6%. Most importantly, services weakened sharply: the S&P Global Services PMI fell to 49.8, back below 50, while the composite PMI slowed to 50.3. Manufacturing stayed in expansion, with ISM at 52.7, but the internal details were mixed, as new orders eased and employment stayed below 50, while the prices index jumped to 78.3. In short, the U.S. still looks stronger than most peers, but its growth mix became less convincing as the week progressed.
EU & UK
Europe looked stable, but soft in demand and still uneven in activity.
The UK economy remained in low-growth mode. GDP rose 0.1% quarter-on-quarter in Q4, while annual growth slowed to 1.0% from 1.2%. Household credit conditions were still firm: mortgage approvals rose to 62.58K, consumer credit increased to 1.935B, and money growth improved. House prices also strengthened, with the Nationwide House Price Index rising 0.9% month-on-month and 2.2% year-on-year. But business investment fell 2.5% quarter-on-quarter, the current account stayed in deficit at -18.4B, and the manufacturing PMI slipped to 51.0, showing that the UK remains stable, but far from strong.
Across the euro area, the biggest positive was the continued easing in underlying inflation. Headline CPI came in at 2.5% year-on-year, below forecast, while core CPI slowed to 2.3%, also below forecast. That keeps the disinflation trend alive. At the same time, manufacturing PMIs improved, with the euro area manufacturing PMI rising to 51.6, Germany to 52.2, and Italy to 51.3. That suggests the factory cycle is no longer deteriorating across the bloc.
However, Europe’s domestic demand picture remained soft. German retail sales fell 0.6% month-on-month, French consumer spending dropped 1.4%, and Italian retail sales were flat with slower annual growth. Labor conditions also softened slightly, with euro area unemployment rising to 6.2% from 6.1%. Country inflation data were also mixed: France and Germany both showed firmer headline inflation, even while euro area core inflation eased. This leaves Europe in a fragile position: manufacturing is stabilizing, but consumer demand is not yet delivering a broad recovery.
China
China improved at the official level, but private-sector momentum was less convincing.
China’s official survey data were one of the clearer bright spots of the week. The official manufacturing PMI rose to 50.4 from 49.0, the non-manufacturing PMI rose to 50.1 from 49.5, and the official composite PMI climbed to 50.5 from 49.5. That shows the economy moved back into expansion territory at the official survey level.
But the private readings were softer. The RatingDog manufacturing PMI fell to 50.8 from 52.1, and the RatingDog services PMI dropped sharply to 52.1 from 56.7, well below the forecast. The implication is that China stabilized, but the recovery is still not broad-based. Manufacturing is no longer clearly weak, but services momentum cooled meaningfully in private-sector data. China, therefore, ended the week looking better than before, but not decisively strong.
Japan
Japan remained one of the clearest examples of corporate resilience paired with soft household demand.
Japan’s business sector held up reasonably well. The Tankan large manufacturers index rose to 17, the large non-manufacturers index increased to 36, and both beat expectations. The manufacturing PMI rose to 51.6, and the services PMI came in at 53.4, still firmly expansionary. Labor-market data also stayed solid, with the unemployment rate falling to 2.6% and the jobs-to-applicants ratio improving to 1.19.
But domestic demand was softer. Retail sales fell 0.2% year-on-year, industrial production dropped 2.1% month-on-month, and housing starts fell 4.9% year-on-year. Capital spending plans also weakened materially, with Tankan all big industry CAPEX slowing to 3.3% and all small industry CAPEX falling to -8.1%. Inflation in Tokyo eased, with core CPI slowing to 1.7%, which helps explain why Japan’s policy normalization story remains gradual rather than aggressive. Japan still looks stable, but domestic momentum is not as strong as corporate sentiment suggests.
Emerging Matkets
The emerging-market picture was dominated by trade resilience, but uneven domestic conditions.
Several emerging markets produced strong external readings. South Korea’s exports surged 48.3% year-on-year, and its trade surplus widened to 25.74B. Australia’s trade balance rose to 5.686B, far above forecast, helped by stronger exports and weaker imports. South Africa’s trade surplus widened sharply to 36.92B, and its fiscal balance also improved significantly. India’s trade deficit narrowed in Q3, while Brazil’s foreign-exchange flows turned positive.
But domestic momentum across emerging markets remained mixed. South Korea’s industrial production rose strongly month-on-month, but still fell year-on-year. India’s manufacturing PMI stayed expansionary at 53.9, but slowed from 56.9. Turkey’s headline inflation eased, which was positive, but manufacturing stayed in contraction at 47.90, the unemployment rate rose to 8.5%, and reserves fell sharply. Brazil’s industrial production rose month-on-month but remained negative year-on-year, while debt and fiscal data worsened. Mexico’s manufacturing PMI improved to 48.90, but remained below 50. Russia showed weak business activity, contracting manufacturing, weaker retail sales, and lower reserves, even though unemployment remained low and real wage growth accelerated.
The emerging-world message was therefore similar to the developed-world one: external balances were often better than domestic demand.
Inflation trends were mixed, not one-directional.
This week did not deliver a globally synchronized inflation message. In some places, inflation moderated: Turkey’s headline CPI eased, South Korea’s CPI came in below forecast, and Swiss CPI was softer than expected. In other areas, inflation or price pressure stayed firmer than comfort would suggest: Germany and France saw stronger headline inflation, Brazil’s IPC-Fipe accelerated, and the U.S. ISM prices index jumped sharply. Producer-price signals were also uneven, with France’s PPI remaining weak, Turkey’s annual PPI rising, and Brazil’s monthly PPI turning negative.
That means the global inflation story is still one of slower broad trend pressure, but not a clean or universal disinflation path.
The final layer this week was geopolitics and energy.
Although the macro data themselves were mixed, the global economic backdrop was heavily influenced by Iran-related escalation risk and uncertainty over the Strait of Hormuz. Energy prices remained volatile, and the market reaction across equities, FX, gold, crypto, and oil-sensitive assets showed that the world economy remains highly sensitive to supply-shock risk. Even where macro data improved, investor confidence stayed vulnerable to geopolitical headlines.
Overall Assessment
The global economy this week looked more resilient than recessionary, but also less synchronized and more fragile than a true upswing would require. The U.S. remained the strongest major economy on headline data, but services and real-time growth tracking softened. Europe improved in manufacturing but stayed weak in domestic demand. China stabilized in official data, though private momentum cooled. Japan held up through business sentiment and labor stability, but household demand stayed uneven. Emerging markets benefited from stronger trade flows in several cases, but domestic conditions remained mixed and country-specific risks stayed high.
The week’s data do not point to a global downturn. But they do suggest that the world economy is now relying more on selective resilience than on broad-based momentum.
This combination of still-positive growth, uneven inflation, and geopolitical energy risk is likely to keep global markets highly data-sensitive and headline-sensitive. Economies with stronger external balances and resilient labor markets should remain relatively better positioned, but higher oil volatility and weak domestic-demand signals could quickly challenge the stability of the current global expansion.
Global Economic Week Ahead: April 6–12, 2026
The big picture
My base case is that the week keeps the market trapped between two competing narratives: higher inflation from energy and logistics versus slower real activity, especially in services-sensitive parts of the economy. That framing is consistent with S&P Global’s warning that the post-war hit looks larger in services than in manufacturing, and with Eurostat’s March breakdown showing a sharp swing in euro-area energy inflation to 4.9% while services inflation stayed elevated at 3.2%.
In practical market terms, this means the most important question is not simply whether inflation rises, but whether it rises alongside still-resilient demand or alongside visible growth fatigue. A hot inflation print with firm services would reinforce a “higher-for-longer” rates repricing. A hot inflation print with weaker activity would push the market closer to a stagflation-risk interpretation. That is an inference from the current calendar and data mix, not a published forecast.
What matters most this week
Monday, April 6: the first major checkpoint is the U.S. ISM Services PMI, which ISM says is due on the third business day of the month; S&P Global also lists a broad set of global and regional services PMIs for Monday and Tuesday, including Canada, Brazil, Singapore, India, Australia, the euro area, and the UK. This makes early-week price action heavily dependent on whether the service sector is still absorbing the shock or already slowing.
Wednesday, April 8: This is the main central-bank day. The Federal Reserve’s calendar shows the March 17–18 FOMC minutes are due on April 8, and the RBNZ confirms its next Monetary Policy Review and OCR decision is also on April 8. The RBNZ’s official page shows the OCR currently at 2.25%, unchanged at the February decision.
Thursday, April 9: the U.S. gets a meaningful hard-data bundle. BEA’s schedule shows Q4 2025 GDP third estimate and Personal Income and Outlays for February 2026 on April 9, which means the market will see updated growth, spending, and PCE data one day before CPI. The key nuance is that PCE is still only a February read, while CPI will capture March, making CPI the cleaner gauge of the newer energy shock.
Friday, April 10: This is the week’s most important session. BLS schedules the March CPI release for April 10; S&P Global notes that LSEG polling expects U.S. headline CPI to rise 0.9% month on month after 0.3% in February, with core seen at 0.3% after 0.2%. The same day also brings China CPI and PPI, Canada’s Labour Force Survey, and Japan’s Corporate Goods Price Index, giving markets a broad cross-regional read on price pass-through and labor resilience.
Regional read
United States: The U.S. remains the week’s main macro price setter. March payrolls were solid enough to keep the economy from looking fragile, but not strong enough to neutralize inflation concerns on their own. That leaves Monday’s ISM Services, Wednesday’s FOMC minutes, Thursday’s PCE, and especially Friday’s CPI as a sequential test of whether the Fed is facing a temporary energy spike or a more durable inflation re-acceleration.
Euro area and UK: Europe enters the week from a more uncomfortable starting point because inflation has already re-accelerated. Eurostat’s flash estimate puts euro-area inflation at 2.5% in March, up from 1.9% in February, with energy turning sharply positive. Against that backdrop, the week’s euro-area retail sales, producer prices, and Germany’s factory orders/industrial production matter less as standalone releases and more as a test of whether the region is drifting into a growth-weaker / inflation-higher mix.
China and Asia-Pacific: China’s March PMI data already showed a short-term improvement, with manufacturing at 50.4 and services activity at 50.2, so Friday’s CPI/PPI batch is crucial for judging whether domestic demand is firm enough to offset imported cost pressure. In the broader region, New Zealand is the only clean G10 policy decision this week, while Japan’s Friday CGPI will be watched for pipeline price pressure.
Market framework for the week
The cleanest macro framework is this:
If U.S. services hold up and Friday CPI is hot, the likely first reaction is firmer front-end yields, a stronger dollar, and a more difficult backdrop for duration-sensitive and high-beta assets. If services soften but CPI still runs hot, the market is more likely to talk about stagflation risk than simple hawkish repricing. If CPI comes in softer than feared and the services data avoids a sharp break, risk assets probably get a relief window because the market has already gone into the week expecting visible energy pass-through. The forecast element here is my inference from the official calendar, plus current survey and inflation data.
Bottom line
This is a week where inflation prints matter more than policy rhetoric, because the policy debate itself depends on what the March data now show. Watch the sequence carefully: ISM Services on Monday, FOMC minutes and RBNZ on Wednesday, U.S. PCE/GDP on Thursday, then U.S. CPI plus China inflation on Friday. If that sequence confirms higher prices without a sharp demand collapse, markets will lean back toward higher-for-longer. If it confirms higher prices and softer activity together, the dominant theme shifts to global stagflation risk.
U.S. A
The week ahead is the U.S. inflation-validation week. The growth backdrop remains sturdy enough to keep the Fed from turning dovish quickly, but not strong enough to absorb a prolonged energy shock without market stress. So the week should be read in this order: oil first, CPI second, Fed minutes third, auction demand fourth, earnings/guidance fifth. If those lines align in a hotter direction, the dollar and yields should stay firm, and equity upside should remain selective. If they cool together, markets can reopen the door to a softer-rates narrative.
U.S. Economic Review of Past Week
Hiring Rebounds, Consumers Hold Up, but Services and Growth Momentum Cool
A strong payroll headline helped the U.S. economy finish the week on a still-expanding footing, but the deeper details painted a more uneven picture. Consumer spending remained supportive, manufacturing stayed in expansion, and layoffs were still relatively contained. However, softer wage growth, weaker services activity, slowing housing demand, and lower real-time GDP tracking showed that the economy is no longer improving in a broad and clean way.
The U.S. economy ended the week with a mixed but still resilient macro backdrop. The clearest positive came from the labor market headline. Nonfarm payrolls rose by 178K in March, well above the 65K forecast and a sharp rebound from -133K previously. Private payrolls increased by 186K, also beating expectations, while the unemployment rate edged down to 4.3% from 4.4%. Manufacturing hiring also improved, with manufacturing payrolls up 15K against a -5K forecast. On the surface, that combination suggested the U.S. labor market remained stronger than feared.
Still, the labor data were not uniformly strong. The participation rate slipped to 61.9% from 62.0%, the U6 unemployment rate rose to 8.0% from 7.9%, and wage momentum softened. Average hourly earnings slowed to 0.2% month-on-month from 0.4%, while annual wage growth eased to 3.5% from 3.8%. Average weekly hours also fell to 34.2 from 34.3. In other words, hiring improved, but wage pressure cooled and broader labor slack did not fully disappear. That makes the employment picture look firm at the headline level, but less convincing underneath.
On the consumer side, the economy still showed important pockets of strength. Retail sales rose 0.6% month-on-month in February, beating the 0.5% forecast and improving from -0.1% previously. Core retail sales and the retail control group both increased 0.5%, also above expectations, while retail sales excluding gas and autos rose 0.4%. Annual retail sales growth accelerated to 3.71% from 3.19%. Confidence data also improved, with consumer confidence rising to 91.8 from 91.0, above the 87.8 forecast. In autos, total vehicle sales climbed to 16.30M from 15.80M, with both car and truck sales moving higher. Together, those figures suggested that household demand remained active, especially in discretionary and durable-goods categories.
However, housing-related demand remained under pressure. The MBA 30-year mortgage rate rose to 6.57% from 6.43%, and mortgage applications fell 10.4%, with both purchase and refinance activity weakening. House-price data also cooled. The Case-Shiller 20-city index rose 1.2% year-on-year, down from 1.4% previously, while the FHFA house price index increased just 0.1% month-on-month and 1.6% year-on-year, both slower than prior readings. This suggests that while consumers are still spending, interest-rate-sensitive parts of demand remain soft.
Business activity data revealed a clear split between manufacturing and services. On the manufacturing side, conditions remained expansionary. The ISM Manufacturing PMI rose to 52.7, above both the 52.3 forecast and 52.4 previously, while the S&P Global Manufacturing PMI came in at 52.3, also stronger than the prior reading. But even here, the internal details were less clean. The ISM prices index surged to 78.3 from 70.5, pointing to much stronger input-cost pressure. At the same time, the ISM employment index slipped to 48.7, and the new orders index eased to 53.5 from 55.8. Manufacturing remained in expansion, but it was not a uniformly strong expansion.
The services side was weaker and more concerning. The S&P Global Services PMI fell to 49.8, below the 51.1 forecast and down from 51.7, slipping back into contraction territory. The composite PMI slowed to 50.3 from 51.9, showing that overall private-sector momentum came close to stagnation by the end of the week. Inventory data also leaned soft, with business inventories down 0.1% month-on-month and retail inventories excluding autos up only 0.3%, suggesting cautious stock-building rather than rising business confidence.
Forward-looking growth signals also softened. The Atlanta Fed GDPNow estimate for Q1 was revised down twice, first to 1.9% and then to 1.6%, indicating weaker real-time growth tracking as the week progressed. Labor-demand indicators softened as well. JOLTS job openings fell to 6.882M from 7.240M, below expectations. ADP employment rose 62K, above forecast but below the prior reading. Meanwhile, initial jobless claims fell to 202K, but continuing claims rose to 1,841K from 1,816K. The message was that layoffs remained relatively contained, but hiring demand and re-employment momentum were softer than the payroll headline alone suggested.
The external and energy picture remained mixed. The U.S. trade deficit narrowed to -57.30B in February, better than forecast, although still wider than the prior month. Export and import levels both increased, while the goods trade deficit widened to -84.60B from -81.80B. In energy, the EIA reported a 5.451M build in crude inventories, far above the 1.800M forecast. Refinery activity softened, while distillate and heating oil inventories fell. Natural gas storage rose by 36B, slightly below forecast, and Baker Hughes oil rigs increased to 411 from 409, with the total rig count rising to 548 from 543. The broader message is that domestic supply remains active, but energy balances are still uneven.
Final Assessment
Overall, the week’s data point to a U.S. economy that is still growing, but in a less balanced way than the headline payroll report suggests. Consumption held up, manufacturing stayed in expansion, and layoffs remained low, but services weakened sharply, wage growth cooled, housing stayed soft, job openings declined, and GDP tracking moved lower. This is not a recessionary picture, but it is also not a clean reacceleration story. The economy still looks resilient on the surface, yet increasingly softer underneath.
U.S. Economic Outlook for the Week Ahead (Week 15, 2026)
Inflation Takes Center Stage as Oil, CPI, and the Fed Drive Market Risk
With growth still intact but inflation pressure building again, the week ahead is shaping up as a crucial test for the U.S. macro narrative. Oil prices, CPI, Fed minutes, Treasury auction demand, and corporate guidance will determine whether markets move back toward a higher-for-longer rates view or reopen the door to a softer policy path.
The U.S. enters the new week with a resilient hard-data backdrop, but also with rising inflation risk. March payrolls rebounded by 178,000, the unemployment rate edged down to 4.3%, February retail sales rose 0.6%, and the Conference Board’s March confidence index improved to 91.8. At the same time, JOLTS openings and hiring softened, and the Atlanta Fed’s GDPNow estimate for Q1 2026 fell to 1.6% as of April 2. The message is clear: growth has not broken, but it is no longer strong enough to make inflation risk irrelevant. Instead, the market is being forced to confront a more difficult mix of steady activity, higher oil, rising gasoline prices, and lingering supply-chain stress.
That is why this week is less about whether the U.S. economy is slowing and more about whether inflation is re-accelerating enough to keep the Federal Reserve sidelined. The Fed held its policy rate at 3.50%–3.75% on March 18, and the minutes from that meeting will be released on Wednesday, April 8. But even before then, the market must deal with the inflation impulse coming from energy. AAA’s national average gasoline price stood at $4.091 on April 3, and OPEC+ is scheduled to meet on Sunday, April 5, creating the possibility that the week begins with an oil-driven repricing in futures before U.S. cash markets even open.
The core market thesis is straightforward. If oil remains elevated, ISM Services stays firm, and CPI comes in hot, markets will likely price out more rate cuts, push Treasury yields higher, and support the U.S. dollar, while keeping pressure on duration-sensitive equities. If, by contrast, CPI is softer than feared and OPEC+ helps calm the energy backdrop, markets can rotate back toward a “Fed on hold, but not turning more hawkish” interpretation. That would be a more constructive setup for both equities and bonds. Reuters’ week-ahead framing, notes expectations for March CPI to rise 0.9% month on month and core CPI to rise 0.3%, which makes Friday the single most important macro event of the week.
The calendar begins on Monday, April 6, with ISM Services PMI for March. The previous reading was 56.1, the strongest since July 2022, so the market will be watching whether services demand remains firm and whether price pressure is now spreading more clearly beyond manufacturing. This matters because the services sector dominates the U.S. economy and remains central to the Fed’s inflation debate. A strong reading would reinforce the idea that activity is holding up even as inflation risks rise.
Tuesday, April 7 brings a dense mix of macro and market-sensitive releases. The Fed publishes Consumer Credit, the EIA releases its Short-Term Energy Outlook, Vice Chair Philip Jefferson is scheduled to speak, Delta reports March-quarter earnings, and the Treasury auctions the 3-year note. This is effectively a rates + oil + consumer day. Consumer credit offers another read on household financing conditions, the EIA shapes near-term energy expectations, Jefferson can influence the policy narrative, Delta provides an early signal on fuel-cost pressure and travel demand, and the 3-year auction gives the first major read on investor appetite for duration this week.
The most crowded cross-asset session should be Wednesday, April 8. The Fed releases the March 17–18 FOMC minutes, while BLS publishes State Employment and Unemployment, the Census Bureau releases Business Formation Statistics, the EIA publishes the Weekly Petroleum Status Report, and the Treasury auctions the 10-year note. This is the clearest day of the week for macro transmission: policy tone, oil inventories, and benchmark Treasury demand all arrive together. If the minutes sound firm while energy remains elevated and the 10-year auction is weak, yields could move higher quickly.
On Thursday, April 9, markets will focus on weekly jobless claims, the 30-year bond auction, and the Personal Income & Spending report. Claims remain one of the fastest labor-market indicators, while the long-bond auction matters because the Treasury market is balancing inflation risk against concern over war-related fiscal costs. The Personal Income & Spending report is somewhat stale because it covers February, but it still matters. The outlook fo personal spending rising 0.7%, the PCE deflator increasing 0.4%, real spending rising 0.3%, and personal income increasing 0.3%. That would suggest the consumer is still holding up, though not in a way that fully offsets inflation pressure.
Everything then leads into Friday, April 10, the key macro session of the week. BLS releases March CPI and Real Earnings, while the University of Michigan publishes preliminary April consumer sentiment. The inflation channel is likely to dominate. We estimate consumer prices rose 1.0% in March, lifting year-on-year CPI to 3.4%, with energy goods, especially gasoline, contributing roughly 70 basis points of the monthly increase. Airline fares are also expected to contribute to price pressure, while core inflation is seen staying sticky enough to show that the previous disinflation trend was already losing momentum. The broader implication is that oil, CPI, and inflation expectations will be the dominant trio for USD, rates, and equity sector leadership.
Final Assessment
My base case is that the market stays more sensitive to inflation than growth this week. The rebound in jobs gives the Fed less reason to turn dovish quickly, while the jump in ISM prices paid to 78.3 and slower supplier deliveries point to supply-side inflation pressure, not clean demand cooling. That leaves the U.S. entering the week with a still-sturdy surface, but a much more fragile market balance underneath.
U.S. Dollar and Wall Street Outlook for the Week Ahead:
Oil, Inflation, and Fed Patience Set the Tone
The week ahead looks modestly bullish for the U.S. dollar and cautious-to-selective for Wall Street. The macro backdrop still favors the dollar because the U.S. economy remains relatively resilient, while rising oil prices, sticky pipeline inflation, and a more patient Federal Reserve are creating a more fragile environment for equities. Wall Street is not facing a clearly bearish setup, but it is also no longer in a market climate that easily supports broad multiple expansion.
At the center of the outlook is a straightforward macro map. The U.S. still looks stronger than many peers, and that matters for both rates and currency markets. Labor conditions remain firm enough to reduce pressure on the Fed to ease quickly, while recent inflation-sensitive data continue to suggest that price pressures have not faded cleanly. At the same time, the latest energy shock has pushed investors to rethink the pace of rate cuts. The result is a market that is increasingly trading around inflation persistence, oil, and policy patience, rather than around a simple soft-landing optimism story.
That is why the dollar enters the week with the better macro setup. USD bias remains upward unless inflation and activity data cool materially. The labor report was strong enough to keep near-term easing expectations under control, and the broader manufacturing picture also supports the idea that inflation risks remain alive. March manufacturing data showed PMI at 52.7, supplier deliveries at 58.9, and prices paid at 78.3. That is an important combination because it points to an economy that is still functioning well enough, but with enough cost pressure in the pipeline to keep the Fed cautious. In that environment, U.S. yields can remain relatively firm, which supports the dollar against peers.
The most important external driver is still oil and the Persian Gulf. U.S. crude moved above $110 during the week, while AAA’s national average gasoline price rose above $4 per gallon. At the same time, OPEC+ was preparing to consider a further output increase on Sunday, April 5. Even if more supply is signaled, the broader market concern remains that the effect may stay limited if disruption around the Persian Gulf and the Strait of Hormuz persists. This matters because higher oil tends to be positive for the dollar through inflation and yield support, but negative for equities through profit-margin pressure and weaker consumer purchasing power. In other words, oil is doing opposite work across asset classes.
USD Outlook: Macro and Technical Structure Still Lean Higher
From a macro perspective, the dollar still has the cleaner narrative. The market is increasingly concluding that the Fed has less room to cut quickly, and that view becomes stronger if inflation data stay firm or if oil remains elevated. That does not mean the dollar must rally in a straight line, but it does mean dips are more likely to be viewed as temporary corrections unless the week’s inflation and activity numbers turn decisively cooler.
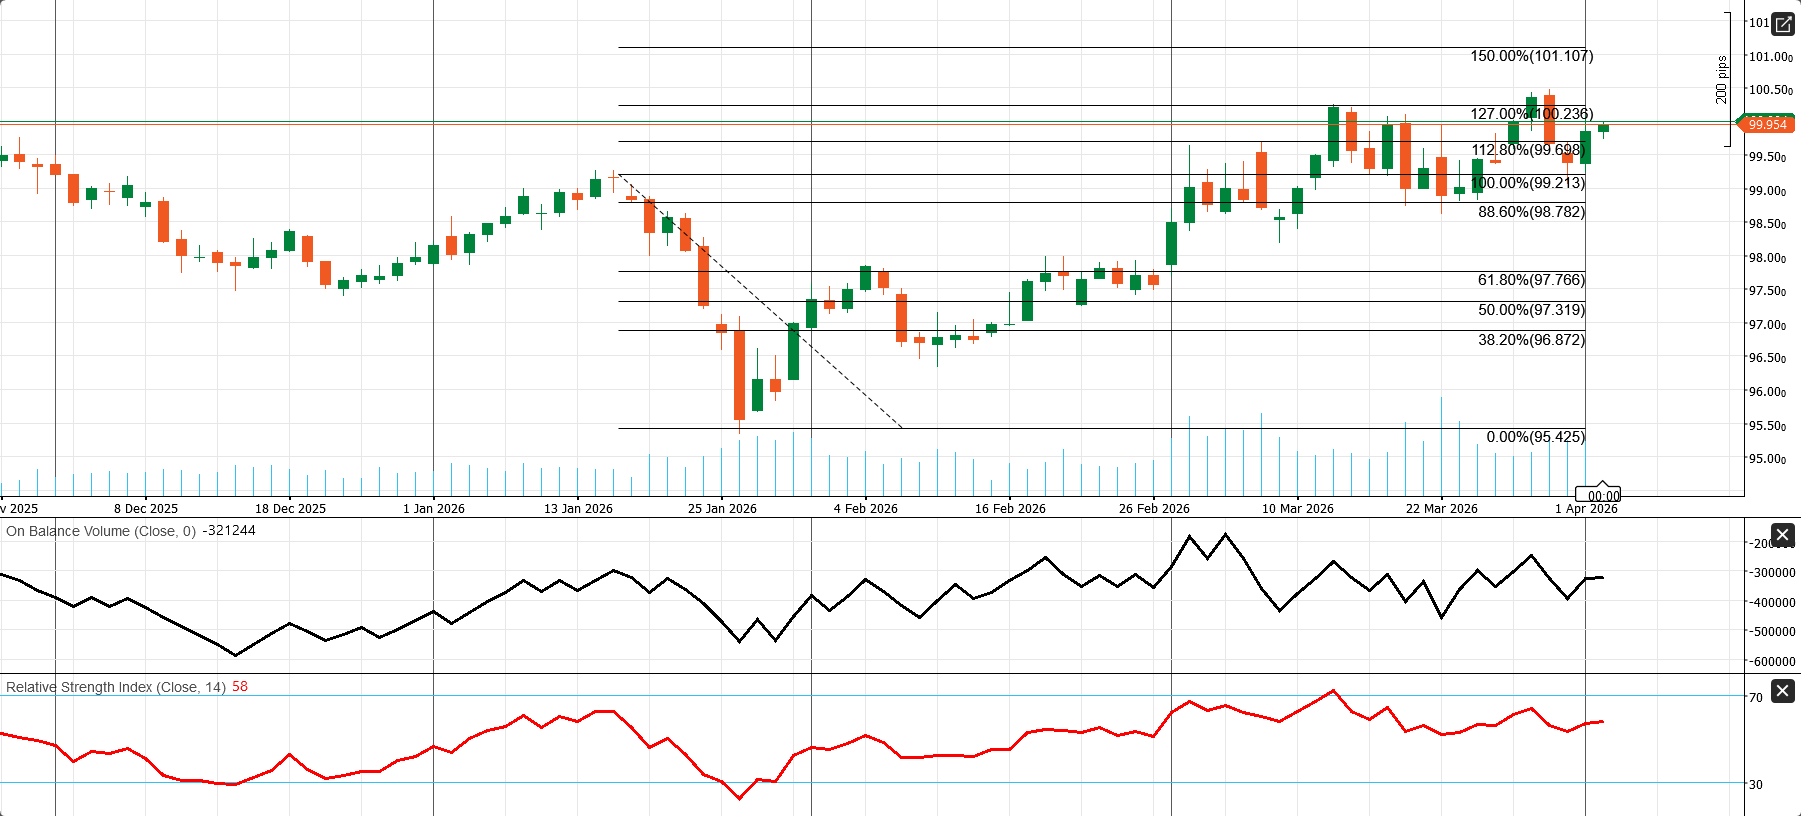
From a technical perspective, the daily USD structure remains mildly bullish. Price has recovered strongly from the late-January low near 95.42 and continues to print a sequence of higher lows and higher highs, which keeps the short-term trend pointed upward. The immediate resistance zone sits around 99.95–100.24, a key area because it aligns with recent swing highs and the 127.0% Fibonacci extension at 100.236. A daily close above 100.24 would strengthen the bullish case and open the way toward the next upside target near 101.10. On the downside, the first support is around 99.70, followed by 99.21 and then 98.78. As long as price remains above that support cluster, pullbacks are more likely to be treated as corrective rather than trend-changing. The technical indicators broadly support that view: RSI near 58 suggests positive momentum without an overbought condition, while OBV has improved from earlier lows, even if it has not yet confirmed a decisive breakout.
Wall Street Outlook: Selective Opportunity, but Not a Broadly Easy Tape
For Wall Street, the setup is more complicated. There is still an earnings cushion in the background. The S&P 500 has just snapped a five-week losing streak, and analysts are looking for roughly 14.4% year-on-year Q1 earnings growth. That helps explain why equities are not in an outright bearish condition. However, the index remains nearly 6% below its late-January high, and the market is trading less on growth enthusiasm and more on oil, inflation, and rates. That shift in market leadership argues for a selective tape, not a broad-based rally driven by multiple expansion.
The main upside catalyst for equities would be a cooler inflation signal or a more convincing improvement in the oil story. If CPI and inflation expectations come in softer than feared, and if markets become more confident that disruption in the Persian Gulf is easing, Treasury yields could retrace and Wall Street could rebound more broadly. That would also likely be the main trigger for a temporary dollar pullback, because the dollar’s current support comes primarily from the conclusion that the Fed needs to remain patient. Without that patience premium, USD would lose some of its macro advantage.
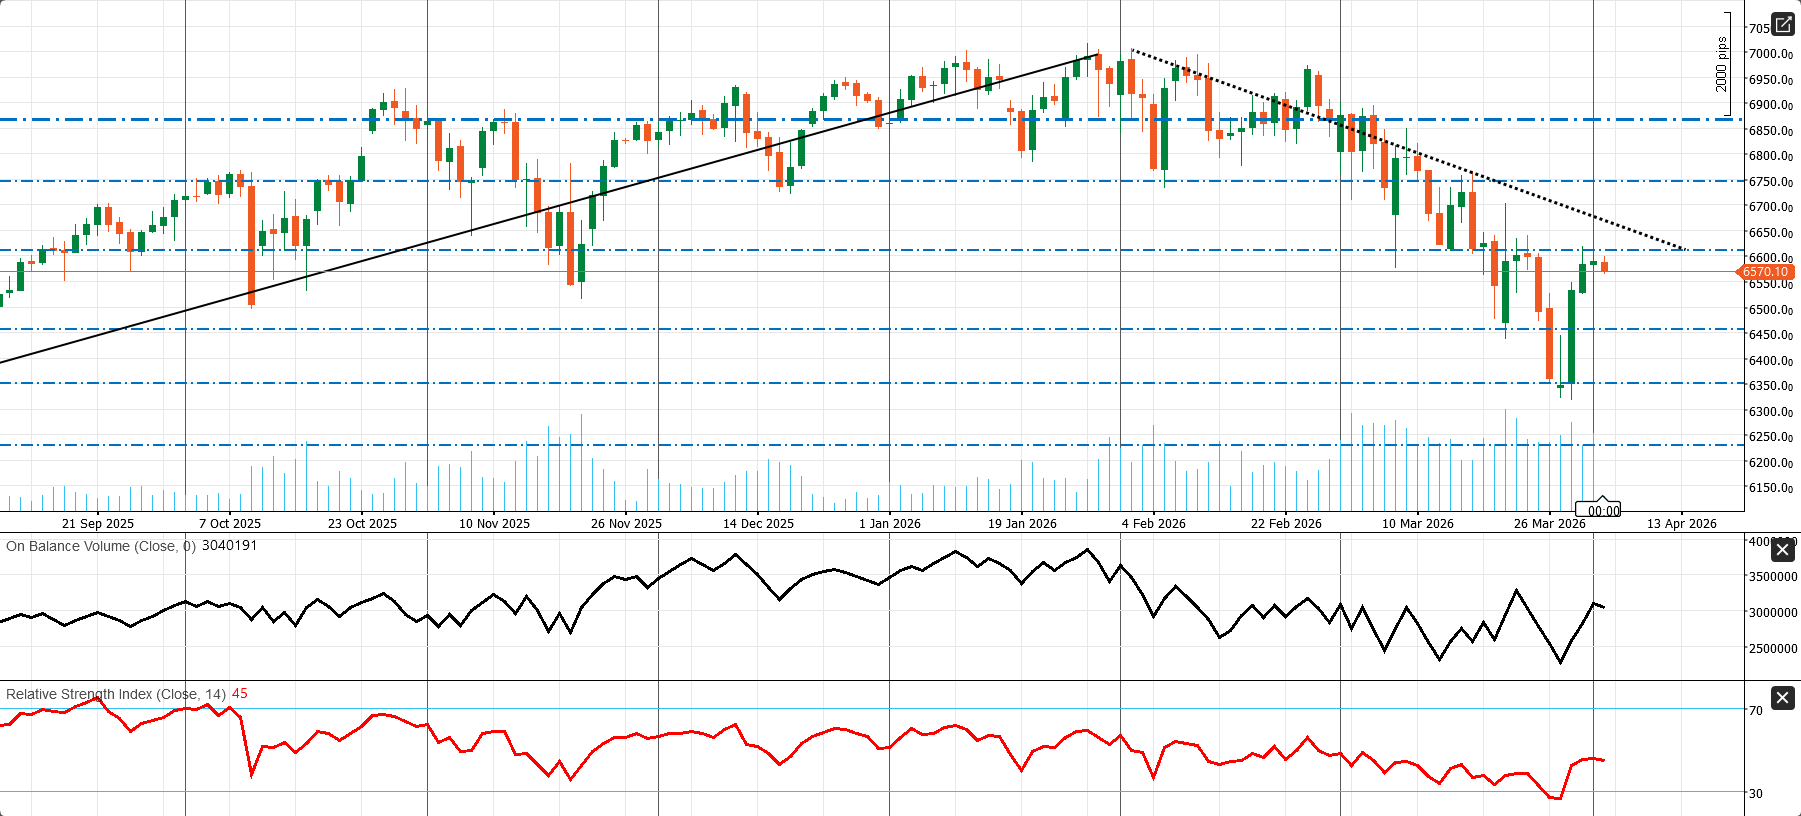
The S&P 500 daily chart still looks cautious to bearish, even after the rebound from the late-March selloff. Price is trading around 6570, but it remains below the broken rising trendline and still under the broader descending trendline from the February high. That keeps the recent recovery looking more like a bounce within a correction than a confirmed trend reversal. The first important resistance zone is 6600–6625. A daily close above that area would be the first real signal that buyers are regaining control. Above there, the next resistance levels come in near 6750 and then 6875. On the downside, 6450 is the first major support, followed by 6350. If that lower zone breaks again, the next downside area to watch is around 6225. Momentum indicators show some improvement, but not a full bullish reset. RSI near 45 has recovered from oversold territory but remains below the neutral 50 line, while OBV has bounced without yet confirming a strong accumulation trend.
Final Assessment
The clearest way to frame the week ahead is this: the dollar still has the better macro foundation, while Wall Street remains tradable but fragile. A strong, broad equity rally likely requires either cooler CPI or cooler oil, and ideally both. Without that, the market is likely to remain selective, with continued pressure on duration-sensitive sectors and better relative support for the dollar. As long as inflation risk stays elevated and the Fed is pushed toward patience, USD bias remains modestly bullish, while Wall Street stays cautious, selective, and highly headline-sensitive.
Central Banks in Focus in the Week Ahead
In the week ahead, attention turns to two central banks that are both expected to leave interest rates unchanged, but whose guidance may carry more market significance than the decisions themselves: the Reserve Bank of India (RBI) and the Reserve Bank of New Zealand (RBNZ). Both meetings are shaping up as tone-driven events, with investors watching closely for how policymakers frame the balance between inflation risks and slowing growth.
For the RBI, the headline expectation is straightforward. The repo rate is widely expected to stay at 5.25%, and markets have largely priced in no change. The real issue is whether the RBI sounds less comfortable with the idea of future easing. India’s latest inflation reading remains relatively contained, with February CPI at 3.21% year on year, still below the central bank’s 4% target and within its tolerance band. But the policy backdrop has become more difficult because of rising crude oil prices, higher freight costs, rupee volatility, and imported inflation risks.
That matters because India is highly exposed to the energy channel. Higher oil prices threaten not only inflation, but also the current account, the currency, and growth. The rupee’s recent weakness, alongside external pressures, means the RBI is likely to emphasize caution and macro stability. The most likely outcome is a hold with a firmer tone rather than any shift toward rate hikes. Markets will read the statement for signs that the central bank is moving away from an easing bias and becoming more defensive in response to oil and FX risks.
For the RBNZ, the Official Cash Rate is expected to remain at 2.25%, but this is not likely to be a routine hold either. Inflation has moved above the target band, oil prices have risen, and inflation expectations have edged higher, while growth remains soft. That combination creates a more complex policy environment. The RBNZ is likely to argue that it can look through the first-round effects of higher energy prices, but markets will want to know how concerned it is about second-round inflation pressure and whether inflation could become more persistent.
The overall message for the week is clear: both central banks are expected to stay on hold, but neither is in an easy position. The RBI is likely to stress vigilance over oil, inflation pass-through, and currency stability, while the RBNZ is expected to keep a balanced stance but sound somewhat firmer than before. For markets, this makes the tone, not the rate decision, the real event.
Gold Market Condition, and Weekly Outlook:
Inflation, the Fed, and Oil Keep Bullion Trapped Between Safe-Haven Demand and Rate Pressure
Gold enters the new week in a difficult two-way macro environment. On one side, unresolved geopolitical tension, war risk, and energy-market stress continue to support safe-haven demand. On the other, stronger U.S. data, firmer Treasury yields, and a stronger dollar are making it harder for bullion to sustain upside momentum. The result is a market that can still spike sharply on headlines, but one that likely needs softer U.S. inflation or a weaker dollar to build a cleaner bullish trend.
Gold’s current market condition is best described as volatile consolidation with a mild macro headwind. It is not trading in a clean trend environment. Instead, bullion is being pulled in opposite directions by two powerful forces. The first is the classic safe-haven bid, supported by the ongoing Iran war, disruption in the Strait of Hormuz, and broader geopolitical uncertainty. The second is the higher-for-longer U.S. rates backdrop, which has become more important as energy prices rise and inflation risks return to the front of the market narrative. That combination leaves gold vulnerable to sharp swings in both directions rather than a stable directional move.
That tension was visible in last week’s price action. Gold rebounded sharply early in the week, with spot gold trading at $4,784.22 per ounce on April 1, its highest level since March 19. That move was helped by a softer U.S. dollar and tentative hopes of de-escalation. But the rebound did not hold. As the dollar strengthened again and broader risk sentiment deteriorated, gold reversed lower. By April 2, bullion was down 1.4% intraday, while most precious-metals markets then closed on April 3 for Good Friday. This kind of price behavior confirms that gold is still highly reactive, but not yet operating in a stable bullish regime.
The core problem for gold right now is that its normal safe-haven support is being offset by oil-driven inflation risk. The war involving Iran and the ongoing disruption around the Strait of Hormuz have pushed energy prices sharply higher. Brent settled at $109.03 and WTI at $111.54 on April 2 after President Donald Trump signaled more attacks on Iran. That matters because higher oil prices do not just raise geopolitical anxiety; they also lift inflation expectations. And when inflation expectations rise, the market becomes less confident that the Federal Reserve can cut rates quickly. That usually supports both the U.S. dollar and Treasury yields, increasing the opportunity cost of holding a non-yielding asset like gold.
That rates headwind became more important again after Friday’s U.S. labor-market data. March payrolls rose 178,000, above the 60,000 consensuses, the unemployment rate fell to 4.3%, the 10-year Treasury yield rose to 4.32%, and the dollar index edged up to 100.08. For gold, that is a difficult combination. Stronger labor data reduce pressure on the Fed to ease quickly, while higher yields and a firmer dollar make gold relatively less attractive. This does not eliminate the metal’s safe-haven role, but it does make the upside harder to sustain unless macro data begin to soften.
The broader picture also remains important. Even though gold has slipped more than 10% since the conflict began, safe-haven demand has still helped prevent a larger fall. In other words, gold has not performed like a pure crisis asset this time because the inflation shock has simultaneously pushed markets to reprice away expected Fed cuts. That has created an unusual environment in which geopolitical stress supports gold, but not strongly enough to fully overcome the drag from the dollar and rates. After January’s peak, gold fell sharply as demand for the U.S. dollar returned and earlier support for bullion faded after Kevin Warsh’s nomination as the next Fed chair. That reinforces the idea that gold is currently trading through the macro-policy channel as much as the geopolitical one.
For the week ahead, the biggest drivers are not gold-specific developments. They are the inflation and Fed calendar. The FOMC minutes from the March 17–18 meeting are due on Wednesday, Core PCE price data are due on Thursday, and the BLS releases March CPI on Friday. These are the key events because gold is extremely sensitive to whether the market concludes that the Fed must remain restrictive for longer. If inflation data come in hotter than expected and the minutes reinforce a patient Fed stance, the macro environment would remain difficult for bullion. If the numbers are softer, gold would have a better chance to recover.
A second major driver is oil. OPEC+ is due to meet on Sunday, April 5, and the group is likely to consider another output increase. In theory, that could help limit further upside in oil if markets believe additional supply is coming. In practice, however, the impact could remain limited while Hormuz stays shut. For gold, that means oil can continue dominating the inflation narrative even if OPEC+ tries to calm the market. If oil remains elevated, inflation expectations are likely to stay firm, and that would continue to pressure gold through the yield and dollar channels.
My base case for the week ahead is neutral to slightly bearish for gold, but with very high headline volatility. The immediate pressure comes from three factors: stronger U.S. payrolls, firmer yields and dollar, and the risk that CPI confirms energy pass-through into inflation. However, I would also expect downside to remain less clean than usual because the war backdrop is unresolved and geopolitical news over the weekend or during the week can quickly revive safe-haven buying. In that sense, gold looks vulnerable, but not one-directionally weak.
The simplest market map is clear. Gold turns bullish if CPI is softer than feared, the dollar loses momentum, or there is a clearer path to reopening Hormuz and easing oil-led inflation pressure. Gold turns more bearish if CPI comes in hot, the FOMC minutes reinforce patience, and the dollar and yields continue rising. The third scenario is a choppy, range-bound week, which becomes the most likely outcome if geopolitics stay tense but macro data do not materially change Fed pricing.
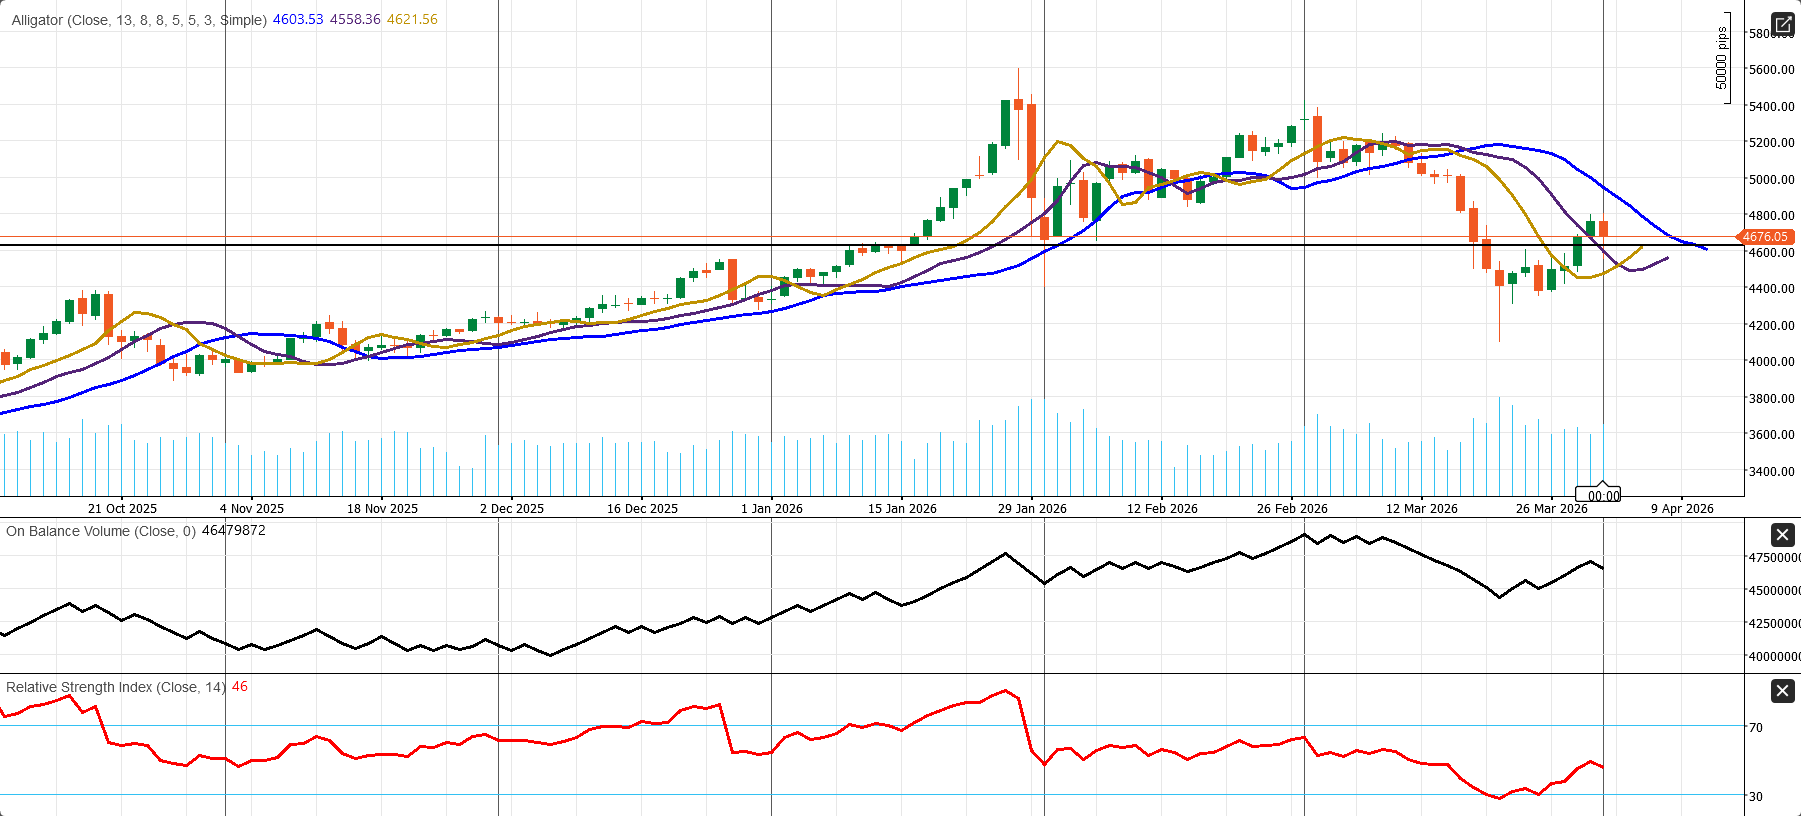
From a technical perspective, gold is attempting a recovery, but the broader daily structure is still fragile rather than clearly bullish. After the sharp late-March selloff, price rebounded and is now trading around 4676, near an important pivot zone. The chart is trying to stabilize after a heavy correction. Above 4700, gold could extend the rebound toward 4800 and then 5000. But below 4600, the recovery weakens again and the market risks slipping back toward 4555 and lower. For now, this still looks more like a bounce inside a damaged structure than a confirmed new uptrend.
Final Assessment
Gold enters the week with headline support from geopolitics, but macro pressure from inflation, yields, and the dollar. That leaves the market in a high-volatility, two-way regime rather than a clean trend. The safest conclusion is that gold still needs help from either softer U.S. inflation or a weaker dollar to regain a more durable upside bias. Until then, bullion remains supported by fear, but constrained by policy and inflation repricing.
Technical Review
The technical indicators support that cautious interpretation. Gold has moved back above the Alligator lines, which is an early sign that selling pressure is easing, but the move is not yet strong enough to confirm a full trend reversal. RSI near 46 shows that momentum has improved from oversold levels, but it remains below the neutral 50 line, meaning bullish momentum is still not fully established. OBV has also bounced from recent lows, supporting the rebound, but it has not yet returned to stronger accumulation territory. The most important levels to watch are 4675–4700 as immediate resistance, 4800 and 5000 as upside targets, 4620–4600 as first support, and 4555 followed by 4400–4320 as deeper downside zones.
Crude Oil Market Review and Weekly Outlook:
Hormuz Risk, OPEC+, and Supply Tightness Keep the Market in a War-Driven Regime
Crude oil enters the new week in a market shaped far more by war risk, shipping disruption, and physical supply tightness than by normal macroeconomic demand signals. As long as the Strait of Hormuz remains constrained, oil is likely to stay elevated, volatile, and highly sensitive to geopolitical headlines, with OPEC+ and the EIA acting as important but secondary drivers.
The current oil market is best understood as a war-risk regime, not a normal macro regime. Price action is not being driven primarily by stronger global growth expectations or a conventional demand rebound. Instead, the market is being led by supply insecurity, shipping disruption, and the fear that the physical movement of crude through the Strait of Hormuz could remain constrained for longer than previously expected. Brent closed at $109.03 and WTI at $111.54 on April 2 after President Donald Trump signaled more attacks on Iran. Reuters also noted that front-month WTI was trading at its largest-ever premium over later-dated contracts and at its highest premium to Brent in a year. That kind of structure is a classic sign of acute near-term physical tightness, not simply speculative enthusiasm.
That tightness is not theoretical. It is real and visible in production and export data. Reuters’ March survey, showed that OPEC output fell by 7.3 million barrels per day month on month to 21.57 million barrels per day in March, the lowest level since mid-2020. The reason was not weak demand or voluntary restraint alone. It was the fact that the war and the disruption around Hormuz forced export cuts, especially from Iraq, Kuwait, Saudi Arabia, and the UAE. At the same time, U.S. intelligence cited by Reuters suggested that Iran is unlikely to ease its chokehold on Hormuz any time soon. This keeps the market focused on transit risk and supply insecurity, rather than on a quick return to normal conditions.
That context makes Sunday’s OPEC+ meeting on April 5 the first major event of the week. The OPEC+ JMMC and eight-country meeting matters because it will shape the market’s expectations for whether producers are willing to respond more forcefully to the current price surge. Official OPEC communication shows that the eight countries had already decided on a 206,000-bpd production adjustment for April and explicitly stated that they retain the flexibility to increase, pause, or reverse the phaseout of voluntary cuts depending on market conditions. The group is now expected to discuss a further output increase for May.
However, the real market question is not whether OPEC+ can announce more supply. It is whether that supply can actually reach the market in a meaningful way while Hormuz remains disrupted. That is the crucial difference. Spare capacity only matters if barrels are exportable. If the main bottleneck is still the Strait itself, then even a new OPEC+ increase may be treated as more symbolic than practical. Any extra barrels are unlikely to materially improve supply conditions before Hormuz reopens. That means the OPEC+ meeting is likely to matter more for signaling and sentiment than for immediate physical relief, unless the group surprises with a much larger or more aggressive response than markets currently expect.
In practical terms, this leaves the market trading off three layers of risk. The first is Sunday’s OPEC+ signaling. The second is the EIA Short-Term Energy Outlook on Tuesday, April 7. The third, and by far the most important, is whether the actual physical situation in Hormuz improves at all. That third factor is still the dominant one. As long as there is no credible improvement in shipping access, insurance conditions, or military security around the Strait, oil is likely to remain highly sensitive to each new headline.
The EIA STEO therefore becomes especially important this week. The April 6–11 period, it is the only major monthly oil-market report due inside the week, while the OPEC Monthly Oil Market Report arrives on April 13 and the IEA Oil Market Report on April 14, both just after the weekends. That gives the EIA report extra weight. In its March outlook, the EIA assumed that shut-in production would peak in early April, forecast Brent averaging $91 in Q2 2026, and still expected prices to fall later in the year once inventories rebuilt and Hormuz flows resumed. But current spot prices are already trading far above that framework. That means Tuesday’s update will be a critical test of whether the EIA materially revises its near-term price outlook, supply assumptions, and disruption timeline.
My base case for the week ahead is elevated, volatile, and headline-driven oil, with the bias still tilted toward upside spikes rather than toward a clean, sustained selloff. The most bullish combination for crude would be the following: OPEC+ delivers only a symbolic increase, the EIA revises balances tighter, and there is no meaningful sign of Hormuz reopening. Under that scenario, prices could remain under strong upward pressure because the market would conclude that supply relief is still more theoretical than real. The less bullish combination would be a more forceful supply message from OPEC+, an EIA outlook that still assumes the disruption eases relatively quickly, and some diplomatic or security improvement that restores confidence in regional shipping. But at the moment, the duration of the Hormuz disruption still matters far more than the size of the next incremental OPEC+ increase.
Final Assessment
The week ahead for crude oil is not primarily about demand, growth, or even normal OPEC management. It is about war risk, shipping security, and whether physical oil can move through Hormuz. OPEC+ and the EIA matter, but for now they remain secondary to the geopolitical reality on the water. That is why crude still looks like a market with high prices, high volatility, and an upside bias, unless there is credible progress on the Strait itself.
WTI Technical Perspective
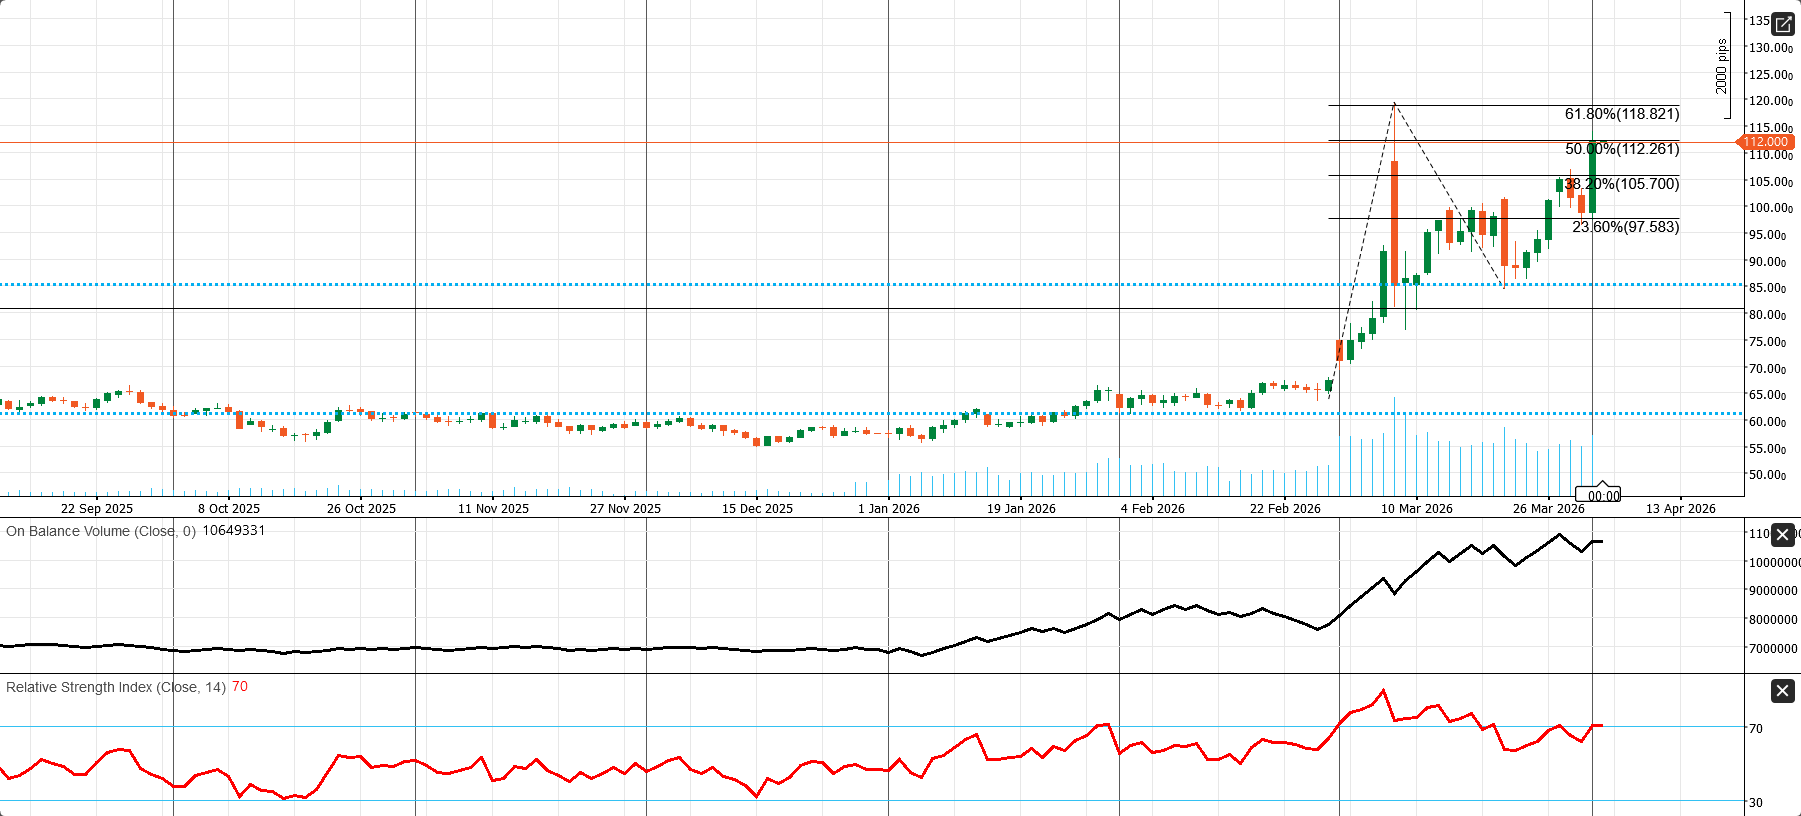
From a technical perspective, WTI remains in a strong bullish trend. The chart shows a sharp breakout from the long base near the 60–65 zone, followed by an impulsive rally into the 120 area. Even after the recent pullback, price has held above key retracement supports and is now trading back around 112, which keeps the broader structure constructive. The main technical focus is the 50% Fibonacci retracement near 112.26. A daily close above that level would strengthen the recovery and expose the next upside target near 118.82. If momentum extends further, the market could attempt a retest of the recent spike high near 120 and above.
On the downside, the first important support sits near 105.70, followed by a deeper support area around 97.58. As long as WTI remains above the 105–106 zone, the recent pullback still looks more like a correction within an existing bullish trend than a full reversal. Momentum indicators support that view. RSI near 70 confirms strong upside momentum, although it also warns that the market is becoming stretched and may remain highly volatile. OBV continues to trend strongly higher, reinforcing the view that the broader move has been supported by real buying pressure rather than a weak rebound.
Bitcoin Market Condition and Weekly Outlook:
Macro Pressure, Softer Flows, and Event Risk Keep Crypto in a Cautious Range
Bitcoin enters the new week in a cautious, range-bound, and macro-driven market environment. While long-term institutional interest remains intact, short-term price action is being shaped far more by oil, the U.S. dollar, Federal Reserve pricing, and geopolitical risk than by crypto-native optimism. That leaves BTC vulnerable to event-driven volatility and makes confirmation from flows, risk sentiment, and macro data more important than price alone.
The current crypto market condition is best described as cautious, range-bound, and heavily influenced by macro forces. Bitcoin is trading around $66,983, while Ethereum is near $2,053.73, and that pricing behavior is consistent with the broader risk backdrop. Renewed escalation in the Iran war supported the U.S. dollar and weakened overall risk appetite, with both bitcoin and ether falling alongside other risk-sensitive assets. In this phase, crypto is behaving more like a high-beta risk asset than a traditional safe haven. That is an important distinction, because it means digital assets are currently trading less on their own internal narratives and more on the same macro pressures shaping equities and other speculative assets.
That cautious tone is also visible in the flow picture, which has softened after a stronger period earlier on. The CoinShares reported the first outflows from digital-asset investment products in five weeks, totaling $414 million, with bitcoin alone accounting for $194 million of those outflows. Even so, bitcoin remains positive on a year-to-date basis at $964 million, which suggests the longer-term allocation story has not broken. The more immediate message is that institutional demand is becoming more selective rather than aggressively trend-following. That same pattern appears in U.S. spot bitcoin ETF flows. According to the figures, inflows were +$69.4 million on March 30 and +$117.5 million on March 31, but then turned to -$173.7 million on April 1, followed by just +$9.0 million on April 2. This does not signal capitulation, but it does show that momentum has become less stable and that buyers are no longer chasing strength in a simple one-directional way.
One of the more constructive crypto-specific developments in the background is Circle’s launch of cirBTC, a new 1:1 Bitcoin-backed wrapped token that begins on Ethereum. This is an important infrastructure story because it marks Circle’s expansion beyond stablecoins such as USDC and EURC and into the tokenized bitcoin market. The Circle is targeting institutional users, including OTC desks, market makers, and lending platforms, while positioning cirBTC as a more secure and neutral product that allows bitcoin holders to use BTC more efficiently in DeFi, including for lending, borrowing, and liquidity provision. Circle also plans to extend cirBTC beyond Ethereum to its Arc Layer-1 blockchain and Circle Mint, suggesting a wider strategy to connect traditional finance, centralized crypto infrastructure, and decentralized finance. That may not be an immediate price catalyst for the week ahead, but it is a potentially bullish long-term infrastructure development for the broader crypto market.
For the week ahead, however, macro is likely to dominate far more than crypto-specific news. The key events are OPEC+ on April 5, ISM Services on April 6, FOMC minutes on April 8, and U.S. CPI on April 10. The market focus is inflation, especially with oil still elevated after the Middle East shock. That matters directly for bitcoin because stronger inflation pressure tends to push out Federal Reserve rate-cut expectations, support the U.S. dollar, and tighten financial conditions for speculative assets. In other words, bitcoin’s near-term path is still being shaped by the same macro equation driving rates, FX, and broader risk sentiment.
That macro equation is working in multiple directions at once, which helps explain why the market remains indecisive. On one side, there are signs of slowing growth momentum, some cooling in the labor market, and weaker activity trends that could, over time, push the Fed toward a more dovish stance. On the other side, there is still a meaningful risk that tariffs, energy prices, and broader cost pressures push inflation back up. This creates a difficult policy mix. If growth weakens, markets may revive expectations for rate cuts. But if inflation remains sticky, the Fed is unlikely to ease policy quickly. That unresolved tension is a major reason why bitcoin remains volatile and range-bound rather than directionally confident. The market has not yet decided which side of the growth-versus-inflation equation will dominate.
My base case for BTC this week is neutral to slightly cautious, but with high event-driven volatility. If oil stays high, CPI comes in hot, and the FOMC minutes reinforce a patient or mildly hawkish Fed tone, the dollar could remain firm and bitcoin may struggle to break cleanly higher. By contrast, if inflation surprises on the softer side, geopolitical tension eases, and ETF flows stabilize, bitcoin has room to recover alongside the rest of the risk complex. This does not mean BTC lacks longer-term support. It means the immediate environment is still dictated by macro conditions first and crypto sentiment second.
The cleanest way to frame the market is this: Bitcoin is still supported by long-term institutional participation, but short-term trading is being driven by oil, the dollar, Fed pricing, and headline risk. As long as those macro variables remain unstable, rallies should be treated as requiring confirmation from both risk sentiment and ETF/flow stability, not just from price itself. That is especially important in an environment where sharp rebounds can quickly fade if macro data move against risk assets.
Final Assessment
Bitcoin enters the week with a fragile short-term structure, softer flow momentum, and a market environment still dominated by inflation, oil, the dollar, and the Fed. That leaves BTC in a range-bound but highly reactive regime, where macro events matter more than crypto-specific headlines in the near term. The longer-term institutional story remains alive, but for this week, a sustained upside move likely needs help from softer inflation, a less aggressive dollar backdrop, and stabilizing ETF demand. Until then, caution remains the cleaner stance.
BTCUSD Technical Perspective
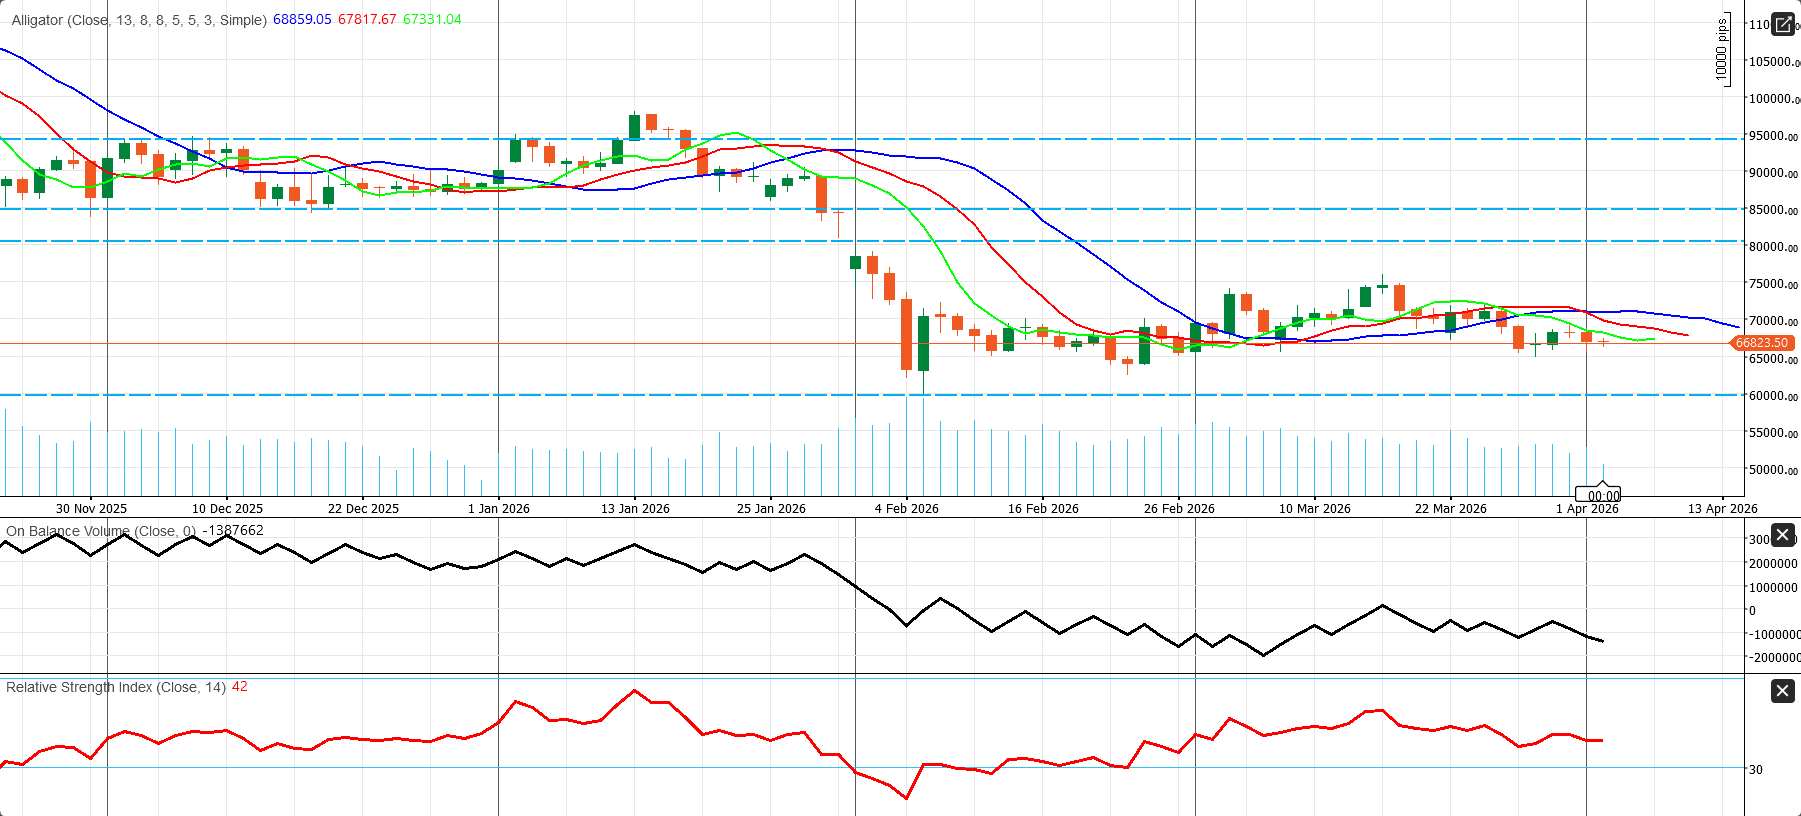
From a technical perspective, the BTC/USD daily structure remains neutral to bearish. Aafter the sharp breakdown from the 90k–95k zone in early February, bitcoin shifted into a lower trading range and is now sitting around 66.8k, below all three Alligator lines. That keeps the short-term bias under pressure. The chart suggests BTC is still in a fragile structure. Above 68.9k, the market can stabilize and potentially move toward 70k–72k. Below 65k, downside pressure could build again toward 60k. The broader structure still looks more like a consolidation after breakdown than the start of a new bullish leg.
The underlying indicators reinforce that cautious view. RSI near 42 shows that momentum is still weak and remains below neutral, meaning buyers have not fully regained control. OBV is still negative and drifting lower, suggesting that accumulation remains limited. The key levels to watch are 65k–66k as immediate support, 60k as the main support below, 67.3k–68.9k as first resistance, and then 70k–72k followed by 75k as the higher resistance zone.
Comments