 English
 پارسی


US Economy, USD, and Wall Street
A headline-driven week where Fed messaging, mega-cap earnings guidance, and Washington policy risk set the tone for USD, rates, and equity duration. With Q4 GDP and PCE delayed to Feb. 20, the market’s focus shifts to FOMC nuance, labor proxies, inflation pipeline (PPI), and heavy Treasury supply, while earnings guidance—especially AI capex vs. payoff—becomes the main cross-asset catalyst.
Weekly Review - Week ending Friday, Jan. 23, 2026
The week reinforced a “moderate expansion / late-cycle normalization” baseline rather than a re-acceleration story. Headline-driven trade policy volatility dominated price action early, but the subsequent climb-down helped stabilize risk sentiment into week-end. Under the hood, activity data held in expansion, consumer tone improved, and labor indicators remained firm—while forward-looking signals (leading indicators, softening income growth, and policy-driven inflation risk) kept the macro debate centered on how long the Fed can stay restrictive without unnecessarily compressing growth.
1) Macro pulse: growth still firm, but forward signals remain mixed
- PMIs: January S&P Global PMIs were broadly steady and consistent with continued expansion. The Composite PMI held at 52.8 (vs. 52.7 prior), with Manufacturing at 51.9 and Services at 52.5—solidly expansionary, but not an upside breakout.
- Consumers: The University of Michigan final January read showed sentiment improving to 56.4 (from 52.9), with expectations and current conditions also rising—an incremental positive for the “soft-landing” narrative even if absolute levels remain subdued.
- Forward indicators: The Leading Index at -0.3% m/m (Nov) remained negative, keeping the “late-cycle / slowdown risk” narrative alive—particularly if financial conditions tighten again via renewed risk-off shocks.
Bottom line: Growth remains on a positive trajectory, but the mix still looks like steady expansion with late-cycle crosscurrents, not a clean re-acceleration.
2) Inflation and rates: near-term expectations eased, but policy uncertainty kept a floor under price pressure
- Inflation expectations (Michigan): The 1-year view eased to 4.0%, while 5-year expectations held at 3.3%—still elevated enough to matter for the Fed’s “anchoring” lens, but not pointing to a renewed inflation surge.
- Cost pressures (PMI commentary): The week’s survey narrative kept price pressures sticky, with firms citing import-tariff-related costs and elevated prices paid/charged indices. This is important because it frames inflation risk as partly policy-driven rather than purely demand-driven.
- Rates behavior: In practice, rates traded more off headlines than data. Treasury yields moved with geopolitical risk appetite modest flight-to-safety tone early, then a partial retracement as tariff threats were walked back.
Bottom line: Inflation is easing at the margin, but policy uncertainty (tariffs, trade posture) acts as a structural upside risk to goods inflation and term premium—keeping the market’s “rates floor” intact.
3) Labor and the “soft landing” backbone
- Claims: Initial jobless claims at 200k and continuing claims at 1.849m are consistent with a labor market that is not cracking materially—supportive of “growth holds, inflation cools gradually.”
- PMI labor tone: Employment looked closer to stagnant than booming, but importantly not collapsing—more consistent with late-cycle normalization than recession dynamics.
Bottom line: The labor picture remains the core pillar for the soft-landing narrative: not overheating, not breaking.
4) Household engine: resilient spending, thinner savings buffer
This week’s narrative emphasized that household demand remains remarkably resilient, with real consumer spending up 0.3% m/m in both October and November (released together due to prior publication disruptions). That keeps Q4 consumption tracking constructive: Q4 real PCE growth around 2.7% annualized, only modestly softer than Q3’s 3.5% pace.
However, the quality-of-growth nuance is important:
- Income growth lagged spending in both October and November, pushing the personal saving rate down to 3.5% (a three-year low).
- With wage growth moderating amid softer labor fundamentals, the near-term question becomes whether consumption can remain this resilient without rebuilding the savings cushion. Potential offsets from tax relief/timing effects (refunds and policy changes under the “One Big Beautiful Act”), can support household cash flow in 2026.
Bottom line: Consumption is still doing the heavy lifting, but the lower saving rate increases sensitivity to shocks (rates, jobs, confidence, and policy headlines).
5) Inflation detail: progress continues, but a “tariff bump” risk remains
- Core PCE (Oct–Nov): Core PCE rose 0.2% m/m in both October and November, bringing the 3-month annualized pace to 2.3% and the y/y rate to 2.8%.
- December estimate: We estimate core PCE +0.36% m/m in December, which would nudge the y/y rate toward ~3.0%—a step in the wrong direction, but still broadly consistent with “higher-for-longer disinflation” rather than a full reflation cycle, especially given the additional tariff-related goods-price pressure.
Bottom line: Disinflation is intact, but the Fed’s job is harder when some inflation risk is policy-induced, not purely cyclical.
U.S. Outlook (Week Ahead): Jan 26–31, 2026 — USA, USD, Wall Street
What will drive markets?
FOMC (Jan 27–28) is the week’s central macro catalyst, with the rate decision and Chair press conference on Wednesday, Jan 28. However, we should not forget about earnings reports, as about one-fifth of the S&P 500 reports, including multiple mega-cap names; markets will focus on guidance quality (especially AI capex vs. payoffs).
On the other hand, the data calendar is “lighter than it looks” because BEA delayed both Q4 2025 advance GDP and Dec 2025 Personal Income & Outlays (incl. PCE inflation) to Feb 20 (originally Jan 29).
Rates/duration remain sensitive to Fed-independence narrative and Washington policy headlines (tariffs/geopolitics), keeping USD and equity multiples headline-dependent. Treasury supply is meaningful early in the week (bills + 2Y/5Y/FRN + 7Y), which can matter for front-end pricing into the Fed.
Macro backdrop going into the week
Recent survey signals point to a modest expansion, but with sticky price pressures and softer labor signals in the same datasets (tariff-related cost pressures are a recurring theme in reporting). Consumers' sentiment improved in January, and inflation expectations eased somewhat helpful for the Fed’s “disinflation credibility,” but not decisive on its own. Recent reporting on the housing market highlights ongoing rate/affordability constraints and policy uncertainty affecting turnover and demand. About the Fed, we will talk later; however, we think that the base case is no change at this meeting, with cuts pushed later (if at all) in the near term.
The U.S. calendar — day by day in the week ahead
- Monday, Jan 26: Durable Goods Orders (Nov) - Treasury auctions: 13W & 26W bills and 2Y note auctions are scheduled.
- Tuesday, Jan 27: Conference Board Consumer Confidence (Jan) - S&P Case-Shiller Home Price Index (release day), next release listed for Jan 27 - Treasury auction: 5Y note auction (and a 6-week bill auction is also on the schedule).
- Wednesday, Jan 28: FOMC rate decision, Powell press conference - Treasury auction: 2Y FRN auction - EIA Weekly Petroleum Status Report — next release date Jan 28 -
- Thursday, Jan 29: Initial Jobless Claims - BLS Productivity & Costs (revised, Q3 2025) - Treasury auction: 7Y note auction (and additional bills are scheduled).
- Friday, Jan 30: BLS Producer Price Index (Dec 2025) - Chicago Business Barometer (Chicago PMI, Jan)
Note: Many desks typically expect GDP and PCE around this week, but BEA has moved Q4 advance GDP and December Personal Income & Outlays (incl. PCE) to February 20, 2026. That shifts the “hard growth + inflation” debate into February; this week is more about Fed messaging + labor proxies + inflation pipeline (PPI).
Durable Goods Orders (Monday)
We expect headline durable goods orders to increase 5.4% m/m in November. Boeing order data indicate that new net aircraft orders improved meaningfully after a soft October, which should provide a material lift to the top-line print. More importantly, incoming indicators suggest orders are beginning to broaden beyond a narrow, high-tech-led profile that characterized much of the year—an encouraging sign for the underlying capex cycle.
Looking ahead, we anticipate further broadening in the coming months. While trade-policy uncertainty remains a persistent headwind, the fiscal backdrop is turning more supportive. The One Big Beautiful Bill Act should bolster business investment via permanent bonus depreciation and other tax provisions that improve the economics of expenses and deductions. High-tech investment is still likely to be the primary driver of capex in 2026, but traditional investment appears to be stabilizing and improving at the margin.
Trade Balance (Thursday)
Visibility into near-term trade dynamics remains limited, as advance merchandise trade data have not been published since the government shutdown. That said, imports have generally been soft since Liberation Day; given the recent resilience in retail sales, a rebound in import volumes appears likely. The key question is timing: firms may be delaying orders while they wait for clearer guidance on tariff policy, which complicates near-term forecasting.
Against that backdrop, we look for a modest narrowing in the trade deficit to $23 billion in November. Stepping back, the broader trend toward a smaller deficit largely reflects normalization after the sharp widening seen early in 2025. The more strategic issue is how trade flows and supply chains will reconfigure under a higher-tariff regime. Markets should monitor the Supreme Court’s final ruling on tariffs implemented under IEEPA, as it could materially influence the policy outlook and the trajectory of import demand.
USD: headline barometer with a rate “floor.”
The USD’s weekly narrative was less about rate differentials and more about confidence and policy credibility. When President Trump’s Greenland-linked tariff threats escalated, markets treated it as a potential renewed transatlantic trade shock, pressuring US assets broadly and weighing on the dollar in tandem with equities and bonds.
Later, when Trump walked back the tariff threats and signaled that he would not use force (and framed a “framework” with NATO), risk appetite improved, and the dollar’s downside pressure eased.
A notable undercurrent was the visible European institutional reassessment theme: Reuters reported a Danish pension fund moving to divest US Treasuries, highlighting how geopolitics and fiscal optics can feed into marginal allocation decisions—another channel that can weigh on the USD during periods of policy uncertainty.
In the week ahead, USD and equities remain joined at the hip via rates: any Fed communication that reinforces a higher-for-longer floor can pressure duration-heavy equity exposures and support USD; a more comfortable disinflation tone can do the opposite—unless headlines reintroduce tariff risk premium.
USD Index (DXY) Daily Technical Read
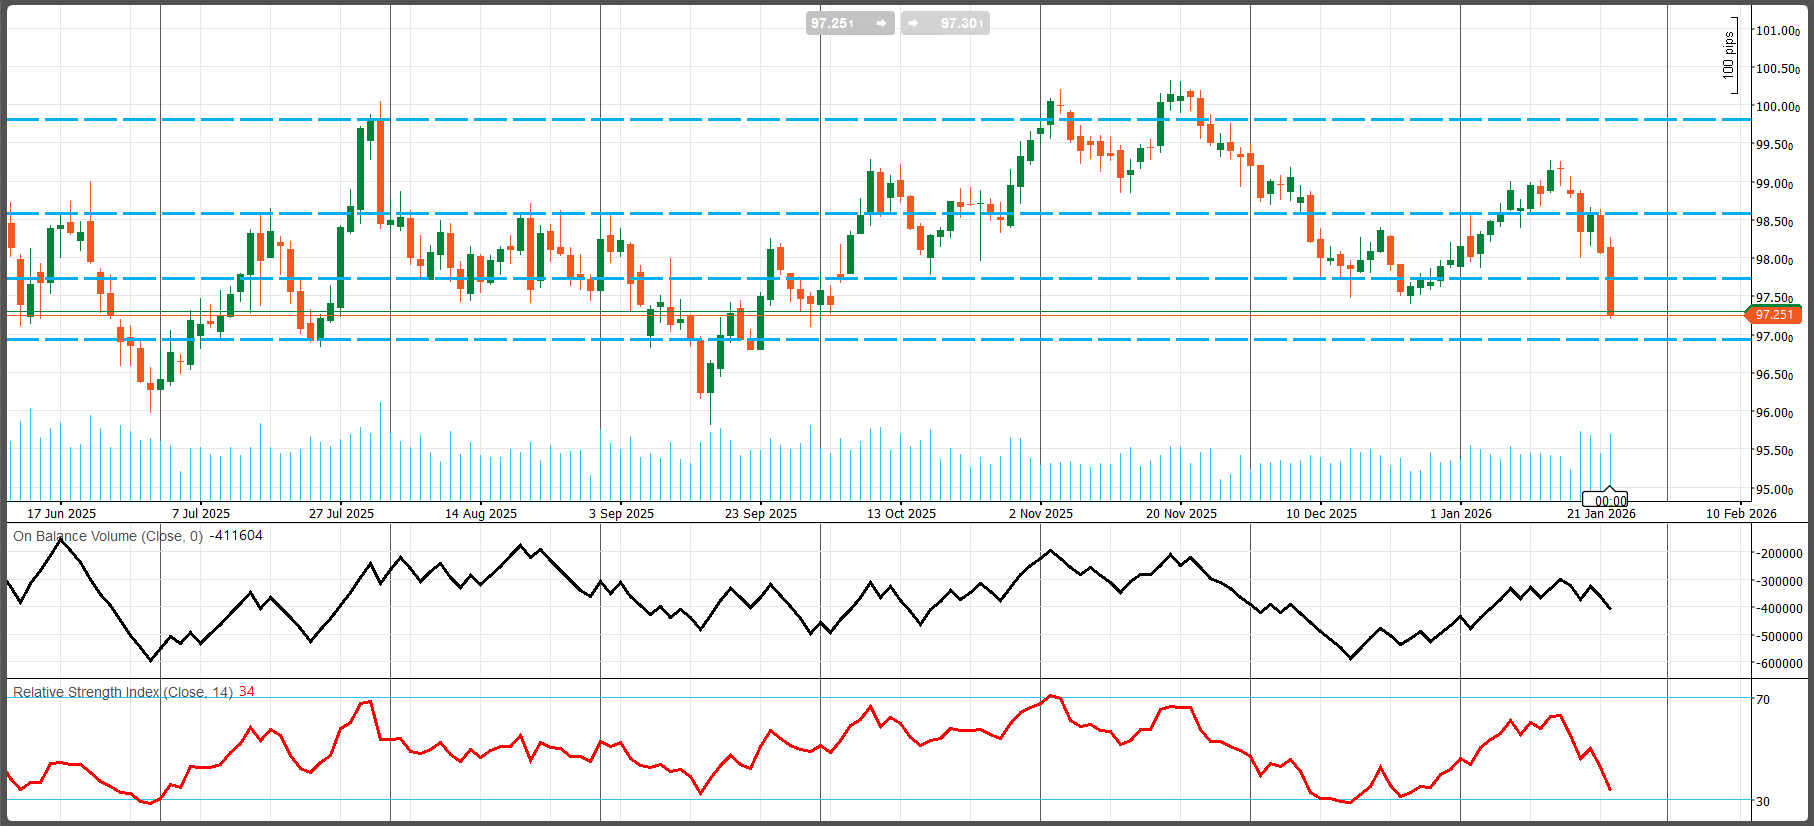
Since the November peak near 100.0–100.5, DXY has been in a downward rotation with lower highs and repeated failures to hold above the 98.6–99.2 supply zone. The latest move is a sharp bearish impulse that breaks down from the January upswing and pushes price back into (and slightly below) the 97.5 pivot area, shifting the near-term bias bearish.
Momentum and participation (RSI + OBV)
RSI (14) ~34: Momentum is bearish and approaching the 30 oversold band, which often precedes short-covering / mean-reversion bounces. However, RSI is not yet at an extreme, so the downside can still extend before a durable reversal.
OBV: OBV rolled over after the January rebound and is now turning lower again, suggesting distribution / weaker participation on upswings and lending credibility to the downside break.
Key levels
- Support: 97.0–97.2 is the First major support zone. A daily close below ~97.0 would be a clean confirmation of breakdown. Next supports: 96.4–96.6, as the Prior swing support (summer/lower-range area), and then ~96.0–96.2: Deeper range floor from earlier lows—likely the next “magnet” if 97.0 gives way.
- Resistance: 97.5–97.8 is the former support/pivot; now first resistance. Any bounce that stalls here keeps the tape heavy. Higher resistances are 98.0–98.2, the prior consolidation shelf, and then we have 98.6. Well-defined supply/resistance band on the chart. Above that, 99.2–99.5, then 100.0–100.5, are the major overhead supplies from prior peaks.
Wall Street:
Sharp drawdown on policy shock, rebound on de-escalation—net, a headline-driven tape
A steady-growth macro tape collided with policy-driven volatility, leaving the soft-landing narrative intact, but keeping the Fed path and risk premia highly headline-dependent. The equity tape behaved like a market that is not fundamentally weak but is highly sensitive to policy shocks that hit confidence, risk premiums, and cross-border capital flows.
Equities suffered their most acute risk-off episode when the Greenland tariff threat hit. Bloomberg’s wrap described a broad selloff across stocks, bonds, and the dollar, alongside a surge in safe havens.
S&P 500 -2.1%, Dow -1.8%, Nasdaq -2.4%, with volatility repricing (VIX higher) and crypto notably underperforming. Then came the relief pivot. On Thursday, Jan. 22, US equities rose as investors responded to Trump’s tariff walk-back; AP reported the S&P 500 up 0.5%, Dow +0.6%, Nasdaq +0.9%, while noting that for the week the major indexes were still only modestly changed overall (S&P and Nasdaq slightly down, Dow roughly flat).
S&P 500 — Daily Technical Analysis
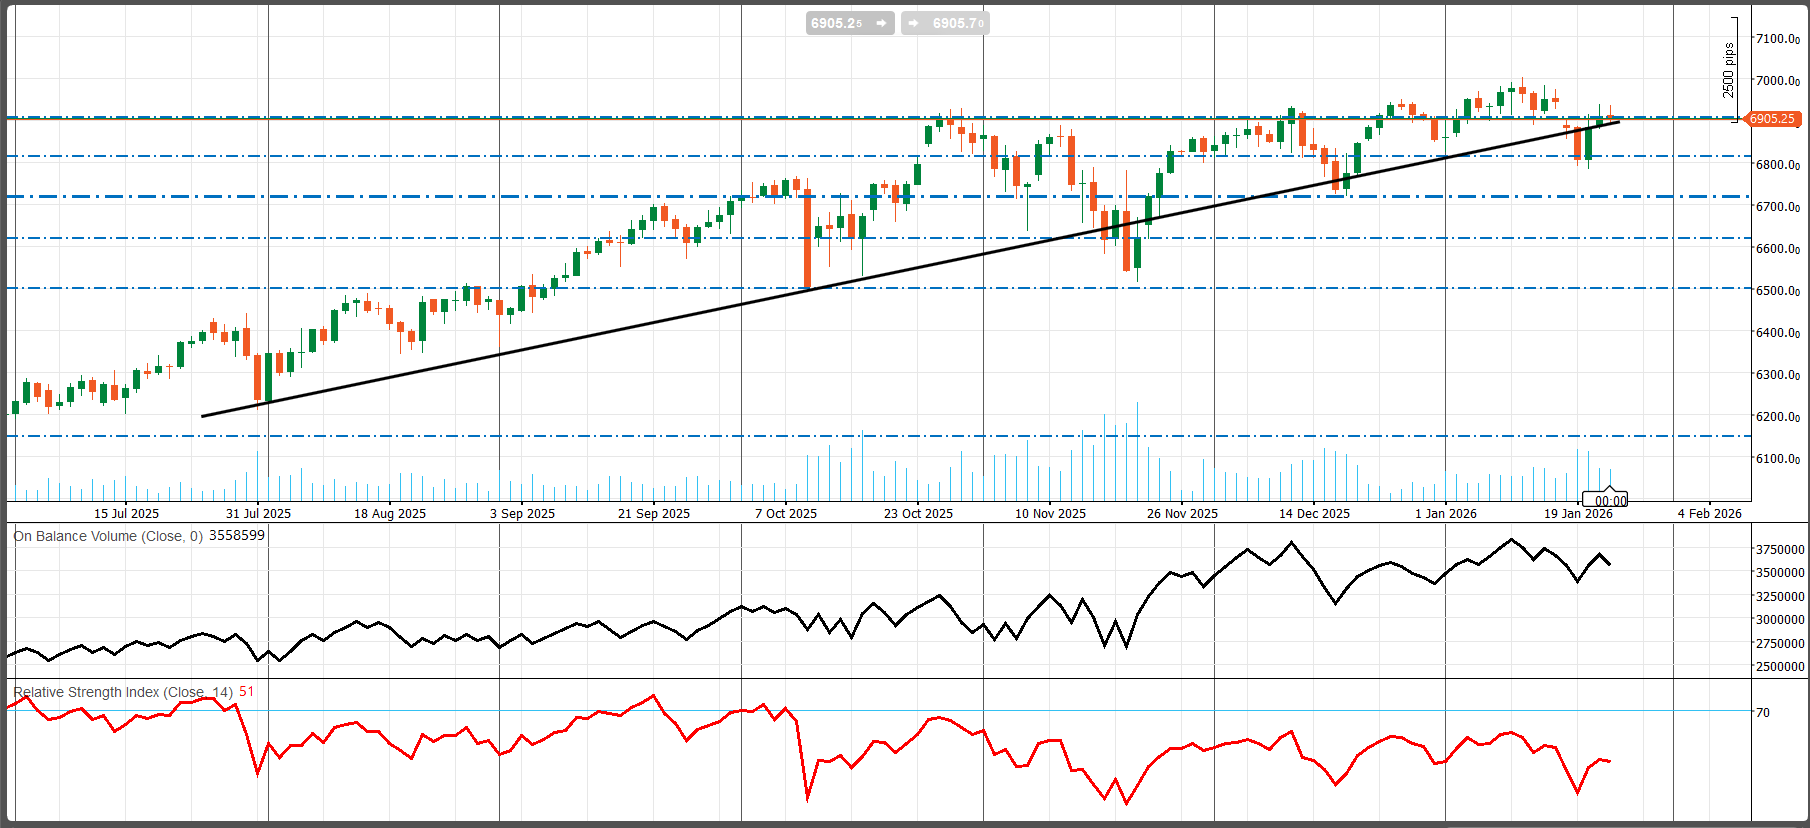
The dominant trend is still up, yet the price is sitting at a high-importance junction (trend support vs. 6,900 resistance). Expect a range-to-breakout dynamic: the next meaningful move is likely to be dictated by whether the index can hold above 6,900 (bull case) or lose 6,850/6,800 (bear case).
The market remains in a well-defined uptrend since mid-2025, with price respecting a rising trendline (black diagonal support) and making higher lows across the period. Currently, price is compressing into a key inflection zone where rising trend support meets horizontal resistance near ~6,900. This is a classic “decision point” structure (often behaves like an ascending triangle / tightening range).
Momentum and participation (RSI + OBV)
RSI (14) ~51: Momentum is neutral—not overbought, not oversold. This typically implies room for expansion in either direction once price breaks the current compression.
OBV: OBV has trended higher over the broader period (constructive accumulation), but it has flattened/rolled recently. That signals buyers are still present, but upside follow-through needs fresh participation to clear resistance cleanly.
Key levels
- Resistance: ~6,900 (pivot/ceiling) is the immediate support, as the price repeatedly interacts with this area. A daily close above ~6,900–6,930 would be the first confirmation that supply is being absorbed. Above that, we have ~7,000–7,050, the psychological + chart resistance zone. A break/hold above here would typically re-open trend continuation.
- Support: Trendline support (~6,850–6,900 area depending on the day). This is the “line in the sand” for the current uptrend structure. Then ~6,800 is the first horizontal support below the trendline/pivot zone. Next supports (if 6,800 fails) are ~6,700, ~6,600, and ~6,500 (major structural shelf on chart)
Central Bank Meetings (Jan 25–31, 2026) Overview
Between 25 – 31 January 2026, three major central banks – the U.S. Federal Reserve, Bank of Canada, and the Central Bank of Brazil (Banco Central do Brasil, BCB) – will hold policy meetings. Their decisions will set the tone for early‑2026 monetary policy and have broad spill‑over effects on financial markets and the global economy.
All three central banks—the U.S. Federal Reserve, the Bank of Canada, and the Central Bank of Brazil—are poised to keep their policy rates unchanged in meetings held between January 25 and 31, 2026. The Federal Reserve will likely maintain its 3.50–3.75% target range due to solid economic growth and inflation still above target, despite political pressures and divergent views within the FOMC. The Bank of Canada is expected to hold its rate at 2.25%, with analysts emphasizing a cautious stance while monitoring core inflation and mixed growth signals. In Brazil, economists anticipate the Copom will keep the Selic rate at 15%, with a Reuters poll showing most expect the first cut to occur in March amid improving but still elevated inflation expectations. Thus, the week’s meetings will likely underscore patience and data-dependence across the region’s major central banks, setting the stage for potential easing later in the year
Fed: “No change” expected, but the path is the story
January FOMC is likely to hold, in line with consensus.
The U.S. Federal Reserve (FOMC) currently maintains the federal funds target range at 3.50–3.75%, following a 25-basis-point rate cut delivered in December. The FOMC will hold a two-day policy meeting on January 27–28, with the policy statement scheduled for release on January 28, followed by Chair Powell’s press conference.
Comments from President Trump and the pending selection of a new Fed chair may add political heat; Reuters reported concerns that political interference could undermine the Fed’s independence.
While about holding rates, we have no doubts, the bigger issue is forward guidance and reaction function:
- Inflation above target versus unemployment slightly above many estimates of full employment keeps the “balance of risks” contested.
- Debate over neutral rate and how restrictive policy truly remains live.
- Rate-sensitive sectors (Residential and nonresidential construction) continue to show constraint from elevated financing costs.
Our baseline remains two 25bp cuts (March and June), but I should appropriately highlight that the bar for easing has risen, with risks skewed to later and possibly less easing in 2026. Generally, the Fed’s direction may still be toward easing in 2026, but the timing and cadence are now the dominant uncertainty.
Economic backdrop
The U.S. economy entered 2026 with solid momentum. Real GDP expanded 4.3 % in Q3 2025, and economists in a Reuters poll expect growth to average around 2.3 % in 2026. However, inflation remains above the Fed’s 2 % target, and the unemployment rate hovers near 4.5 %. Political tensions have risen as President Trump criticized Chair Jerome Powell and the Justice Department threatened a criminal investigation into Fed building renovations. Uncertainty about Powell’s successor (his term ends in May) complicates the policy outlook.
Expectations for the January meeting
Strong economic growth and inflation above target argue against further cuts. Many FOMC members remain divided on the timing and extent of future easing; some hawkish officials worry about persistent inflation, while dovish members emphasize potential labour‑market weakness.
According to MNI, markets assign only a ≈3 %, and CME Group FedWatch tools, less than 5% probability of a fourth consecutive 25‑bp cut at the January meeting, and expect the next easing by July. KPMG similarly sees a solid consensus for a pause and forecasts three cuts in 2026 starting in June.
All 100 economists in a Reuters poll expect the FOMC to hold the federal‑funds rate at 3.50 % – 3.75 % at the Jan 27–28 meeting. Fifty‑eight percent anticipate no change for the entire quarter.
FOMC divisions:
We should note that the Committee is split into three camps. A dovish wing believes labour‑market softening warrants additional cuts; a hawkish wing emphasizes inflation risks and would not rule out hikes; and a centrist group (including Powell) favors a cautious, data‑dependent approach. Without a fresh Summary of Economic Projections, the statement is likely to reiterate that “adjustments to our policy stance … will depend on incoming data and the balance of risks”.
Since the holding rate is priced in the market, we have to watch other market drivers:
- Statement language: Analysts will parse any changes in the policy statement. MNI suggests the FOMC could acknowledge reduced near‑term concerns over the labor market while still emphasizing data dependence.
- Outlook: Many economists expect two or more rate cuts in 2026, but disagreement about timing persists. The January meeting could set the stage for decisions at the March and June meetings.
Bank of Canada (BoC) — January 28 Policy Preview
The Canadian economy is still absorbing the fallout from tariffs and a more strained relationship with the United States. Domestic demand signals remain soft: retail sales have slipped into negative territory, and the labour market continues to show pockets of weakness. With consumer activity subdued—driven by slower job momentum and persistent uncertainty tied to U.S. relations—Canada’s growth outlook for the year looks restrained. This backdrop naturally raises the question of whether the Bank of Canada could eventually return to easing.
A rate cut in January remains unlikely. Governor Tiff Macklem is expected to express a degree of confidence that current policy settings are appropriately restrictive, but the tone may become slightly more open to the idea of restarting cuts if the downside growth risks intensify. Markets are not priced for significant Canadian policy easing this year, so even modest “cut optionality” in the statement or press messaging could move rates quickly, while keeping the Canadian dollar capped. For now, the base case remains a hold, but the balance of risks is becoming more two-sided than it appeared earlier.
Policy Backdrop Heading into the Meeting
By the end of 2025, the BoC held its overnight rate at 2.25%, citing easing inflation and a desire to assess the lagged impact of prior tightening. Inflation dynamics have been improving overall, but not cleanly. Headline CPI slowed to 2.2% in October before edging up to 2.4% ahead of the January decision window. Core inflation—more important for policy—continued to moderate, reinforcing the argument for patience rather than urgency. Meanwhile, growth signals have been mixed: labour market cooling points to a slower trajectory, but upside seekers in output are still plausible. Housing remains rate-sensitive, though pressure from variable-rate mortgages has eased from prior peaks.
Expectations for the January 28 Decision
The market consensus is strongly aligned around a hold at 2.25% on January 28. The prevailing view is that keeping rates unchanged allows earlier tightening to continue working through the economy and avoids confusing signals while inflation is close to target but still exposed to short-term volatility. The BoC is therefore expected to maintain a “wait-and-see” posture, emphasizing that future moves will remain conditional on incoming data and the risk balance.
Key Considerations for the BoC
- Inflation is near target but not fully settled. While headline CPI is close to 2%, policymakers will remain focused on core measures and the risk that short-term volatility distorts the inflation path.
- The data flow is mixed. High rates may continue to restrain spending and weaken growth further, but stronger activity prints could delay any eventual pivot back to cuts.
- Forward guidance matters. Investors will watch closely for any subtle shift—from confidence in the current stance toward an explicit recognition that cuts could re-enter the conversation if the economy underperforms.
Market Implications
If the BoC holds rates, variable-rate mortgage pricing should remain broadly steady in the near term. The more important market driver will be tone: any hint that policy easing could resume sooner than expected could push front-end Canadian yields lower and weigh on the CAD. Conversely, a surprise hike would likely require a clear and persistent re-acceleration in inflation, especially through wages and housing-linked services, which is not the central scenario.
Issues to Watch Closely
- Monetary Policy Report (MPR): The January meeting includes the quarterly MPR, which will be a major catalyst. Markets will focus on revised inflation and growth projections, and how the BoC frames the risk distribution.
- USMCA renegotiation risk: The outlook is unusually sensitive to trade-policy direction. Any meaningful shift in the trajectory or tone around USMCA renegotiations could alter the BoC’s risk assessment and policy bias.
Central Bank of Brazil (BCB) — January 26–27 Policy Preview
Brazilian policymakers are increasingly discussing the conditions for policy easing, but a January rate cut still looks premature. Inflation has improved materially, shifting from a high-and-rising regime to a softer trajectory that has moved headline CPI back within the Central Bank’s tolerance band. The disinflation narrative has been helped by two reinforcing factors: fiscal stimulus has not arrived in force from the Lula administration, and the Brazilian real has been firm into early 2026—both of which support further cooling in price growth. As a result, the more likely strategy for Copom is to hold rates in January while preparing the ground for an initial cut in March, assuming the data continues to evolve in line with an easing pivot.
Even if the easing cycle begins, the central bank is likely to pursue a more gradual and cautious path than what markets are currently pricing. Policymakers remain sensitive to the risk that fiscal policy could loosen as the 2026 election cycle approaches, potentially reintroducing inflation pressure. In addition, a mid-year rebound in the U.S. dollar could weaken the real, interrupting the currency-driven disinflation impulse and complicating the inflation outlook. For these reasons, while markets appear positioned for aggressive easing over the next 12 months, the central bank’s reaction function suggests a slower, more tempered approach.
Economic Backdrop
Brazil’s economy cooled sharply through 2025. Third-quarter GDP growth slowed to 0.1%, and consumer demand softened. Inflation has eased but remains above the midpoint of the target: headline CPI ended 2025 at 4.26%, below the 4.5% upper bound of the 3.0% ± 1.5% target range. Core inflation measures and expectations have trended lower, but they remain inconsistent with target convergence. The labour market remains resilient but is stabilizing, and the Selic rate has been held at 15%, which Copom characterizes as restrictive but necessary to guide inflation back to target.
Expectations for the January 26–27 BCB Meeting
The baseline expectation is no change, with Copom likely to keep the Selic rate at 15%. A Reuters survey published on January 23 found 32 of 35 economists expect a hold, while only a small minority anticipate a cut (two forecast 25 bps; one forecast 50 bps). Importantly, the same survey showed a strong majority expects the first cut to arrive in March, not January—suggesting the market narrative has shifted toward a “hold now, tee-up later” sequence.
Why Copom Will Likely Stay Cautious
Inflation expectations are improving but still rising. While headline CPI has cooled, expectations for 2025–26 remain above target, and policymakers remain alert to upside risks from services inflation and any currency depreciation.
External conditions remain a key constraint. Brazil is highly sensitive to global financial volatility and U.S. monetary policy. Cutting too early could weaken the real and re-ignite inflation pressures.
Gold (XAU/USD) Current market conditions and Weekly Outlook
Spot gold traded near $4 987 per ounce on 24 Jan 2026. The metal has rallied more than 11 % year‑to‑date after a 64 % gain in 2025, supported by safe‑haven flows and central‑bank buying. Analysts note that national‑bank purchases in 2026 may average ~70 tonnes per month, underpinning demand.
The rally has been fueled by escalating geopolitical risks (U.S.–Greenland and Iran tensions, Russia–Ukraine war) and expectations of easier monetary policy. Surveys show that ~95 % of market participants expect the Fed to keep rates unchanged at its 28 Jan meeting. Meanwhile, PMIs indicate that U.S. economic activity is expanding moderately, which has kept inflation expectations anchored.
Fundamental outlook for the week ahead
FOMC & U.S. data: Gold traders will watch the Fed’s rate decision and Chair Powell’s press conference. A hawkish tone (emphasizing sticky inflation) could curb gains by strengthening the U.S. dollar and bond yields, while a dovish tone (acknowledging slower growth) could extend gold’s rally. PCE inflation data will also shape rate expectations.
Geopolitics: Tensions remain elevated. President Trump’s comments about Greenland and Iran created large swings in risk premiums, and further escalation, especially military actions against Iran, could spark new moves. News on the Russia–Ukraine conflict and Middle East conflicts continues to drive safe‑haven demand.
Central‑bank demand: Expectations of continued reserve accumulation by emerging‑market central banks provide a structural tailwind. Goldman Sachs recently raised its 2026 gold forecast to $5 400/oz, citing private‑sector and central‑bank diversification
Risks and scenarios
- In a hawkish Fed scenario—where policymakers emphasize persistent inflation and Treasury yields move higher—gold would likely face downside pressure, with a corrective move potentially pulling prices back toward around $4,760 as the USD strengthens.
- A dovish Fed or rate-cut-hint outcome—where the Fed acknowledges slower growth, would be supportive for bullion, increasing the odds that gold tests or breaks above ~$5,100, with a potential follow-through target near $5,300.
- If geopolitical risks escalate, such as renewed tensions in the Middle East or Europe, safe-haven demand would likely remain dominant and keep gold well bid near recent highs.
- If risk appetite improves—driven by reduced geopolitical stress and/or stronger economic data—investors could rotate back into risk assets, which would likely trigger pullbacks toward key support, around ~$4,880.
Gold (XAUUSD) — Daily Technical View
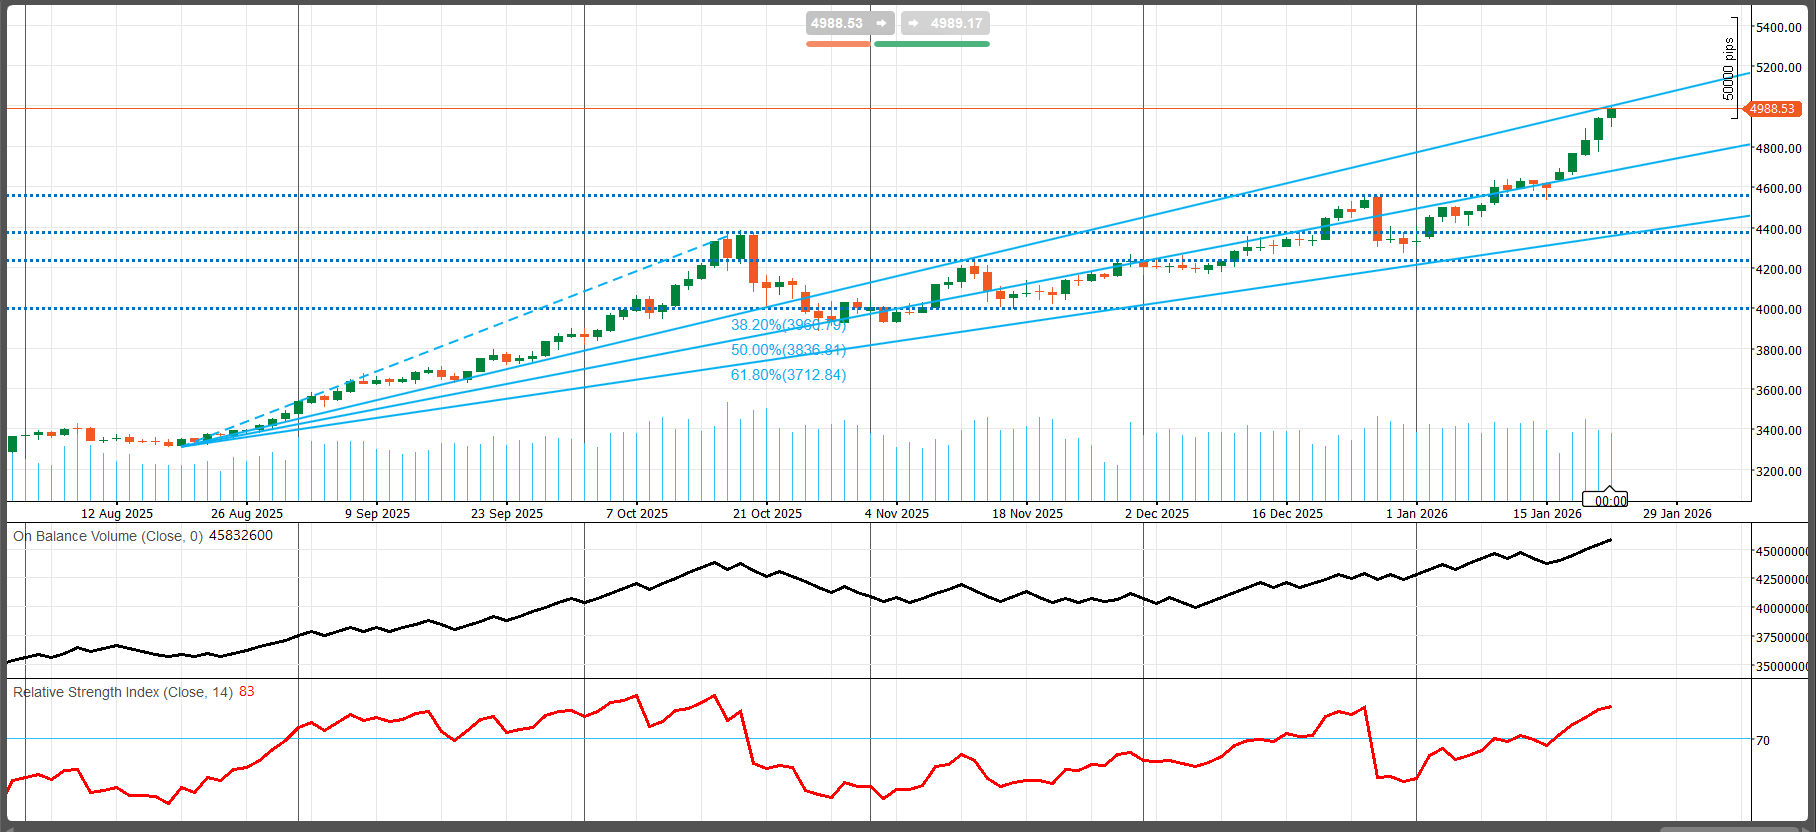
Primary trend is bullish; price is advancing inside a well-defined rising channel (multiple parallel blue trendlines). The latest leg is an impulsive acceleration that pushed the price back toward the upper channel boundary. The market has been making higher highs and higher lows since late August, with the mid-channel acting as “dynamic support” during pullbacks.
Momentum and participation
RSI (14) ~ 83: momentum is overbought and stretched. In strong trends, RSI can stay elevated, but it also raises the probability of a cool-off / pullback or at least sideways digestion before the next leg.
OBV is trending higher: this supports the rally as accumulation/participation remains constructive rather than fading on the push higher.
Longer-horizon Fibonacci levels shown on the chart sit near ~3,997 (38.2%), ~3,837 (50%), ~3,713 (61.8%)—relevant only if the market transitions into a materially larger correction.
Key levels to watch:
Resistance: 5,000 (psychological handle), and immediate resistance/decision zone. A clean daily close above it improves the odds of trend continuation. Upper channel resistance ~ 5,150–5,250 (projection). This is the next technical “ceiling” if 5,000 gives way with follow-through.
Support: 4,900–4,850: first “dip-buy” area (near the recent breakout/acceleration base and channel interior). Lower, we have 4,600, a major prior breakout shelf (top dotted band). A daily close back below 4,600 would be the first meaningful warning that the rally is losing structure. Lower we have 4,400–4,200, next support cluster (multiple dotted levels + channel support zone). And finally, 4,000: deeper support (major dotted level).
Crude Oil (WTI/Brent) - Current Market Conditions and Outlook
WTI crude futures rose to $61.28 per barrel on 23 Jan 2026, up 3.23 % from the previous day. Over the past month, the price has been up 5.02 %, though it remains ~18 % lower than a year ago. Brent closed the week at around $65.89 per barrel.
Key market Drivers:
- Geopolitical risk: Oil rallied earlier in the month after President Trump said an armada was heading toward Iran, raising fears of supply disruption; outages in Kazakhstan’s Tengiz oilfield and a weaker dollar also contributed.
- Risk‑premium unwinding: By 22 Jan, prices fell ~2 % as Trump softened threats toward Greenland and Iran, and there were signs of progress toward peace in Ukraine; analysts noted that the risk premium deflated.
- Inventory builds: U.S. Energy Information Administration data showed a crude inventory build of 3.6 million barrels for the week ending 16 Jan, more than triple expectations, which pressured prices.
- Oversupply forecasts: The International Energy Agency projects global oil stocks to rise 3.7 million bpd in 2026, suggesting supply may outstrip demand and capping gains.
Fundamental outlook for the week ahead
Macro events: Energy markets will track the FOMC meeting and U.S. macro data because a stronger dollar and higher interest rates typically weigh on oil demand. The Davos forum may yield geopolitical headlines.
Geopolitics: President Trump’s earlier threats to impose tariffs on European allies linked to Greenland have unsettled markets, but the energy market is not affected by that too much. Tensions in Iran created large swings in risk premiums, and further escalation, especially military actions against Iran, could spark new moves. News on the Russia–Ukraine conflict and Middle East supply disruptions continues to drive safe‑haven demand.
Supply monitoring: Traders will watch for updates on Kazakhstan’s Tengiz oilfield restart, Iranian production under sanctions, and any changes to Venezuelan exports (the U.S. is allowing limited purchases). A potential Ukraine peace deal could lower prices by returning Russian oil to markets.
Risks and scenarios
- In a risk-premium return scenario—driven by renewed Middle East tensions or material supply outages—crude would likely reprice higher, with WTI retesting the $68–72 zone and Brent potentially pushing toward ~$75 if disruptions persist.
- If instead there is peace, progress, and a tariff climb-down—for example, de-escalation across Ukraine, Iran, and the Greenland-related trade narrative—the geopolitical premium would likely deflate, and WTI could drift back toward the mid-$50s, with the $58 area emerging as a key support test.
- A global demand slowdown backdrop—signaled by weaker economic data and a stronger USD after the FOMC—would deepen oversupply concerns and likely keep crude under persistent pressure.
- A surprise OPEC+ action in its meeting later this week would be a two-way catalyst: credible cuts and strong compliance would support prices, while production increases or compliance slippage would weigh on the market and reinforce downside risk.
WTI Crude (Daily) Technical Analysis
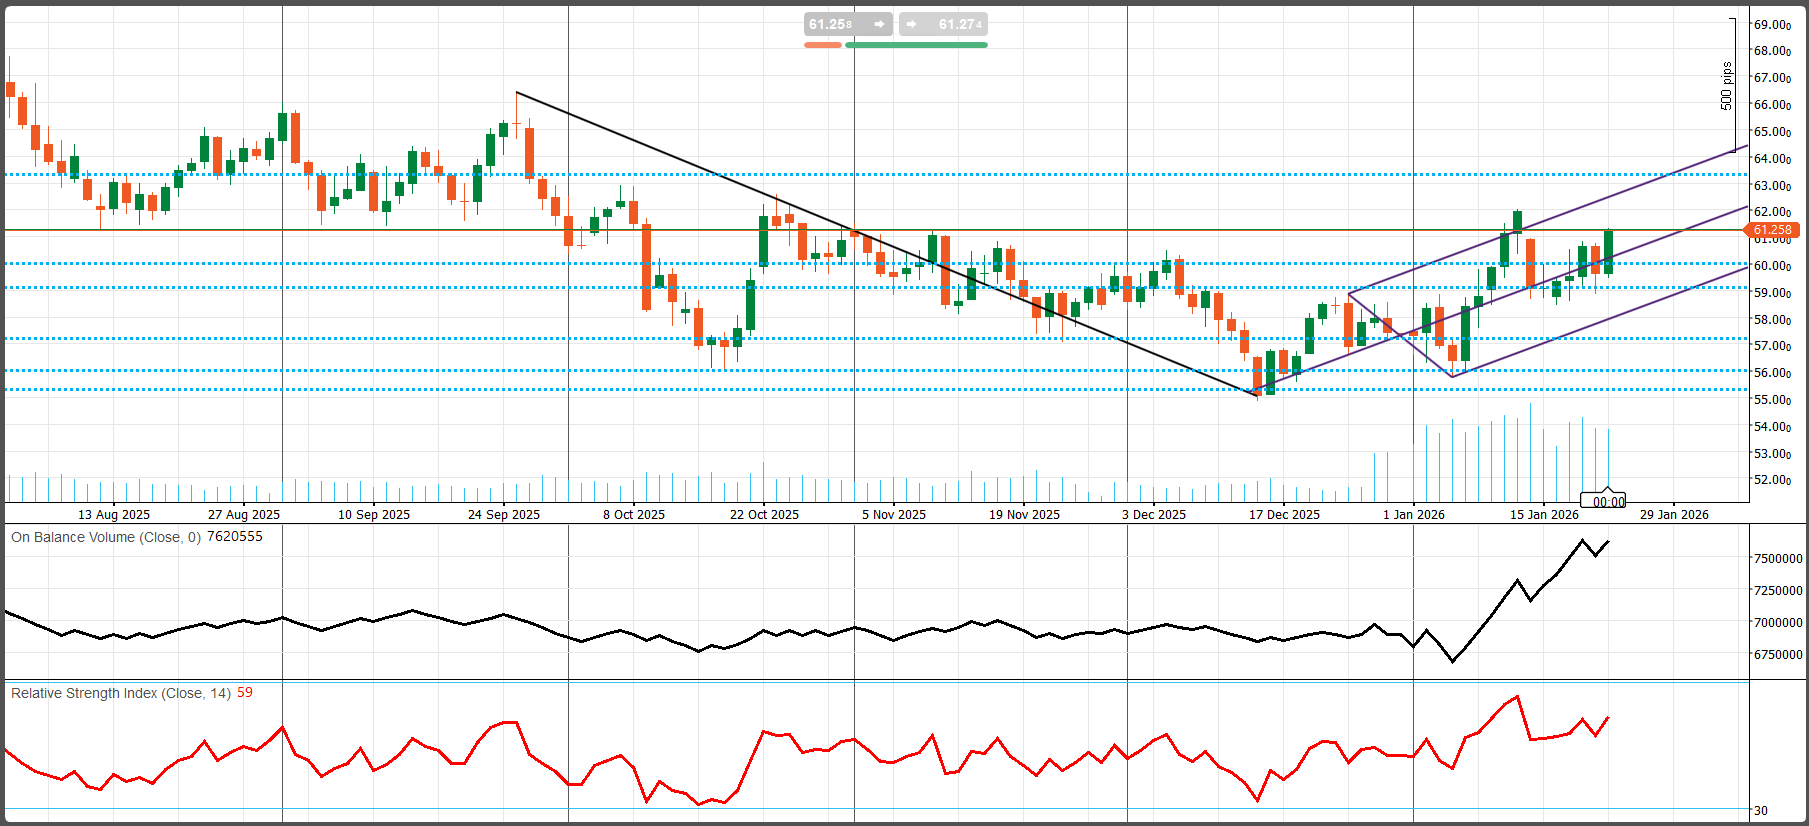
The medium-term downtrend was broken in mid-December. The market rallied off the ~55 area and cleared the prior descending trendline (black), signaling a shift from “sell rallies” to a more neutral/bullish posture. Since that break, the price has been building a rising channel (purple). The sequence is now higher lows, with pullbacks generally respected inside the channel.
Momentum and participation
RSI (14) ~ 59: constructive but not overbought—supports a continuation bias if price holds above nearby supports.
OBV is rising aggressively into late January, consistent with improving participation/accumulation on the recovery leg. That’s supportive for breakouts, but also means pullbacks can be sharp if the market fails at resistance.
Key Levels to watch:
Resistance: 61.8–62.5 is the immediate supply zone (recent swing highs / repeated rejection area). A clean daily close above this band is the near-term trigger for continuation. Above that, 63.8–64.2 is the major overhead level (next horizontal ceiling). This is the first “bigger” target if 62.5 breaks. Upper channel/projection ~ 65–66 (late-Jan / early-Feb): if momentum persists and price remains inside the channel, this is the next technical magnet.
Support: 60.0–59.5 can be the first support band (near the cluster of recent closes and the channel interior). Bulls generally want to see dips held here. Then 58.0–57.0, a secondary support (prior consolidation shelf). A breakdown here would weaken the recovery structure. Lower, we have 56.0–55.0, the major base zone (December low + lower channel region). Losing this area would effectively negate the bullish reversal and reopen the prior downtrend.
Bitcoin (BTC), Current Market Conditions, and Weekly Outlook
Bitcoin ended the week around $89,500 after five consecutive days of losses. Earlier in January, it had tested highs near $98 000 but retreated amid a sharp increase in U.S. political risk.
The cryptocurrency’s decline reflects uncertainty over Federal Reserve independence. The Department of Justice served subpoenas to Fed Chair Jerome Powell, threatening criminal indictment, and President Trump pressured the Fed for aggressive rate cuts. Combined with threats of European tariffs linked to Greenland and ongoing geopolitical tensions, the news triggered risk‑off sentiment across digital assets.
On the other hand, despite volatility, institutional demand appears resilient. U.S. spot Bitcoin ETFs saw their best week of net inflows since October; Fidelity’s FBTC attracted $351 million in a single day, and addresses holding 1 000–10 000 BTC increased by 28 in the past week. This suggests large investors view the pullback as an accumulation opportunity.
Fundamental outlook for the week ahead
FOMC meeting (28 Jan): Bitcoin tends to respond to U.S. monetary policy. A hawkish tone (no cut in March) could keep BTC under pressure as yields rise; a dovish tilt could facilitate recovery.
Institutional demand: As always, institutional demand is one of the key market drivers. Market participants will watch what the main market players do, whether they buy or sell, and with those decisions, they create a short-term trading strategy.
Structural narrative: The investigation into Fed independence and geopolitical tensions has prompted debate about the long‑term role of bitcoin as a hedge against institutional decay. European Business Magazine argues that a “politicized dollar” strengthens the case for decentralized assets even if near‑term volatility persists.
Bitcoin (BTC) Daily Technical Analysis
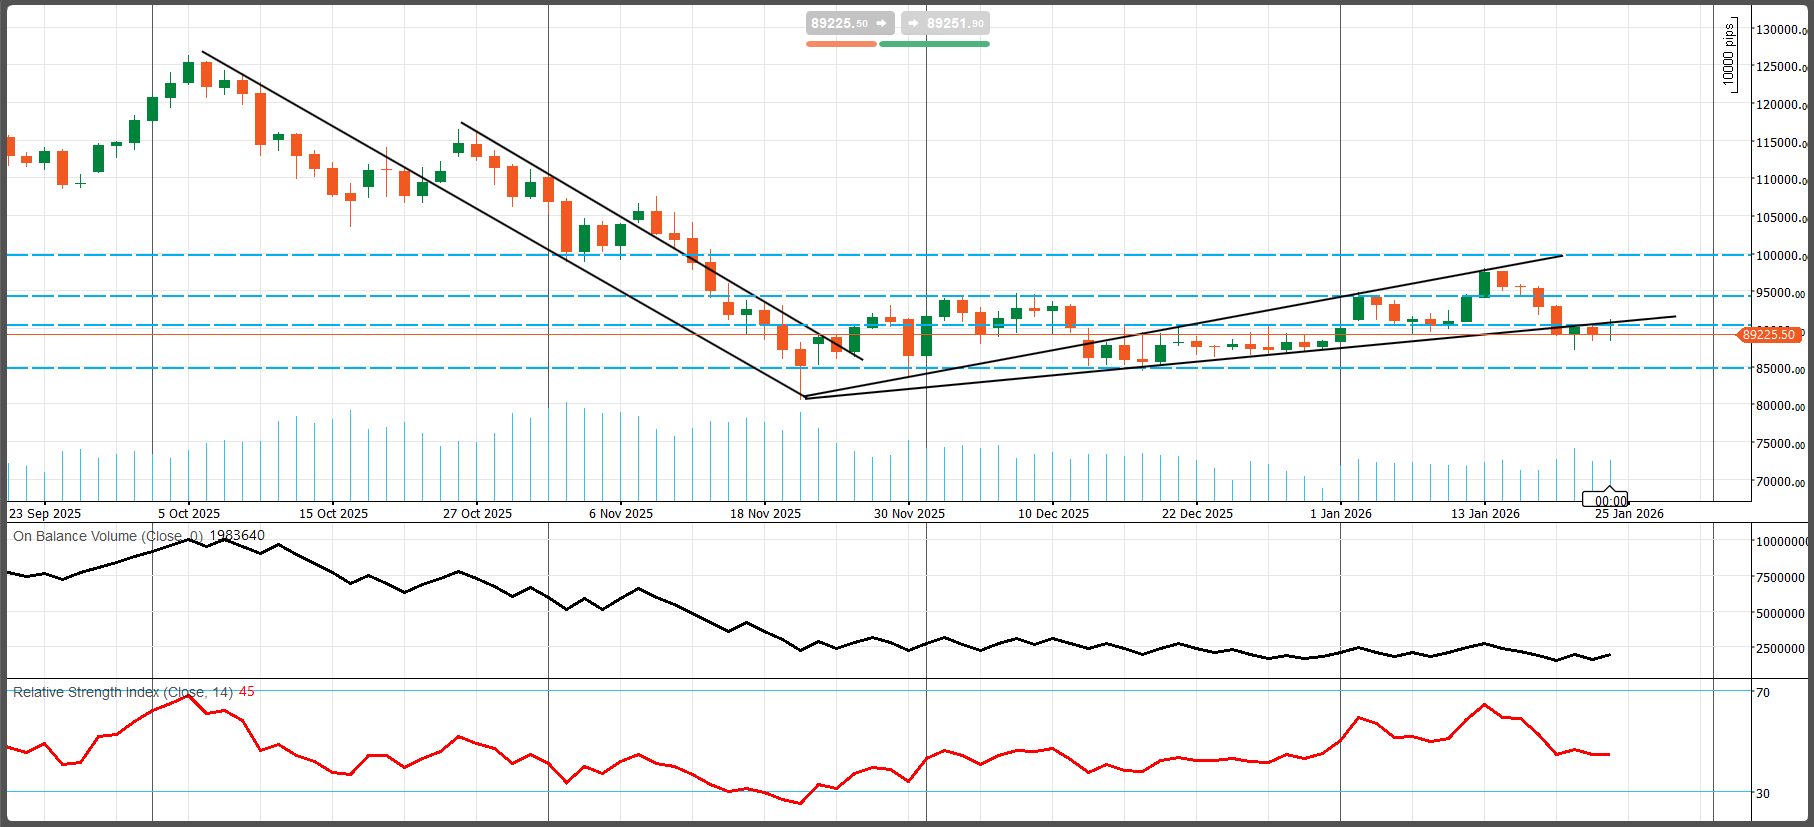
The chart shows a sharp bearish impulse from early October highs (roughly 125–130k) into a late-November low near ~82k, contained inside a descending channel (black parallel lines). Since that November trough, BTC transitioned into a range-to-compression phase with a clear series of higher lows, but still below major overhead supply. The current structure resembles a rising wedge / tightening ascending range (two converging black trendlines), which typically sets up an impulse move on breakout.
BTC is in a post-selloff consolidation with bullish higher lows, but momentum (RSI < 50) and OBV do not yet confirm a strong uptrend. The chart is essentially a compression setup: strength needs 92–95k reclaimed to re-open 100k; weakness below 88k/85k risks a return to 82k.
Momentum and participation
RSI (14) ~45: Momentum is below the neutral 50 line, consistent with a market that is not in a strong uptrend. The latest pullback has cooled down momentum and suggests rallies may still be sold until key resistances are reclaimed.
OBV: The OBV line has trended down materially since the selloff and has been mostly flat-to-soft during the recent advance. That indicates rallies are not strongly confirmed by sustained accumulation, which increases the risk of “pop-and-fade” moves near resistance.
Key levels to watch:
Resistance: 92k–93k is the first meaningful near-term resistance (local congestion + trendline interaction). Bulls want to reclaim and hold this zone to stabilize the structure. Above that 95k, the next overhead supply (prior pivot / dotted band). The daily close above improves the odds of a retest of the major cap. Higher, 100k, is the major psychological + structural resistance (top blue line). A clean break/hold above 100k would signal a more durable reversal and open the door back toward the mid-110s.
Support: 89k–88k is the immediate support (current trade area + local base). This is the “line in the sand” for the wedge’s lower boundary. Lower than we have 85k, a major support shelf. A daily close below 85k would invalidate the higher-low sequence and materially increase downside risk. Then we have 82k, the cycle low/primary demand zone. If 85k fails, 82k becomes the obvious magnet.
Comments