 English
 پارسی



Outside the U.S., attention shifts to whether the slowdown narrative is broadening. Europe remains exposed to weak manufacturing and fragile confidence, the UK faces persistent housing and construction headwinds, and China’s recovery signals still look uneven. In commodities, the crosscurrents are sharp. Gold is supported by geopolitics and policy uncertainty, while oil remains capped by the 2026 oversupply narrative despite periodic headline risk. Against this backdrop, the week ahead is best framed as a test of whether disinflation can continue without a meaningful growth hit—and whether central banks can stay “patient” without markets forcing their hand.
Watch the analytical Video
USA
The coming week sits at a classic high-volatility intersection of macro and earnings. Investors will be parsing the first broad inflation read that is expected to be less distorted by the prolonged government shutdown, while major-bank earnings begin to shape the tone for risk appetite, consumer credit, and financial conditions. With equities entering the week on a firm footing and downside follow-through limited, the bar for negative surprises may be higher—but the CPI reaction function remains decisive for rates, FX, and equity leadership.
U.S. Economy Review — First Trading Week of 2026
The first full trading week of 2026 delivered a familiar U.S. macro configuration: services activity and headline growth tracking remained firm, manufacturing stayed in contraction, and the labor market softened on hiring but not on wages. The overall signal was “slowing, but still resilient”—enough cooling to keep recession anxieties contained, yet enough wage and inflation persistence to keep the Federal Reserve cautious and highly data-dependent.
Growth Pulse: GDP Tracking Re-Accelerates, with Support from Trade and Inventories
The most growth-supportive headline came from the Atlanta Fed’s GDPNow model, which lifted its Q4 nowcast to 5.4% before easing slightly to 5.1%—still an exceptionally strong late-year estimate. However, the nature of the incoming data suggests that a meaningful share of the upgrade likely reflects net exports and inventory arithmetic rather than an unambiguous acceleration in domestic final demand.
That framing aligns with the October trade report, where the deficit narrowed sharply to -$29.4B (vs -$58.1B expected, -$48.1B prior), as exports rose to $302.0B and imports fell to $331.4B. In GDP accounting terms, a narrower trade deficit is typically a near-term tailwind.
Wholesale activity, however, hinted at a more nuanced underlying picture. Inventories rose 0.2% m/m (in line with expectations) while sales fell -0.4% m/m, pointing to an inventory build relative to demand. Mechanically, that can lift measured GDP in the short run, but it also raises the risk of an unfavorable stock-to-sales dynamic if demand does not re-accelerate.
A key caveat is composition: the magnitude of the trade narrowing appears inflated by investment-driven precious metals flows, which are less likely to translate into a proportional boost to real GDP. Excluding that effect, the deficit still improved, but the GDP impulse would likely be materially smaller than the headline suggests.
Activity Split: Services Expansion Continues, Manufacturing Remains Under Pressure
Survey data reinforced a two-speed economy:
- ISM Manufacturing PMI: 47.9, still below 50, with new orders at 47.7 and employment at 44.9, underscoring ongoing contraction in the factory sector.
- ISM Services PMI: 54.4, with business activity at 56.0, new orders at 57.9, and employment at 52.0, showing the services engine remains in expansion.
The inflation nuance inside the manufacturing survey also matters for policy: prices paid at 58.5 suggest input-cost pressure has not fully dissipated, even as manufacturing output and hiring remain weak.
Labor Market: Hiring Slows, the Unemployment Rate Improves, Wages Stay Firm
The December employment report was soft on job creation, but not decisively recessionary—especially given the offsetting improvement in the unemployment rate and the still-benign layoffs backdrop.
December jobs snapshot
- Nonfarm payrolls: +50K (vs +66K expected, +56K prior)
- Private payrolls: +37K (vs +64K expected, +50K prior)
- Manufacturing payrolls: -8K (weaker than expected)
- Unemployment rate: 4.4% (vs 4.5% expected)
- Participation rate: 62.4% (slightly lower than 62.5% prior)
- U-6 underemployment: 8.4% (improved from 8.7%)
Wages
- Average hourly earnings: +0.3% m/m (as expected)
- AHE: 3.8% y/y (above 3.6% expected)
Claims: cooling, not cracking
- Initial claims: 208K (slightly above 200K prior, still low)
- Continuing claims: 1,914K (up from 1,858K)
- 4-week average: 211.75K (down from 219K)
The best summary is that layoffs remain contained—consistent with low initial claims—while the rise in continuing claims suggests re-employment is becoming modestly more difficult at the margin. That combination typically maps to a labor market that is losing momentum, not one that is breaking.
Importantly, wages remain firm relative to the cooling in headline payroll growth. That is the tension the Fed will be focused on: labor demand is softening, but wage growth still looks sticky enough to keep inflation risks alive—particularly if productivity does not remain supportive.
Inflation Psychology vs. Disinflation Mechanics: Mixed, but Not Alarmist
Inflation expectations were not uniformly easing:
- NY Fed 1-year expectation: 3.4% (up from 3.2%)
- Michigan 1-year expectation: 4.2% (unchanged)
- Michigan 5-year expectation: 3.4% (up from 3.2%)
At the same time, the supply-side disinflation mechanics looked constructive in Q3:
- Nonfarm productivity: +4.9% q/q
- Unit labor costs: -1.9% q/q
This mix—strong productivity alongside falling unit labor costs—is a favorable backdrop for disinflation, even if consumer inflation expectations remain elevated. For policymakers, this is the kind of configuration that supports patience: no immediate need to tighten further, but also not a clean green light to ease aggressively if wages and expectations remain sticky.
Housing: Permits Steady, Starts Softer
Housing data suggested a stable pipeline but softer construction activity:
- Permits: roughly ~1.41M in Sep/Oct (steady)
- Starts: 1.246M in October (-4.6% m/m)
This pattern is consistent with interest-rate sensitivity: builders appear willing to maintain permits, but more hesitant to break ground at the same pace.
Policy and Liquidity Backdrop: QT Continues, Front-End Conditions Calm
The Fed’s balance sheet continued to shrink:
- Balance sheet: $6,574B (down from $6,641B), consistent with ongoing runoff.
- Reserve balances: $3.023T (up from $2.853T), implying improved banking-system liquidity even as quantitative tightening proceeded.
Front-end rates remained well-behaved:
- 4-week bill auction: 3.550% (down from 3.590%)
- 8-week bill auction: 3.540% (down from 3.580%)
Taken together, these are not signals of funding stress. They read as stable liquidity conditions and a calm money-market backdrop.
Markets and the Fed: The Week’s Core Trade-Off
The December jobs report was the week’s centerpiece, and it produced the classic cross-currents that typically split market narratives. Payroll growth was weak enough to keep the “cuts are coming” camp engaged, but the unemployment rate and wage data were firm enough to keep the “don’t rush” camp in control of the policy conversation.
There was also meaningful noise in the household survey due to post-shutdown normalization effects, which complicates any single-month read on the unemployment rate. Still, the policy dilemma remains straightforward: labor-market indicators are softening and argue for eventual easing, while wage persistence and inflation expectations keep the Fed from moving too quickly.
On the growth side, the trade-driven GDP tailwind is real in an accounting sense, but the composition matters, and the precious-metals distortion suggests the headline narrowing likely overstates the true impulse to real activity. Meanwhile, inventories may be providing short-run GDP support, but they also warrant monitoring if sales do not rebound.
Looking ahead, tariff uncertainty remains an additional macro variable. The key question is how legal challenges—particularly around authorities such as the International Emergency Economic Powers Act (IEEPA)—could affect the trajectory of tariff policy. Even if courts constrain certain measures, there are alternative avenues for tariff reimposition, which could keep the effective tariff backdrop broadly elevated.
Bottom Line
This was a week where growth tracking strengthened (GDPNow still above 5%), hiring slowed, and wages and inflation expectations stayed sticky. That combination tends to reinforce a “patient, data-dependent” Fed posture: not an immediate easing story, but also not a renewed tightening story unless inflation re-accelerates. For markets, the macro setup remains one of late-cycle resilience with rising sensitivity to incremental labor-market deterioration—and to whether productivity can continue to offset wage pressure enough to keep disinflation on track.
U.S. Economic Outlook — Week Ahead (Jan 12–18, 2026)
A key overlay is data integrity and base effects. Prior inflation releases were affected by incomplete collection and subsequent statistical adjustments, and the BEA has indicated it will rely on CPI averaging to backfill missing inputs for PCE. The result is lingering “measurement noise” in the inflation pipeline, meaning markets may need to weigh the signal in the details as much as the headline.
Key themes to watch
1) Inflation credibility vs. “sticky” pricing narratives
December CPI is the headline risk event and will likely be treated as the first clean checkpoint for the disinflation story after earlier disruptions. Market pricing is likely to respond asymmetrically:
- A hotter-than-expected print can reprise the front-end, lift real yields, and pressure rate-sensitive equity segments.
- A softer print would reinforce the “gradual disinflation, easing later” narrative and support risk assets—provided it does not come with a growth-scare tone.
2) Consumer and growth signals: Retail Sales plus bank earnings
Retail Sales (Nov) arrives alongside bank results, offering two complementary reads on the same question: is the consumer cooling or simply normalizing after a strong 2025 run? With shutdown effects fading, banks’ commentary on card spending, delinquencies, and deposit trends will be closely watched for confirmation of the macro data.
3) Dow Jones sensitivity: rates, cyclicals, and breadth
The Dow’s leadership mix—industrials, financials, and healthcare—tends to make it particularly sensitive to:
- Rates and curve dynamics (especially banks and insurers),
- Industrial momentum (surveys and industrial production),
- Risk appetite and breadth (often less duration-sensitive than Nasdaq, but still vulnerable to sharp real-yield repricing).
The week’s core releases and baseline expectations
CPI (December) Tuesday
The prior CPI read was likely artificially soft in part due to shutdown-related collection issues, and those distortions should unwind to a meaningful degree in December. The expectation is for a firmer monthly print—essentially “payback”—without necessarily breaking the broader trend of year-over-year disinflation.
Baseline view:
- Headline CPI: +0.35% m/m
- Core CPI: +0.36% m/m
- YoY: headline ~2.7%, core ~2.8%
Under the hood, core goods is expected to re-accelerate as holiday pricing dynamics may have been captured more heavily in the prior survey period than usual. Meanwhile, primary shelter is likely to revert toward its pre-shutdown trend, with limited evidence that shelter inflation will materially re-accelerate before spring.
Market implication: The composition will matter. A higher CPI driven by core goods “payback” may be treated differently than renewed firmness in services inflation, which would be more consequential for the Fed’s confidence.
New Home Sales (September and October) Tuesday
The Census Bureau is expected to release both September and October new home sales. The last available reading (August) showed a striking jump to 800K, concentrated largely in the South—an outcome that looks difficult to reconcile with mortgage rates holding well above 6%.
Builders have partially offset affordability constraints through incentive-price cuts and mortgage-rate buy-downs—but the increased reliance on price reductions in recent months suggests demand conditions remain unfavorable beneath the surface.
Baseline view:
- October new home sales: ~707K annualized pace
- This would represent a normalization back toward the average pace seen through July rather than a sustained step-up in demand.
Market implication: Housing remains a clean rate transmission channel. A sharper slowdown would reinforce the “restrictive policy is still working” narrative, while resilience would complicate the easing discussion.
Retail Sales (November) Wednesday
Retail sales are expected to rebound after a flat October, with autos likely doing much of the work.
Baseline view:
- Headline retail sales: +0.5% m/m
- Ex-autos: +0.3% m/m
The broader consumer picture remains resilient, supported by high-frequency spending into November. However, the control group (ex-autos, gas, food services, and building materials)—a key input into GDP—is likely moderate after a strong October. A cooling labor market and ongoing affordability pressures remain constraints, even if nominal spending holds up.
Forward view: The consumer is still expected to “finish 2025” with solid growth momentum, broadly consistent with 3.5%–4.0% year-over-year growth. Looking into early 2026, middle to upper-middle income households may receive some support from improved after-tax income dynamics and seasonal tax refund effects, which could cushion spending even as labor market momentum cools.
Market implication: Strong retail sales alongside firm CPI is the combination most likely to push yields higher and test equity multiples—particularly if investors read it as reinforcing policy restrictiveness.
USD and Wall Street, with a Dow focus
This is a week where rates are likely to lead: CPI sets the initial direction, retail sales test the growth impulse, and bank earnings help determine whether the market treats the macro as “soft landing” or “late-cycle risk.” For the Dow Jones, the key is whether the macro mix supports cyclicals and financials without triggering a destabilizing repricing in real yields. If inflation looks contained and the consumer remains steady, the setup favors continued rotation toward value/cyclicals and a constructive Dow tone. If CPI surprises to the upside, especially in sticky services, expect a sharper front-end repricing that can quickly challenge Dow breadth via financial conditions tightening.
USD conditions and weekly outlook
The dollar is trading in a policy-sensitive regime, while after last week's mixed labor market data, investors and traders will focus on inflation numbers. Near-term direction is dominated by inflation surprises, front-end yield repricing, and risk sentiment.
If CPI is broadly in line and retail sales are “steady but not hot,” USD likely stays range-bound, with modest support from the U.S. still looking relatively resilient versus slower-moving peers. However, if CPI/core CPI re-accelerates or the details (shelter/services ex housing) look sticky will increase front-end yields, and USD demand, particularly versus low-yielders and cyclical FX. On the other hand, with weaker retail sales and slowing inflation, the USD offered, especially if equities remain buoyant.
USD Index (DXY) Daily Technical Analysis
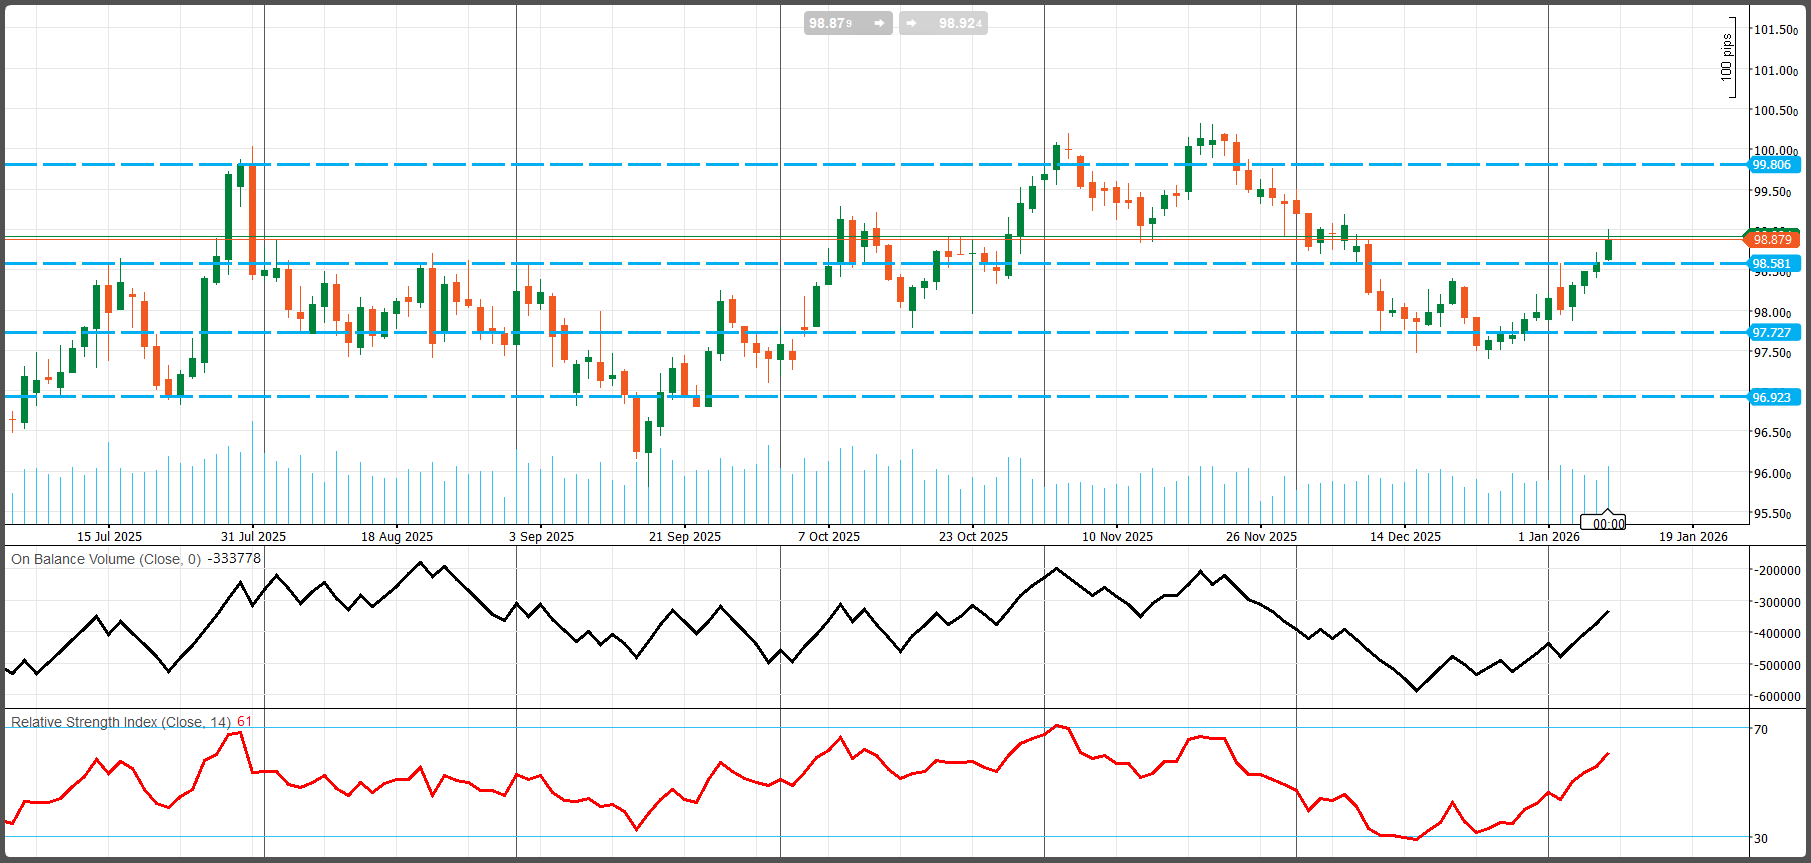
Price has been trading in a broad range since mid-2025, with the chart-defined band roughly 96.923 to 99.806. Recently, after peaking in November (near/above 100), DXY sold off into mid-December and was based around 97.727, then began a recovery leg. Currently, DXY is around 98.879, having reclaimed the 98.581 pivot—a key technical development because that level acted as support/resistance multiple times.
RSI (14): ~61 and rising: RSI has rebounded sharply from the low-30s in mid-December to ~61, which indicates improving bullish momentum without being overbought yet.
OBV (On-Balance Volume): turning up, as OBV bottomed out in mid-December and is now trending higher, suggesting demand is improving as price rises. Rising OBV during a rebound is typically a positive confirmation that the move is being “sponsored,” not merely short covering.
Key horizontal levels
Resistance: 98.879 (spot/near-term pivot). Immediate resistance/decision area; price is testing it now. Above that, 99.806 is the major range resistance. This is the “line in the sand” for a larger bullish continuation. If the price goes further, 100.00–100.50 area (psychological + prior swing zone), especially If 99.806 breaks on a daily close, this becomes the next upside magnet.
Support: 98.581: First support (former pivot). Holding above keeps the rebound constructive. Lower, we have 97.727 as key support and the base area of the recent rebound. A break back below would suggest the rally is only a corrective bounce.
Dow Jones (DIA)
Bank earnings are a direct Dow driver (financial weight + read-through to consumer/credit) this week alongside CPI. While Dow often tolerates higher yields better than Nasdaq, a sharp real-yield spike can still compress multiples and hit economically sensitive names.
If CPI is benign enough to avoid a hawkish repricing, but not so weak that it triggers a sudden growth scare. At the same time, the steady retail sales consumption supports the earnings outlook without reigniting inflation fears, and vice versa.
Dow Jones Index — Daily Technical Analysis
The primary trend is clearly bullish. Price has been making higher highs and higher lows since late spring/summer 2025, supported by a rising trendline. The index has broken above the 48,460 pivot and is now consolidating near 49,530—a classic “breakout means a pause” behavior rather than distribution. Unless price falls back below the reclaimed breakout zone, the structure favors trend continuation.
Key levels
Immediate resistance is 49,530: Current overhead ceiling / near-term top. A daily close above it would signal fresh upside continuation. 50,000 can be considered the next round-number magnet once 49,530 is cleared.
Primary support sits at 48,460, the most important pivot support (former resistance). Holding above keeps the breakout valid and the uptrend intact. Under that, we have 47,141, a Mid-range support. A break below would indicate a deeper pullback rather than a shallow consolidation. Also, 45,905 is the major support (prior base zone). A loss here would materially damage the trend structure.
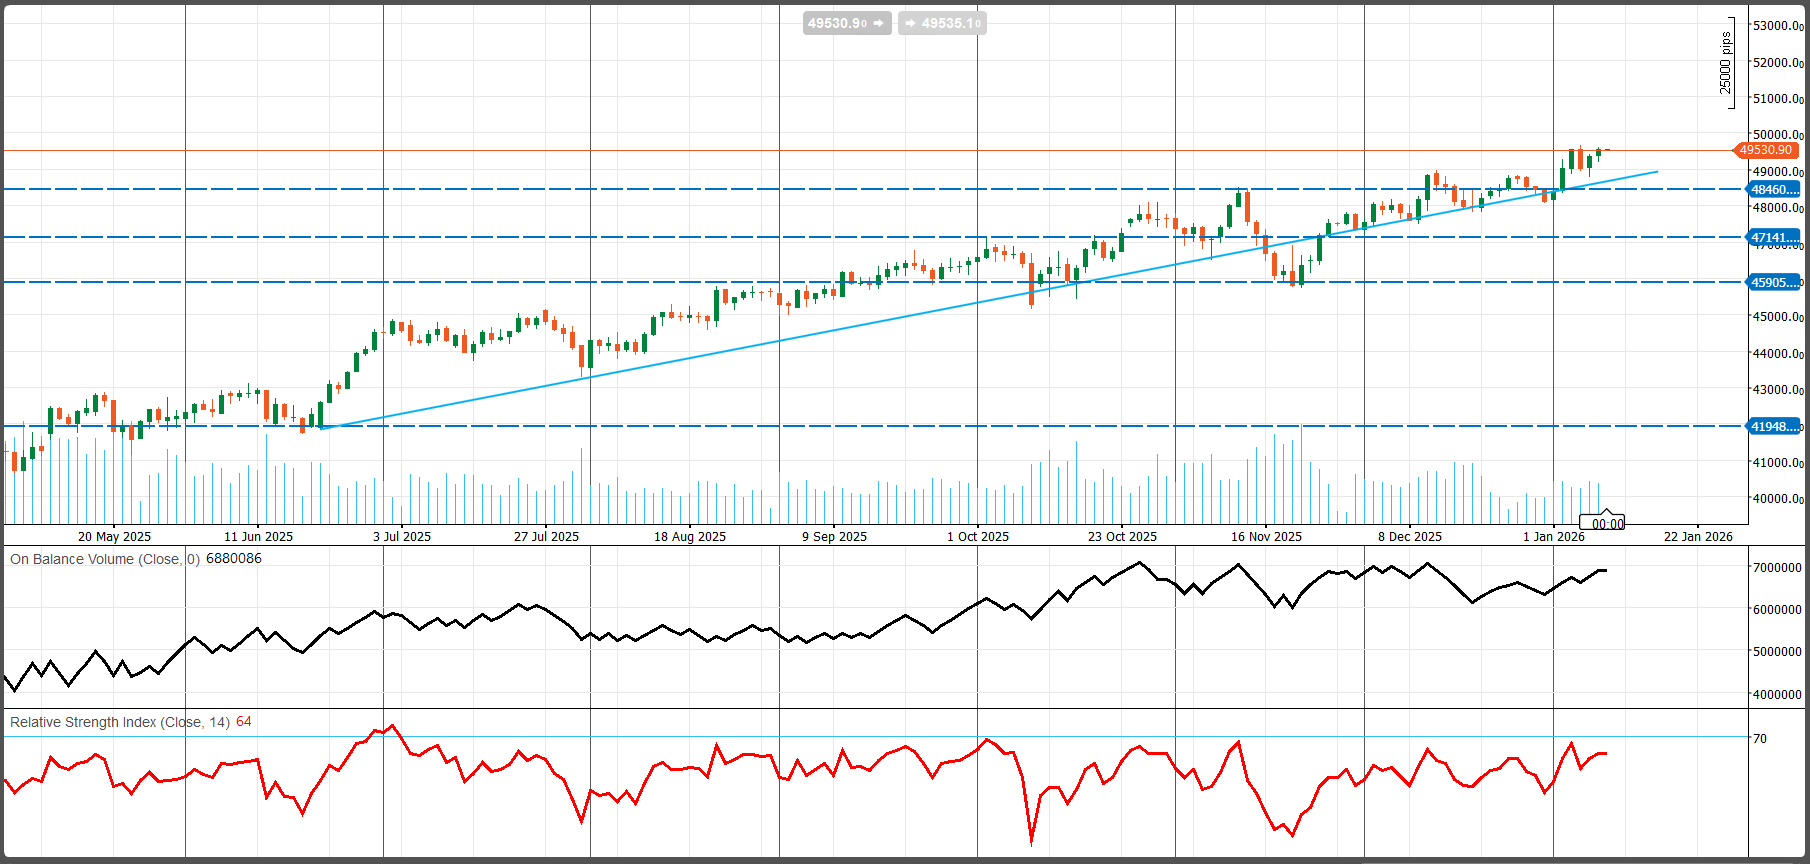
Generally, the Dow remains technically bullish on the daily chart, supported by a rising trendline and improving participation (OBV). The index has reclaimed 48,460 and is consolidating under 49,530—a constructive setup as long as 48,460 holds. A daily close above 49,530 strengthens the case for a move toward 50,000, while a sustained drop below 48,460 would shift focus to 47,141 and 45,905 as the next supports.
UK
fdfv
UK Economy Review — First Trading Week of 2026
The UK began the first full trading week of 2026 with a familiar, uneven macro picture. Business surveys still imply modest expansion, led by services, but the economy’s rate-sensitive engines—construction and housing—remain under clear pressure. At the same time, credit and money aggregates improved, suggesting financial conditions are no longer tightening at the margin, even if policy remains restrictive in level terms. In short, growth is still positive, but the distribution of momentum is narrow, and the housing-linked slowdown continues to act as a drag.
Growth and activity: expanding, but only just—and not evenly
The December PMI set reinforced a “growth, but not strong growth” profile:
- S&P Global Composite PMI (Dec): 51.4 (vs 52.1 expected; 51.2 prior)
- Services PMI (Dec): 51.4 (vs 52.1 expected; 51.3 prior)
- Manufacturing PMI (Dec): 50.6 (vs 51.2 expected; 51.2 prior)
Services are still expanding, but the miss versus expectations points to soft momentum, not re-acceleration. Manufacturing is hovering only marginally above the 50 threshold, which is consistent with a sector that is stabilising rather than leading.
The clear weak spot is construction:
- Construction PMI (Dec): 40.1 (vs 42.4 expected; 39.4 prior)
A reading in the low-40s—and particularly a “40-handle”—signals material contraction. That matters beyond the construction itself because it feeds directly into housing activity, SME confidence, and the broader employment and supply chain ecosystem.
Households and housing: prices roll over again, even as borrowing stays alive
Both major house price series softened meaningfully in December:
- Nationwide HPI: -0.4% m/m, +0.6% y/y
- Halifax HPI: -0.6% m/m, +0.3% y/y
Despite differences in methodology, both are telling the same story: price momentum is fading, and the year-on-year rate is cooling rather than rebuilding.
Credit indicators, however, were steadier than the price data might suggest:
- Mortgage approvals (Nov): 64.53K (vs 64.00K expected; 65.01K prior)
- Mortgage lending (Nov): £4.49B (below £4.80B expected; above £4.16B prior)
- Net lending to individuals (Nov): £6.600B (vs £5.200B expected; £5.400B prior)
- Mortgage rate (Dec): 6.77% (slightly down from 6.81%)
- Housing equity withdrawal (QoQ): -£10.9B (vs -£8.7B expected; -£17.9B prior)
The interpretation is nuanced. Households are still borrowing, and net lending surprised to the upside, but the combination of weaker price signals and collapsing construction activity argues that the housing complex remains highly rate-sensitive. Meanwhile, negative housing equity withdrawal suggests consumers are not drawing on housing wealth to fund spending—more consistent with a cautious household sector than a reflating one.
Inflation pulse at the consumer level: retail price pressure remains contained
Retail inflation remained subdued:
- BRC Shop Price Index: +0.7% y/y (up slightly from 0.6%)
This is not a comprehensive inflation measure, but it supports the idea that goods-related price pressure remains muted, which is important for real incomes—especially if wage growth does not accelerate materially.
Money, credit, and rates: liquidity improves; gilt pricing looks calmer
Monetary and credit aggregates were supportive on the margin:
- BoE consumer credit (Nov): £2.077B (up from £1.713B)
- M4 (m/m, Nov): +0.8% (vs -0.1% expected; -0.2% prior)
- M3 (Nov): £3,200.7B (up from £3,176.2B)
On the rates side, the short-end funding signal was slightly easier:
- UK 5-year gilt auction: 3.980% (down from 4.093%)
That fits a market narrative where policy is no longer tightening—and where investors are increasingly attentive to softer growth dynamics, even if inflation risks keep the BoE cautious.
Real-economy snapshot: autos improve, but housing remains the bigger macro lever
One brighter activity datapoint was car registrations:
- UK car registrations (Dec): +3.9% y/y
- New passenger cars: 146,249 (below 151,154 prior)
Year-on-year growth is constructive, but the level slipped versus the prior period, making it more a sign of stability than a breakout in demand.
Bottom line: a slow-growth equilibrium, with housing and construction still the weak links
The first trading week of 2026 leaves the UK with a steady but fragile macro balance:
- Growth: modest, services-led; manufacturing only marginally expansionary; construction deeply weak.
- Consumer/housing: price momentum softened again; credit flows are positive but clearly rate-sensitive; households are not extracting housing wealth.
- Inflation (retail-facing): contained, supportive for real incomes if sustained.
- Policy implications: the mix argues for a cautious BoE—still restrictive enough to avoid reflating inflation, but increasingly focused on the persistent weakness in construction/housing and the broader lack of growth acceleration.
UK Economic Outlook — Week Ahead (Jan 12–18, 2026)
The UK enters the week with a “slow-growth” macro profile: services are still expanding modestly, but construction remains deeply contractionary, and housing momentum has cooled under still-restrictive borrowing costs. The market’s near-term focus is less about a single “policy pivot” and more about whether incoming activity data validate a gradual easing path—or force the Bank of England (BoE) to stay cautious for longer. Recent survey reporting continues to underscore how weak the construction channel remains.
The week’s key catalyst is the November GDP and the output breakdown (Thursday)
Thursday is the main macro event risk for UK markets: the Office for National Statistics (ONS) publishes the monthly GDP estimate for November 2025
Because monthly GDP is built from services, production, and construction, the same window also brings several high-signal “under the hood” prints—most notably:
- Index of Services (Nov)
- Index of Production (Nov)
- Construction output (Nov)
- UK Trade (Nov)
The U.K.’s November GDP figures, set to be released next week, will shed light on the broader economic picture as 2025 came to a close. Market consensus points to a modest 0.1% month-over-month expansion, a turnaround from the 0.1% contraction seen in October. Breaking down the components, services activity is expected to edge up by 0.1%, while industrial output is forecast to remain unchanged. October’s industrial production had climbed 1.1%, driven largely by a rebound in car manufacturing, but the economy’s heavy dependence on services meant that a 0.3% decline in that sector dragged the overall result lower.
If November’s anticipated uptick is confirmed, it would allow Q4-2025 to finish on a more constructive note. Still, recent PMI surveys through December suggest a mixed backdrop: services PMIs have softened, while manufacturing indicators show gradual improvement.
For the Bank of England, the persistence of sluggish activity strengthens the argument for further rate cuts, though these are likely to proceed cautiously. With inflation continuing to ease, we expect the terminal rate of the current easing cycle to settle at 3.25% by the second quarter of 2026.
Why it matters for markets:
- A firmer GDP/services outcome would challenge the “near-term cooling” narrative and can push front-end gilt yields higher (less urgency to ease).
- A soft GDP print—especially if services also undershoots—would reinforce the idea that policy is restrictive enough to slow demand, typically supporting gilts and weighing on GBP.
GBP: condition and week-ahead bias
GBP is likely to trade as a rates-and-growth expression this week. The highest beta moments should be Thursday’s ONS GDP/output bundle and BoE messaging around it.
If GDP/services surprise to the upside, reducing near-term easing expectations, we can expect a stronger Pound and vice versa, if GDP disappoints, with weakness concentrated in services and/or construction (policy-relevant demand channels), Sterling can be under pressure.
GBPUSD — Daily Technical Analysis
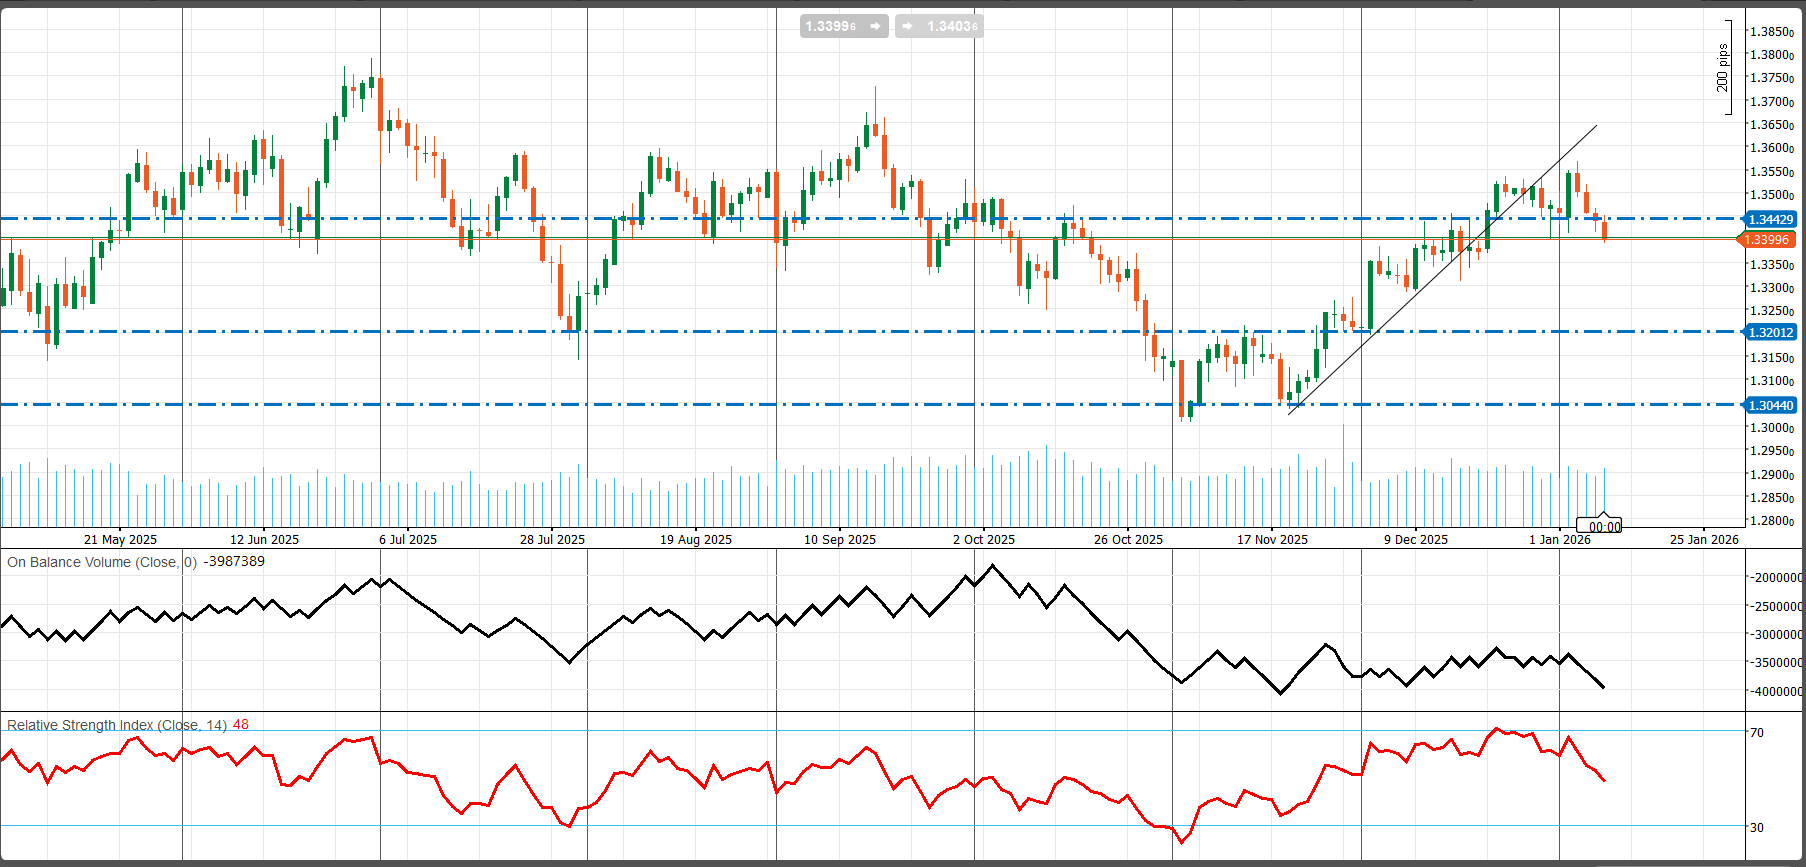
GBPUSD has largely traded range-to-choppy manner, with repeated swings rather than a clean trend. A strong bullish recovery developed from the 1.30–1.31 area, producing a sequence of higher highs/higher lows. However, currently, recovery has lost momentum. Price rolled over from the late-December/early-January highs and is now back near 1.33996, sitting below/around the broken rising trendline—a classic sign the prior impulsive upswing is transitioning into consolidation or a corrective pullback.
GBPUSD is at an inflection point on the daily chart. The late-2025 rally has clearly lost momentum (RSI ~48), and participation looks to be softening (OBV rolling over). 1.33996 is the key near-term support; holding it keeps the pullback contained and sets up a potential reclaim of 1.34429. A sustained break below 1.33996 increases the probability of a deeper correction toward 1.32012, with 1.30440 as the next major downside level.
RSI (14) ~ 48: RSI has slipped back below 50, which signals waning bullish momentum and a more neutral-to-soft bias. Importantly, it’s not oversold—so there is room for further downside without needing a momentum “reset.”
OBV trending lower: OBV is rolling over and declining, which suggests distribution / weaker participation behind the recent price action. This matters because it reduces the probability that the market immediately resumes the prior up-leg without first rebuilding demand.
Key horizontal levels (as marked on the chart)
Resistance: 1.34429 is the first resistance / key pivot. This level is important because it’s the most immediate “reclaim line” for bulls—holding above it would improve short-term structure. Above that 1.3550–1.3600 zone (recent swing supply), clearly visible as the recent peak area and the next upside magnet if 1.34429 is reclaimed and momentum rebuilds.
Support: 1.33996 (current pivot) is an immediate support/decision point. Price is reacting here now. Under that, we have 1.32012 as the major support (previous consolidation/pivot zone).
Gold Market and Weekly Outlook
Gold enters the week firm and near cycle highs, supported by a combination of elevated geopolitical demand and a rates backdrop that still leaves room for Fed easing later in 2026. The central question for the next leg is whether U.S. CPI validates a path toward lower real yields—which would support upside continuation—or forces a repricing toward higher yields, which would increase the risk of a corrective pullback.
Even if gold pulls back tactically, the broader setup remains constructive. Policy uncertainty and escalation risk continue to keep dips attractive, and gold remains biased to outperform in any scenario that increases uncertainty around trade policy, alliances, or institutional constraints.
Macro drivers: Why gold is supported, but still volatile
Gold remains structurally underpinned as markets continue to price a geopolitical risk premium, even as short-term price action turns choppy. The push toward $4,500 and the subsequent retracement look consistent with a market that is still “bid” on uncertainty, but vulnerable to cross-metal volatility and profit-taking—particularly when silver’s erratic swings spill over into broader precious-metals sentiment.
From a macro-geopolitical perspective, gold also looks well-positioned ahead of the U.S. Supreme Court decision being discussed around tariffs. A ruling that constrains or invalidates the legal basis for current tariffs could trigger a sharp repricing in risk and a broader jump in policy uncertainty, typically a supportive environment for gold. Even if the ruling is effectively “tariff-positive” (expanding executive latitude), the likely outcome is renewed trade confrontation, with Europe and China as key targets—again reinforcing demand for gold as a hedge.
The Greenland dimension adds channel: any deterioration in EU–U.S. relations, or sustained rhetorical escalation around sovereignty and military posture, tends to strengthen gold’s role as a geopolitical hedge.
On top of this, the ongoing unrest in Iran is another source of tail risk. If tensions broaden beyond Iran’s borders—or if the probability of direct U.S. military action rises—overall risk pricing could shift quickly, which historically tends to be constructive for gold.
In practical terms, two forces are keeping gold supported but volatile:
- Geopolitical risk premium remains a meaningful tailwind, with recent headlines adding to safe-haven demand.
- Rates expectations are still framed around potential Fed cuts later in 2026, which supports gold on dips—while day-to-day movement remains highly sensitive to U.S. yields and the USD.
Structurally, gold is carrying strong momentum from 2025 into early 2026, reinforcing the view that the market remains in a high-level uptrend rather than a fading rally.
What matters most this week (beyond geopolitics)
1) U.S. CPI is the core macro catalyst
The week is led by December CPI, with markets still aware that recent inflation readings were affected by shutdown-related data collection issues—making the “signal versus noise” question unusually important.
Gold’s reaction function is straightforward:
- A hot CPI typically lifts real yields and strengthens the USD, which can pressure gold in the short run. That said, if a hot CPI also triggers equity stress and broader risk-off positioning, gold can regain support as capital rotates toward hedges over a medium-term horizon.
- A benign CPI supports lower real yields and a softer USD, which tends to reignite upside momentum and bring the highs back into focus.
2) Follow-through: Retail Sales and PPI
After CPI, Retail Sales, and PPI will be used to determine whether CPI was a one-off or part of a broader inflation impulse. At current price levels, gold is extremely sensitive to the real-yield path, so confirmation (or contradiction) matters.
3) Sentiment remains “priceable.”
Gold has been trading with a clear geopolitical bid in early January. If headlines intensify, gold can rally even in a mildly higher-yield environment. If headlines cool, gold tends to trade more “macro-pure,” meaning it becomes more directly driven by USD and real yields.
Gold (XAU/USD) Technical Outlook (Daily Bias)
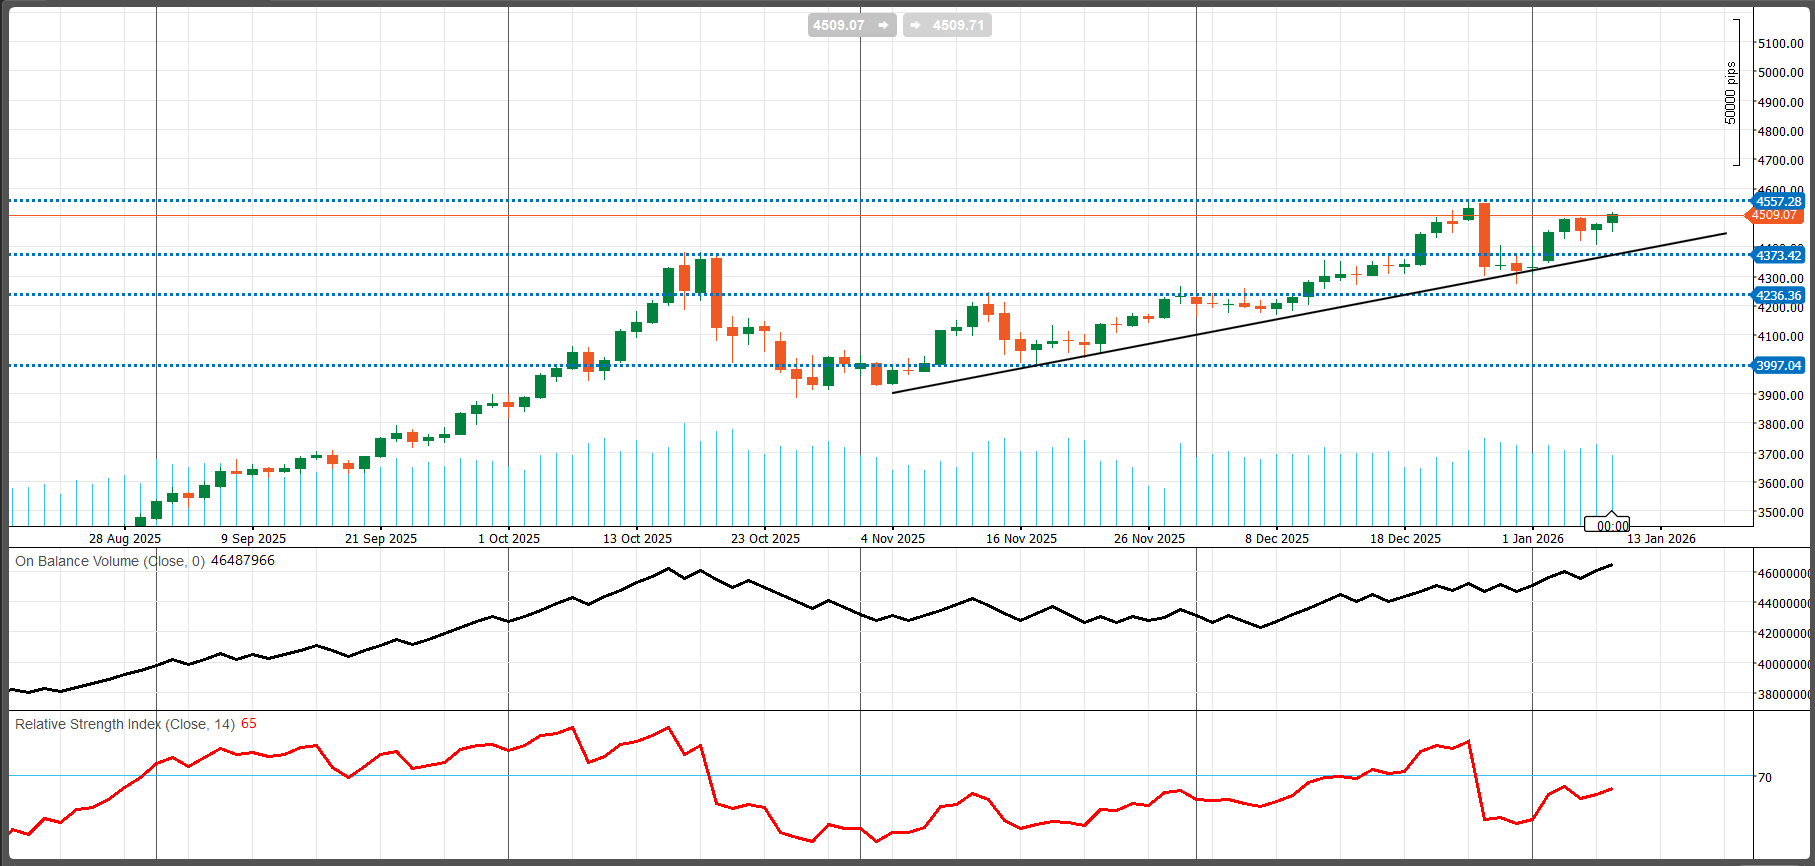
Gold remains technically strong and is still trading near record territory. The market is holding close to the late-December peak zone, with spot near $4,524/oz, leaving it within reach of the ~$4,550 area that has recently acted as the cycle high.
Key levels for the week
Resistance (upside hurdles)
- $4,550: recent peak zone. A clean break and hold above this level would reopen upside continuation.
- $4,600 then $4,700: psychological extension levels if gold re-enters “price discovery.”
Support (downside line-in-the-sand)
- $4,450–$4,430: first meaningful demand zone and recent consolidation area.
- ~$4,400: deeper support and a natural pullback target if yields or the USD rebound sharply.
Technical takeaway: As long as gold holds above the mid-$4,4xx zone, the structure remains trend-supported and consistent with a “buy-the-dip” market. Sustained acceptance below that band would signal a deeper corrective phase rather than a simple consolidation.
Oil — Current Market and Weekly Outlook
Oil’s baseline remains bearish as oversupply expectations for 2026 continue to build. In the absence of a clear supply shock, rallies are likely to be sold, and the market remains vulnerable to a gradual grind toward multi-year support.
Current market condition
Crude continues to trade with a heavy tone because the dominant narrative is 2026 surplus risk, not near-term demand scarcity. Recent downside drift is consistent with a market where incremental supply headlines matter more than geopolitical anxiety—particularly if U.S. firms gradually restore Venezuelan flows and investors begin to price a looser global balance into next year. That downside bias becomes more pronounced if the probability of a Russia–Ukraine ceasefire rises, as any reduction in disruption risk tends to compress the geopolitical premium embedded in crude.
From a price perspective, the market is entering the week in a low-price, supply-heavy regime. Brent is trading around $63/bbl and WTI around $59/bbl, following a rebound that looks more like headline-driven mean reversion than a decisive trend reversal.
Analyst expectations reinforce the bearish framing. A Reuters poll points to average prices easing in 2026 (roughly Brent ~$61.27 and WTI ~$58.15) and describes a potential surplus that could range from about 0.5 to 3.5 mb/d, with some forecasts explicitly allowing for downside into the mid-$50s.
Energy Snapshot: Crude Draw, Large Product Builds, Tighter Gas Storage
Energy data mattered this week because it feeds directly into near-term inflation narratives:
- EIA crude inventories: -3.832M (larger draw than expected)
- Gasoline inventories: +7.702M (very large build)
- Distillates: +5.594M (build)
- Natural gas storage: -119 Bcf (larger-than-expected draw)
Meanwhile, Baker Hughes oil rigs fell to 409 (from 412), suggesting slightly softer drilling momentum.
Net assessment: crude looked tighter in the headline, but large product builds argue that refined product balances—potentially driven by seasonal patterns, demand dynamics, and refining activity—are doing some of the near-term inflation work, particularly around gasoline.
Policy and geopolitics: still relevant, but not consistently supportive
On policy, OPEC+ appears focused on defending the floor rather than driving a rally. Key members have reiterated their commitment to market stability and maintained voluntary adjustment guidance, effectively keeping supply management in place rather than accelerating output increases.
Geopolitics remains a swing factor, but it is cutting both ways:
- Some headlines add a short-term risk premium, yet the market is also weighing the prospect of incremental Venezuelan supply over time if rehabilitation efforts progress—an additional headwind in an already surplus-focused market.
- Reuters’ survey also showed OPEC output fell in December, largely due to Iran and Venezuela, which can tighten prompt conditions. However, the market is treating these as offsets within a broader oversupply story rather than a durable bullish driver.
What will drive the price this week?
- Inventory reality check: EIA weekly report (Wednesday)
- The most consistent weekly catalyst is the EIA Weekly Petroleum Status Report, due Wednesday, Jan 14. In a surplus narrative, crude tends to react most to the combination of crude and product stock changes—builds that confirm demand softness are typically bearish, while simultaneous tightening in crude and products can offer short-term support.
- 2026 balance-sheet framing: EIA STEO (Tuesday)
- The EIA Short-Term Energy Outlook (STEO) is due Tuesday, Jan 13. It is one of the key inputs for how the market frames 2026 supply-demand dynamics and price expectations.
- Supply expectations: OPEC+ and “return barrels.”
- OPEC+ messaging can stabilize sentiment, but the bigger issue is whether non-OPEC supply growth and potential “return barrels” (including Venezuela, alongside steady U.S. and Brazil flows) keep 2026 comfortably supplied.
Technical outlook: key levels and scenarios (WTI)
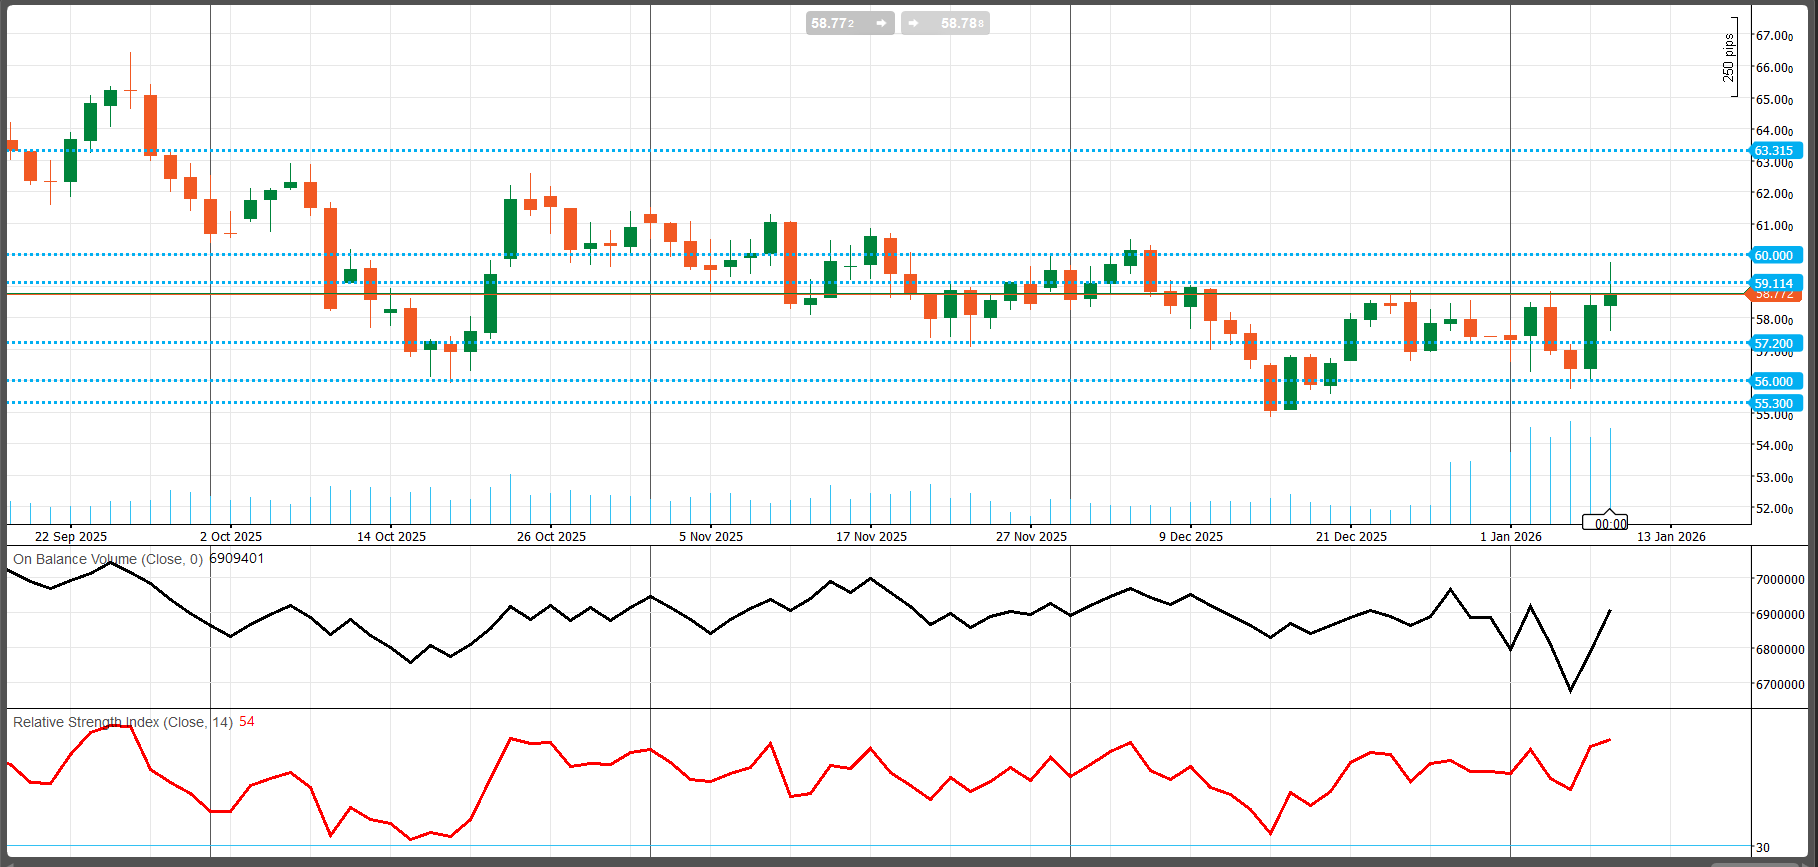
WTI remains below $60, after recently printing lows in the mid-$50s, keeping the broader structure heavy.
Support
- $55.0–$56.0: Primary support zone (recent lows were roughly $55.76–$55.97).
- A clean break below this area increases the risk of fresh multi-year lows, with the market continuing to treat $55 as the key inflection level.
Resistance
- $60.0: The first major “line in the sand.” A sustained daily close above $60 is typically needed to shift the short-term bias from a corrective bounce to a more durable recovery.
- $62–$63: Secondary resistance zone (the upper boundary of the recent rebound range).
Technical takeaway
While WTI holds below $60, rallies still look vulnerable to selling pressure, consistent with the bearish fundamental backdrop. To materially improve the technical picture, the market needs sustained acceptance above $60—ideally supported by inventory tightening or a credible shift in the 2026 balance narrative.
Crypto Market Condition and BTC Weekly Outlook
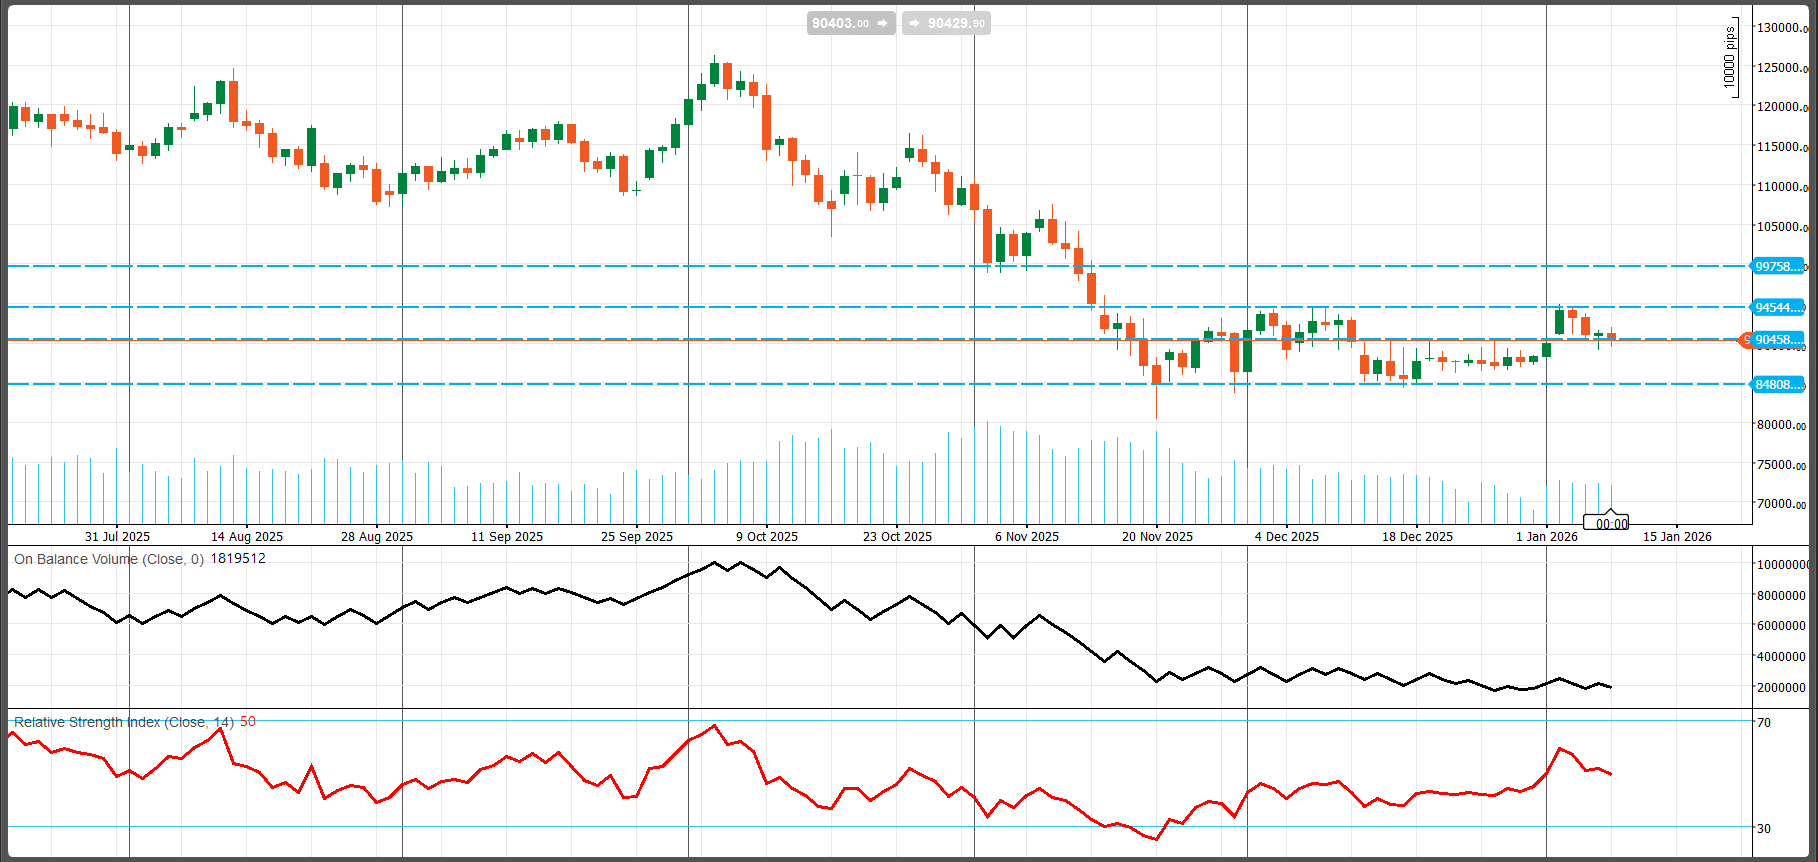
Bitcoin has moved back into the low-$90,000s, currently around $90.9k. The tone has turned more defensive as flows shifted from supportive to risk-off. U.S.-listed spot Bitcoin ETFs have recorded a clear reversal, with reports pointing to roughly $681 million in net outflows in the first full week of 2026 and a multi-day outflow streak totaling $1.1 billion+.
Volatility is priced for movement, but spot conviction looks mixed. Implied volatility in BTC options (Jan 2026 contract) is running in the high-30% range, which is consistent with a market anticipating event risk around macro releases and policy headlines rather than trending cleanly on fundamentals alone.
Policy and institutionalization headlines remain active—particularly around stablecoins and charter discussions. That backdrop is constructive for the long-term “institutional plumbing” narrative, but it also increases the risk of short-term headline-driven price swings.
BTC weekly outlook: fundamental drivers
1) Macro is the primary catalyst — U.S. CPI and rates repricing
Crypto continues to trade as a high-beta expression of the real-yield and USD impulse, making U.S. CPI (Dec 2025) the top event risk this week. The market then looks for confirmation through U.S. Retail Sales (Nov 2025).
The reaction function is straightforward:
- A hot CPI that pushes real yields higher and USD firmer typically pressures BTC—especially in an environment where ETF flows are already negative.
- A benign CPI that allows yields to ease tends to stabilize risk appetite and can support a sharp rebound, particularly if positioning is cautious and flows begin to stabilize.
2) ETF flows are the second key driver — sentiment and liquidity
Near-term price action is being heavily shaped by the direction of spot BTC ETF flows. After several sessions of sizable redemptions, the key question is whether CPI week brings:
- Renewed inflows (a risk-on confirmation signal), or
- Continued outflows (risk-off reinforcement that keeps rallies capped).
3) Policy/regulatory narrative remains supportive, but headline-sensitive
Stablecoin and market-structure legislation continues to evolve, and recent reporting around charter initiatives and a federal stablecoin framework keeps policy in focus. This supports the longer-run institutional adoption thesis, even if it does not translate into immediate week-to-week upside in spot prices.
BTC technical view (daily timeframe)
Key resistance
- $95,000: the most immediate resistance and a recent rejection zone (BTC approached this area before rolling over).
- $100,000: the major psychological level. A move back above it likely requires a supportive macro backdrop (softer yields/USD) and improved flow conditions.
Key support
- $90,000: the primary psychological and pivot support (price is currently just above it).
- ~$89,300: the prior notable swing-low reference from late 2025; a clean break below $90k puts this zone in play quickly.
Tactical roadmap
- Holding above $90k with improving macro/flows: bias shifts to a recovery attempt toward $95k.
- Sustained daily acceptance below $90k: increases the probability of a move toward the high-$89k area and keeps rallies under pressure until flows stabilize.
Comments