 English
 پارسی


Watch the Analytical Video
Global Economy Review: Relief in Markets, Fragility in the Real Economy
Oil fears eased, risk appetite improved, but the world economy still ended the week looking uneven, vulnerable, and far from a broad-based recovery.
Last week, I saw the global economy move from a sharp oil-shock scare into a fragile relief rally, but the underlying macro picture did not suddenly become healthy. The week began with a serious stagflation fear: markets were worried that disruption around the Strait of Hormuz would keep energy prices high, slow growth, and push inflation back up. That risk became more concrete when the IMF cut its 2026 global growth forecast to 3.1% from 3.3% and warned that, under a more severe oil-shock scenario, world growth could slow to around 2.0%, a level uncomfortably close to recession territory.
The biggest shift came from energy. As hopes for renewed U.S.-Iran talks improved and the market briefly treated Hormuz as effectively reopened for commercial shipping, oil rapidly gave back part of its war premium. By Friday, Brent had fallen about 9% and WTI about 11%, helping global equities rally and pushing Wall Street to fresh record highs. That move changed the entire macro tone. Instead of focusing on a new inflation shock, investors began asking whether the worst of the energy squeeze had already passed.
In the United States, the data were mixed but broadly reassuring. March producer prices rose 0.5% month on month and 4.0% year on year, both below expectations, which helped ease some inflation concerns. At the same time, industrial production fell 0.5% in March, and manufacturing output slipped 0.1%, showing that activity was not especially strong. Still, initial jobless claims dropped to 207,000, keeping the labor-market picture firm. I came away with the view that the U.S. economy still looked resilient, but not strong enough to claim a real reacceleration.
Europe also delivered a mixed picture. In the UK, GDP grew 0.5% in February and 0.5% in the three months to February, both better than expected. In the euro area, industrial production rose 0.4% month on month in February, but remained down 0.6% year on year. The bloc’s goods trade balance returned to a modest €11.5 billion surplus, yet exports were still down 6.7% from a year earlier. Europe, therefore, ended the week looking more stable than feared in the short term, but still exposed to high energy sensitivity, weak trade momentum, and soft industrial demand.
Asia reinforced the same broader story: resilience at the headline level, softness underneath. China’s Q1 GDP grew 5.0% year on year, beating expectations, and quarterly growth reached 1.3%. But retail sales rose only 1.7% in March, while export momentum slowed sharply, showing that domestic demand and external demand were both less convincing than the GDP headline suggested. In Japan, expectations for an April Bank of Japan rate hike collapsed from around 70% earlier in the month to roughly 10%, reflecting a more cautious policy stance as Middle East risks remained in focus.
My main conclusion is simple: the world economy ended the week in a better market position than macro position. Financial conditions improved because oil fell and de-escalation hopes rose. But the real economy still showed weak industry in places, softer trade in Europe, weak consumption in China, and ongoing policy uncertainty in Japan. The world avoided a worse near-term shock, but it still looks uneven, fragile, and highly sensitive to oil, shipping, rates, and confidence.
Global Economy Faces a Crucial Reality Check This Week
Growth is losing momentum, inflation risks remain alive, and fresh data will show whether markets have moved ahead of the real economy
The global economy enters Week 17 with a difficult mix that markets can no longer ignore: growth is slowing, but inflation pressure has not fully disappeared. I see this week as an important test of whether the recent recovery in market sentiment is actually supported by the underlying economy. The message coming out of the spring policy meetings is clear. The world is still dealing with the aftershocks of the Middle East conflict, especially through energy prices, business confidence, and inflation expectations. Under a limited-conflict scenario, global growth is now seen at 3.1% in 2026 and 3.2% in 2027, while headline inflation is expected to rise modestly this year before easing again in 2027.
This is not a week dominated by central-bank meetings, but it still matters because the data calendar can reshape the market narrative. The first major event arrives on Tuesday, April 21, when the United States releases March retail sales after the report was postponed from April 16. That will be one of the clearest readings on whether the consumer is still holding up. On the same day, the Senate hearing for Fed chair nominee Kevin Warsh could also influence expectations for rates, the dollar, and broader market pricing.
The most important global data point comes on Thursday, April 23, when flash PMIs are released across major economies including Australia, Japan, India, France, Germany, the euro area, the UK, and the U.S. I see this as the best single-day test of whether the recent oil shock is fading into a soft-landing narrative or turning into something more troubling, where weaker growth collides with firmer prices. In Europe, these numbers carry added importance because inflation risks linked to energy are still keeping policy expectations uncertain.
In Asia, the tone remains steadier. China’s April loan prime rates are expected to stay unchanged after Q1 GDP accelerated to 5.0%, suggesting Beijing is not yet under pressure to deliver broader easing. That shifts attention toward exports, manufacturing, and services, where resilience will matter more than policy headlines.
Confidence data will also shape the week. Europe updates flash consumer confidence on April 22, while the University of Michigan releases final April sentiment on Friday, April 24, after the preliminary reading dropped to a record-low 47.6. If confidence and PMIs improve together, risk appetite can extend. If not, markets may quickly move back into a more defensive stance.
USA
The U.S. week ahead is about whether the market’s optimistic price action is running ahead of the data. My base case is that the economy still looks slow-but-not-broken: labor is steady, growth is positive but softer, and the consumer is under pressure but not yet rolling over. That should keep the week’s center of gravity on retail sales, flash PMIs, and Fed/policy headlines. A stronger-than-expected consumer read would keep the equity rally alive, and likely lean bearish for Treasuries; a weak retail number plus soft PMIs would quickly revive the growth scare and help bonds/defensives. The wildcard remains geopolitics: if oil stays lower, the market can keep leaning into disinflation relief; if oil rebounds, the week could flip back into a higher-yields, more defensive macro tape.
U.S. Economy Ends the Week Stronger in Markets Than in Fundamentals
Inflation pressure eased, equities surged, and oil collapsed lower, but the underlying economy still sent a mixed signal across industry, housing, labor, and consumer demand.
The U.S. economy ended the latest week with a much better market mood than real-economy message. I saw a macro backdrop that remained broadly resilient, but far from clean. The biggest relief came from inflation, while the biggest warning came from weaker hard activity data. At the same time, financial markets pushed sharply higher because investors focused less on domestic softness and more on falling oil prices, easing geopolitical tension, and renewed confidence in a soft-landing scenario. That created a familiar split: Wall Street looked increasingly comfortable, while the real economy still looked uneven beneath the surface.
Inflation was the week’s most important stabilizer. March producer prices rose 0.5% month on month and 4.0% year on year, both below expectations, while core PPI increased just 0.1% on the month and 3.8% on the year. That mattered because it suggested inflation pressure had not spread aggressively through the broader producer base. The worst of the pressure still looked concentrated in energy-sensitive headline categories rather than across the full pricing structure. I took that as a meaningful sign that inflation remained uncomfortable, but not as threatening as markets feared when oil surged earlier. Trade-price data reinforced the same idea. Import prices rose 0.8% month on month and 2.1% year on year, while export prices increased 1.6% month on month and 5.6% year on year. These numbers showed that traded-goods inflation was still elevated, but they did not point to a new uncontrolled inflation wave.
The growth picture, however, was much less straightforward. On the survey side, the tone improved sharply. The Philadelphia Fed Manufacturing Index jumped to 26.7 from 18.1, while new orders surged to 33.0 from 8.6. The Empire State Manufacturing Index also improved. Those forward-looking indicators suggested that business sentiment, order flow, and industrial expectations were still holding up reasonably well. But the hard data told a weaker story. Industrial production fell 0.5% in March, manufacturing production slipped 0.1%, and capacity utilization dropped to 75.7% from 76.1%. That gap matters. It tells me confidence was improving faster than actual output, which is not the same as a real industrial recovery. In short, businesses sounded better than factories looked.
The labor market stayed solid, but not perfect. Initial jobless claims fell to 207,000, down from 218,000 and below expectations, showing that layoffs remained contained. That is still one of the clearest signs that the U.S. economy has not moved into a broad deterioration phase. But continuing claims rose to 1.818 million, suggesting that once workers lose jobs, it may be taking a bit longer to find new ones. I do not see that as a major breakdown, but it does fit a labor market that remains healthy on the surface while becoming slightly less tight underneath. This is still a supportive labor backdrop, just not a flawless one.
Housing remained one of the weakest areas. The NAHB Housing Market Index fell to 34, down from 38 and below expectations, signaling softer builder confidence. Mortgage rates eased somewhat, and applications increased, but most of that improvement came from refinancing rather than a strong pickup in fresh home demand. To me, that says affordability pressure is still weighing on the sector and that housing has not yet joined the broader market optimism. Consumer signals were also mixed rather than strong. The Redbook index slowed to 7.0% year on year from 7.6%, which still pointed to decent retail momentum, but not to a convincing reacceleration in spending. Demand remained positive, but not powerful enough to shift the broader macro narrative.
One of the more supportive pieces of the week came from capital flows. TIC net long-term transactions rose sharply to $58.6 billion, up from $2.4 billion, while total net capital flows jumped to $184.5 billion from -$38.4 billion. That suggested foreign demand for U.S. assets improved materially, providing an important cushion for the macro backdrop. In financial markets, though, the tone improved far more dramatically than the economic data alone would justify. Equities rallied hard, with the S&P 500, Nasdaq, and Dow Jones all rising strongly, helped by softer-than-feared inflation, strong earnings, and a sharp drop in oil prices after the temporary reopening of the Strait of Hormuz. The dollar weakened as safe-haven demand faded, while Treasury yields softened as immediate inflation fears eased. Financial conditions therefore improved, even though the underlying economy still looked mixed.
My conclusion is that the key change this week was not that the U.S. economy suddenly became strong. The real change was that markets moved away from pricing an energy-shock scenario and toward pricing de-escalation, lower oil, and a softer inflation path. That shift was enough to lift risk appetite sharply. But the fundamental picture remained uneven. Inflation looked better, but not fully solved. Labor stayed resilient, but not flawless. Surveys improved, but hard output weakened. Housing stayed soft. Consumer demand held up, but did not boom. The U.S. economy still looks stable enough to avoid immediate trouble, yet it remains highly sensitive to oil prices, confidence, and the next round of activity data.
U.S. Economy in Week 17: Resilient Consumer, Sticky Inflation, and a Crucial Test for Markets
Retail sales, Fed politics, PMIs, and sentiment data will decide whether the U.S. economy is still absorbing the shock or beginning to bend under slower growth and higher prices.
The U.S. enters the week ahead with a macro picture that still points to expansion, but the balance is becoming more uncomfortable. Growth has slowed, inflation remains too firm for comfort, and confidence has weakened sharply. I do not see an economy that is breaking, but I do see one that is being tested from several directions at once. By late 2025, real GDP growth had already cooled to just 0.5% annualized in Q4, and the live estimates for Q1 2026 are still modest, with the Atlanta Fed GDPNow model near 1.3% and the New York Fed nowcast closer to 2.3%. That is not recession territory, but it is far from the kind of growth that gives policymakers room to relax. At the same time, the labor market is still holding together. March payrolls increased by 178,000, the unemployment rate stood at 4.3%, and initial jobless claims fell to 207,000 in the week ended April 11. The economy is still standing, but it is doing so with less momentum and more inflation pressure than markets would prefer.
Inflation remains the most difficult part of the story. March CPI rose 0.9% month on month and 3.3% year on year, while core CPI held at 2.6% year on year. March PPI added another warning sign, rising 0.5% on the month and 4.0% on the year. These are not numbers that allow the Federal Reserve to turn comfortably dovish. They show that price pressure is still uncomfortably firm, especially after the energy shock tied to the Iran conflict. Even if the worst oil panic has eased, the inflation impulse has not disappeared. That is why this week matters so much. Markets want evidence that consumer demand is holding up without creating a second wave of inflation and that business activity is not weakening fast enough to turn soft-landing hopes into renewed recession fears.
The first major test comes on Tuesday, April 21, and it is an important one. March retail sales will be the key release of the week. I see this report as the clearest near-term check on the strength of the American consumer, which has remained the core support for the entire expansion. Headline retail sales are expected to rise by 2.0% in March, and high-frequency card data suggests household spending remained reasonably firm into early April. But the headline may flatter the real picture. Retail sales are nominal, which means part of that gain may simply reflect higher prices rather than stronger volume. Gasoline likely played an outsized role as fuel prices moved higher, and consumer goods prices rose 2% month on month in March. So even if the top-line number looks strong, I will read it carefully. A solid print would support the idea that households are still absorbing the shock. A weak print would raise the risk that collapsing sentiment is starting to show up in actual spending.
That same Tuesday also brings a major policy and market event: Kevin Warsh’s Senate Banking Committee confirmation hearing. This matters not because traders expect an instant change in Fed policy, but because it could shape expectations for the next phase of Fed leadership, communication, and independence. Warsh was nominated on January 29, but the process has stalled, and Powell’s term as Chair ends in May. If Warsh is not confirmed by then, Powell would remain Chair pro tempore until a successor is approved. Markets will be listening for clues about Warsh’s view on the current fed funds rate, his sense of the longer-run neutral rate, and his approach to balance-sheet policy and Fed signaling. I expect him to stay cautious and avoid unnecessary controversy, but even limited signals could matter in a market already sensitive to inflation, rates, and political pressure on the central bank.
Later in the week, the growth debate shifts from the consumer to business activity and labor. On Thursday, April 23, weekly jobless claims and the April flash PMIs will offer the freshest look at layoffs and business momentum. This is especially important after March industrial production fell 0.5% and manufacturing output slipped 0.1%. Hard industrial data have already softened, so PMIs now matter as an early guide to whether April is bringing stabilization or further loss of momentum. If PMIs hold up, markets will likely conclude that the industrial slowdown remains manageable. If they weaken, the narrative could shift quickly toward a broader slowdown in activity.
Housing is also part of the week’s macro test, even if it is not the main headline. March pending home sales are due on Tuesday and should be watched closely because they lead existing-home closings. Housing has already shown signs of strain, and the existing-home market remains soft, with March existing-home sales down 3.6%. If pending sales disappoint as well, it would reinforce the idea that mortgage rates and weak confidence are still constraining rate-sensitive sectors. That would matter because housing often acts as an early signal of broader pressure on consumers and financing conditions.
By Friday, April 24, attention turns back to sentiment with the final April University of Michigan reading. The preliminary print collapsed to a record-low 47.6, and that makes the final release more important than usual. If confidence remains that weak, even solid retail sales may start to look like a lagging indicator rather than proof of ongoing strength. If sentiment recovers even modestly, markets may feel more comfortable holding onto the resilience narrative.
The bigger picture is that the U.S. economy enters this week with a mixed but still expansionary profile. The labor market is stable, but growth is slower. Inflation has eased from its worst fears, but it is still high enough to keep the Fed cautious. Consumer demand has held up, but sentiment has cracked. Business activity has not collapsed, yet hard production data have weakened. Financial markets are also facing heavy crosscurrents from oil, earnings, Treasury supply, and Fed politics. The S&P 500 closed at 7,126.06, the Nasdaq at 24,468.48, and the Nasdaq just posted its 13th straight gain, helped by falling oil and easing Middle East fears. But crude was still around $85 on Friday, far above the roughly $67 level seen in late February, so the inflation pressure has eased, not vanished. That is why I see this week as a real macro test. If retail sales, PMIs, and sentiment hold up, markets can keep leaning into resilience. If they weaken, the debate over slower growth and stubborn inflation will come back fast.
USD and Wall Street Market Condition, and Outlook for the Week Ahead
USD and Wall Street were that markets increasingly priced a world of lower oil, less immediate geopolitical stress, softer inflation pressure, and continued earnings resilience. That was bearish for the dollar and strongly bullish for U.S. equities. But it was also a setup that remains highly conditional. If the diplomatic path holds, the dollar can stay soft, and equities can remain near highs. If it fails, the reversal could be fast.
Wall Street Enters a High-Stakes Week
Lower oil, softer geopolitical stress, and strong earnings lifted equities and pressured the dollar, but this setup still depends heavily on diplomacy and follow-through in profits.
Wall Street enters the new week with strong momentum, while the U.S. dollar starts on a softer footing as markets continue to price a world of lower oil, reduced geopolitical stress, easing inflation pressure, and resilient corporate earnings. That combination was clearly bullish for U.S. equities and bearish for the dollar. But I still see this as a highly conditional setup. If the diplomatic path between the U.S. and Iran holds, the dollar can remain under pressure, and equities can stay close to record highs. If that path breaks down, the reversal could be fast and aggressive.
The equity rally has been impressive. The S&P 500 closed at 7,126.06, while the Nasdaq ended at 24,468.48. Even more striking, the Nasdaq has now risen for 13 straight sessions, its longest winning streak since 1992. The S&P 500 has rebounded roughly 12% from its March 30 low, showing how quickly sentiment has turned once oil dropped and fears around the Middle East eased. The message from the market has been simple: softer inflation, lower oil, improving U.S.-Iran diplomacy, and solid earnings from major banks have all helped investors rebuild confidence.
The composition of the rally also matters. This has not been only another large-cap tech move, even though big technology remains central. As oil prices fell, travel stocks, airlines, cruise lines, and other consumer-sensitive sectors also surged. At the same time, energy stocks lagged badly, which showed that a key part of the war premium was being removed from crude. That broadening in market leadership improved the tone of the rally and made the tape look healthier.
Even so, I think the easy part of this rebound is probably over. The market has already priced in de-escalation, a supportive earnings season, and limited macro damage. That means the next leg higher likely needs real confirmation. Nearly one-fifth of S&P 500 companies report this week, so profits and forward guidance now matter much more. If earnings continue to beat and management commentary stays stable, equities can extend higher. If results disappoint, this rally becomes vulnerable to a sharper digestion phase because optimism has returned very quickly.
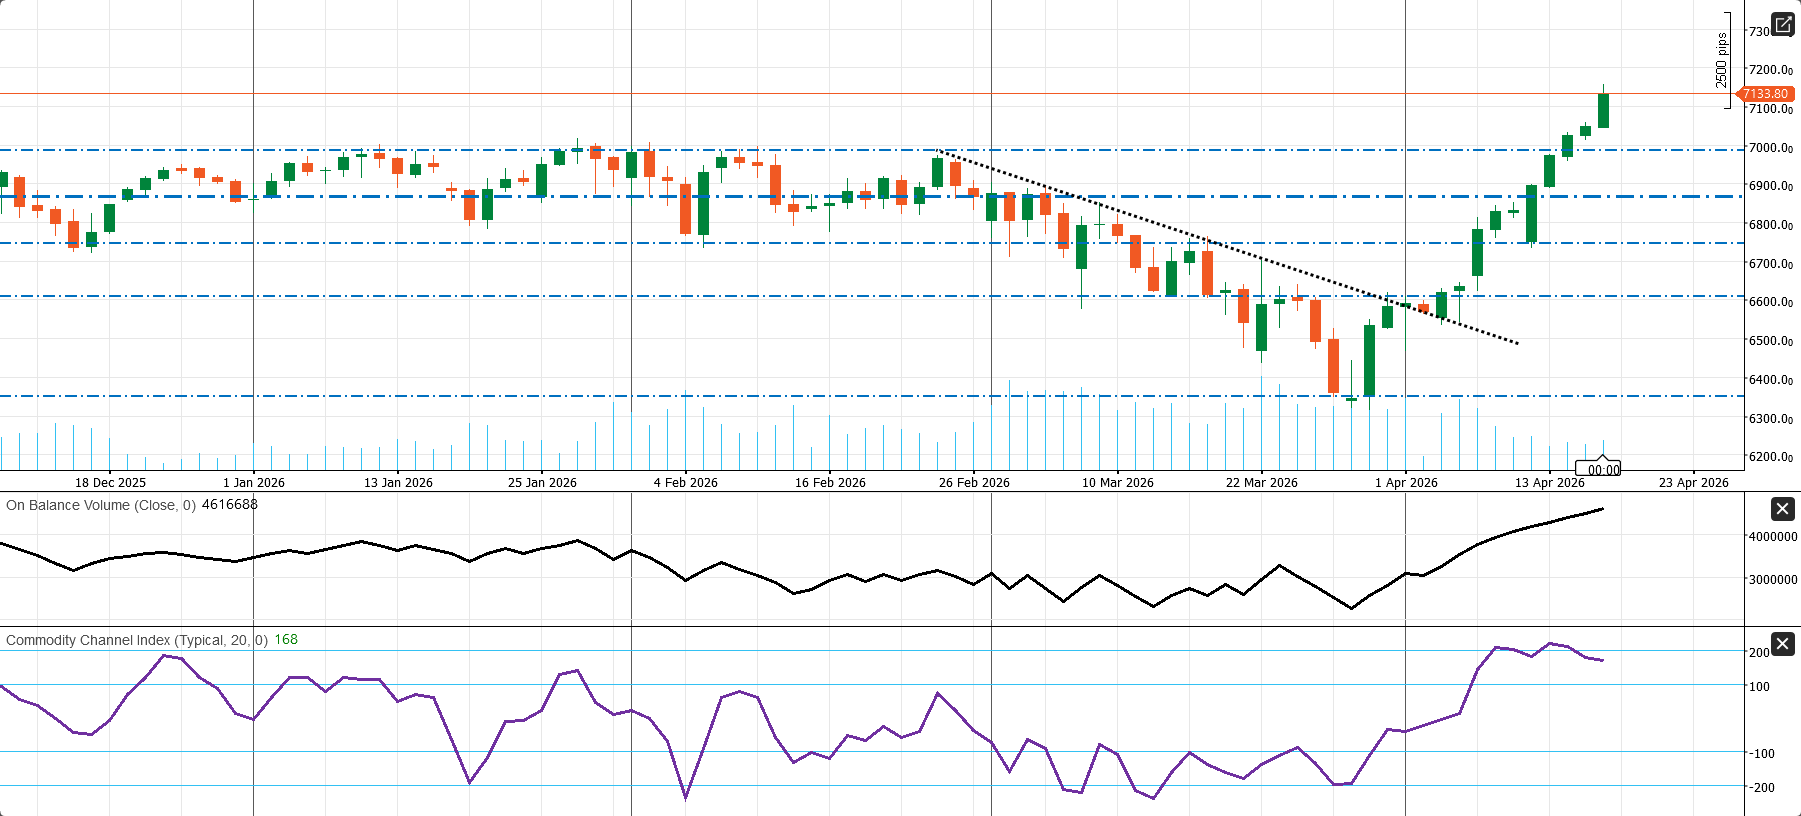
Technically, the US500 daily chart remains bullish, with the price around 7,133.80 near a major resistance zone. A daily close above that area would open the way toward 7,200. Support now sits around 7,000, then 6,850. Momentum is strong, and On-Balance Volume confirms solid participation, but the CCI at 168 also shows the market is stretched. My short-term view stays constructive, but I would not ignore geopolitical risk. If tension rises again after the ceasefire window ends and de-escalation stalls, markets could quickly sell risk assets even if earnings remain solid.
USD Faces a Crucial Week of Confirmation
The dollar has softened, equities are still riding a relief rally, and the next move now depends on whether economic data and geopolitics support the market’s optimism.
The U.S. dollar enters the new week on a softer footing, while Wall Street starts from a position of strength. I see both moves as part of the same macro story: markets have been pricing lower oil, reduced immediate geopolitical stress, softer inflation pressure, and enough economic resilience to keep the broader recovery narrative alive. That mix has been bearish for the dollar and bullish for U.S. equities, but it is still a fragile setup rather than a fully secure one.
For the dollar, the near-term tone remains weak. The dollar index fell to 97.96 on Friday after touching 97.632, its lowest level in roughly seven weeks, and finished the week down 0.6%, marking a second straight weekly decline. The main driver was the unwind of the safe-haven bid as the Strait of Hormuz remained open to commercial shipping during the truce window, which pushed oil lower and revived risk appetite. Treasury yields also softened, and rate futures moved to price a better than 50% chance of a Fed cut in December, up from 29.5% the prior session. Even so, I would not call this a structural dollar breakdown. The move still looks more like a geopolitical unwind than a broad repricing of a much weaker U.S. economy.
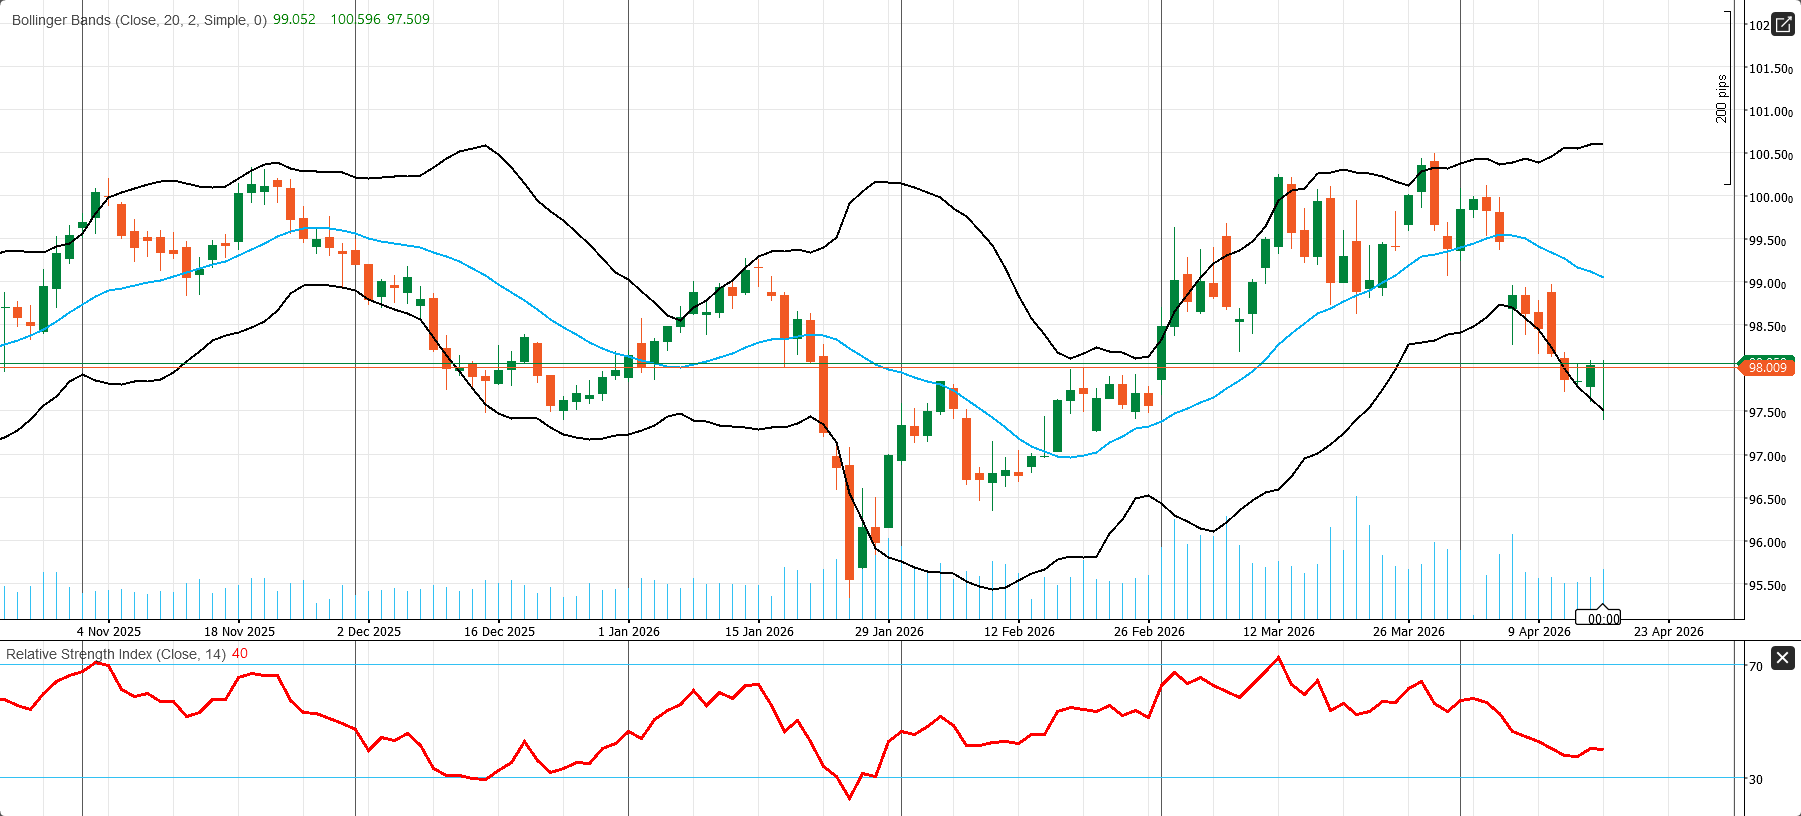
Technically, the picture still leans negative for the dollar. DXY is trading around 98.009, below the Bollinger midline at 99.052, with initial support near 97.50 and deeper downside risk toward 96.50 if that floor breaks. The RSI at 40 confirms that momentum remains soft. Unless the index reclaims the 99.05 area convincingly, the short-term bias stays cautiously bearish.
Wall Street, by contrast, enters the week with powerful momentum. The market has been supported by easing Middle East fears, lower oil prices, softer inflation stress, and improving confidence in earnings resilience. But now comes the harder part: markets need confirmation. The most important day is Tuesday, April 21, when March retail sales and Kevin Warsh’s Fed chair nomination hearing both hit the tape. Retail sales will show whether higher gasoline prices are starting to hurt consumer demand, while the hearing could affect expectations for Fed leadership, inflation policy, and rate cuts.
Then on Thursday, April 23, weekly jobless claims and the flash U.S. PMIs will offer a fresh read on labor conditions and business activity. On Friday, April 24, the final Michigan sentiment will test whether weak confidence is becoming more serious. My view is simple: if the data stays resilient and geopolitics remain calm, the dollar can stay soft, and equities can hold near highs. If either one breaks, the reversal could be sharp.
Key Earnings to Watch This Week
Tesla, Boeing, Intel, and Procter & Gamble will help shape the next move in Wall Street sentiment as investors test growth, execution, and consumer resilience.
This week’s earnings calendar matters because it reaches across some of the market’s most important themes: AI, industrial recovery, consumer strength, and the durability of the latest equity rally.
On Wednesday, April 22, Tesla delivers the week’s biggest single report. This is the first major mega-cap style earnings event in this stretch, and the bar is high. With Q1 2026 deliveries at their weakest level in a year, investors will be focused on margins, capital spending, the robotaxi narrative, and whether management can steady the core auto business. Boeing also reports the same day, and its results matter well beyond aerospace. March deliveries fell to 46 from 51, as wiring repairs affected around 25 Boeing 737 MAX jets, putting the spotlight on production execution, delivery timing, and cash-flow recovery.
On Thursday, April 23, Intel reports after the close. This is a key read for both semiconductors and the broader AI trade. Markets want proof that AI-related demand and operational execution are improving enough to support the stock’s recent rebound.
On Friday, April 24, Procter & Gamble reports before the open. This is less about market excitement and more about the consumer. After weaker U.S. spending hurt revenue in January, this report will show whether pricing power and volume resilience are still holding up.
Eurozone
The eurozone week ahead is a confidence-and-activity check, not a decisive turning point. The most important releases are Wednesday’s flash consumer confidence and Thursday’s flash PMIs, while the biggest day-to-day movers for the euro and eurozone stocks will still be oil, ECB rhetoric, and geopolitics. For the euro, the bias is mildly constructive as long as risk sentiment stays firm and the dollar remains soft, but the currency is vulnerable if survey data disappoint. For eurozone equities, the short-term bias is also constructive, but only if lower oil prices persist and the April data do not validate a sharper demand downturn. The strongest equity leadership should remain in banks, selected tech, travel, and luxury if the de-escalation narrative holds; the weakest area is likely still energy if crude keeps retreating.
Eurozone Economy Ends the Week in Fragile Stabilization Mode
Inflation picked up again, industry showed a modest rebound, and trade stayed positive, but the broader recovery still looked too weak to call secure.
The euro-area economy ended the week looking more resilient than the market feared at the height of the energy shock, but I still do not see a convincing recovery. What I see instead is a region trying to stabilize under pressure. Inflation turned firmer, industry stopped getting worse, and trade stayed in surplus, yet none of these developments were strong enough to suggest that the euro area has moved into a healthy new expansion phase. The overall message was one of fragile balance rather than renewed strength.
The biggest change came from inflation. Euro-area headline inflation rose to 2.6% year on year in March, up from 1.9% in February. That shift mattered because it showed the earlier energy shock was feeding back into prices across the bloc more clearly than before. The move was not isolated either. France’s inflation accelerated to 2.0% year on year, while Spain and Italy also showed firmer March price pressure. Germany added to the inflation story through a sharp rise in wholesale prices, reinforcing the idea that upstream costs were climbing again. This was an important macro development because it pushed the euro area away from a simple disinflation story and back toward a more uncomfortable mix of softer growth and renewed headline price pressure.
At the same time, I would not describe this as a fully hawkish inflation shock. The broader details still suggested that headline inflation was reaccelerating faster than the core trend. That distinction matters for the European Central Bank. If inflation is being driven mainly by energy and imported costs rather than by stronger domestic demand, policymakers face a more difficult trade-off. The ECB’s own policy discussion reflected that tension, highlighting how the Middle East conflict created an adverse energy terms-of-trade shock and weakened the euro against the dollar, both of which lifted inflation risk without necessarily improving growth. In other words, inflation became less comfortable, but not in a way that clearly signaled a stronger economy.
On the real-economy side, the picture improved only partially. Industrial production rose 0.4% month on month in February, which was better than expected and important after previous weakness. But annual production was still below year-earlier levels, so I see this less as a true industrial recovery and more as a temporary pause in the downturn. The factory sector looked more stable, but still historically soft. That is a meaningful difference, because stabilization is not the same as momentum.
The external side of the economy also looked better on the surface than underneath. The euro area’s goods trade balance returned to an €11.5 billion surplus in February, which showed that the bloc still retained an external cushion. But the current-account surplus narrowed, and exports were not strong enough to create a real growth impulse. Trade stayed constructive, but not dynamic.
Germany remained the clearest weakness in the regional story. With downgraded 2026 growth expectations and continued exposure to high energy prices and weak external demand, the euro area’s largest economy still looked vulnerable. That matters because Germany remains central to the bloc’s industrial performance. My conclusion is straightforward: the euro-area economy avoided a sharp deterioration, but it still finished the week caught between two pressures at once — weaker growth and firmer inflation. That is not a crisis, but it is still far from a clean recovery.
Eurozone Faces a Difficult Week of Growth Stress and Inflation Risk
Consumer confidence, PMIs, and ECB signals will show whether the eurozone is merely slowing or sliding deeper into a stagflation-style mix of weak demand and rising price pressure.
The eurozone enters the new week with a fragile macro backdrop that is not collapsing, but is clearly under pressure. I see the region caught between two problems at once: growth is already weak, and inflation risks have started to rise again because of the energy shock linked to the Iran war and broader Middle East tensions. That is a dangerous combination for Europe, because the economy was already struggling with soft consumer demand before the latest geopolitical disruption pushed oil and external risks higher.
The latest broad outlook reflects that tension. The IMF now sees euro area growth at just 1.1% in 2026 and 1.2% in 2027, both lower than previously expected. At the same time, euro area inflation is now seen at 2.6% in 2026, up from 2.1% in 2025. That tells me the region is not simply facing a normal slowdown. It is facing the risk of stagflation, where growth remains weak while inflation becomes harder to control. Christine Lagarde also made that risk more explicit by warning on April 17 that the Iran war poses a clear threat to both growth and inflation in the euro area.
This is why the coming week matters so much. The biggest question is whether the eurozone is only slowing or whether already-fragile demand is beginning to weaken further under the weight of higher energy costs and weaker confidence. The first major test comes on Wednesday, April 22, with the flash euro area consumer confidence release. This matters more than usual because March already showed a clear deterioration in sentiment. The euro area Economic Sentiment Indicator fell to 96.6 from 98.2, the Employment Expectations Indicator dropped to 96.4, and consumer confidence fell to -16.3, the weakest reading since October 2023. If April confidence weakens again, I would read that as a sign that household demand is softening further into the second quarter.
The second and most important market-moving release comes on Thursday, April 23, when the flash April HCOB PMIs are published. These figures should give the clearest signal on whether the eurozone is still expanding slowly or slipping closer to recession. If the PMI data hold up, markets can keep arguing that the region is absorbing the shock without a major break in activity. But if they weaken materially, recession fears are likely to return quickly, especially in banks, cyclicals, and rate-sensitive sectors.
ECB communication also matters this week. With Luis de Guindos speaking on April 21 and Philip Lane on April 22, every comment will be read through the lens of inflation risk and the possibility of another move later this year. That creates a difficult backdrop for the euro. The currency has recently been supported by dollar weakness and fading U.S. safe-haven demand, with the euro trading around $1.1789 on April 17 after touching $1.1848, an eight-week high. But this strength still looks driven more by external FX flows than by a clean hawkish ECB repricing.
For eurozone equities, the story is similar. The STOXX 600 entered the week with momentum after rising more than 1% on April 17, but the rally remains highly dependent on oil and geopolitical headlines. Travel, luxury, banks, and cyclical sectors can keep recovering if oil stays lower and confidence stabilizes. If energy prices rebound or survey data disappoint, Europe’s weak growth story will come back into focus very quickly. My view is simple: the eurozone is not in immediate collapse, but it is still highly exposed to energy, confidence, and policy risk, which makes this a very important week for the region.
EUR/USD Nears a Key Breakout Zone
The daily trend remains bullish, but price is now pressing into resistance where confirmation matters more than momentum alone.
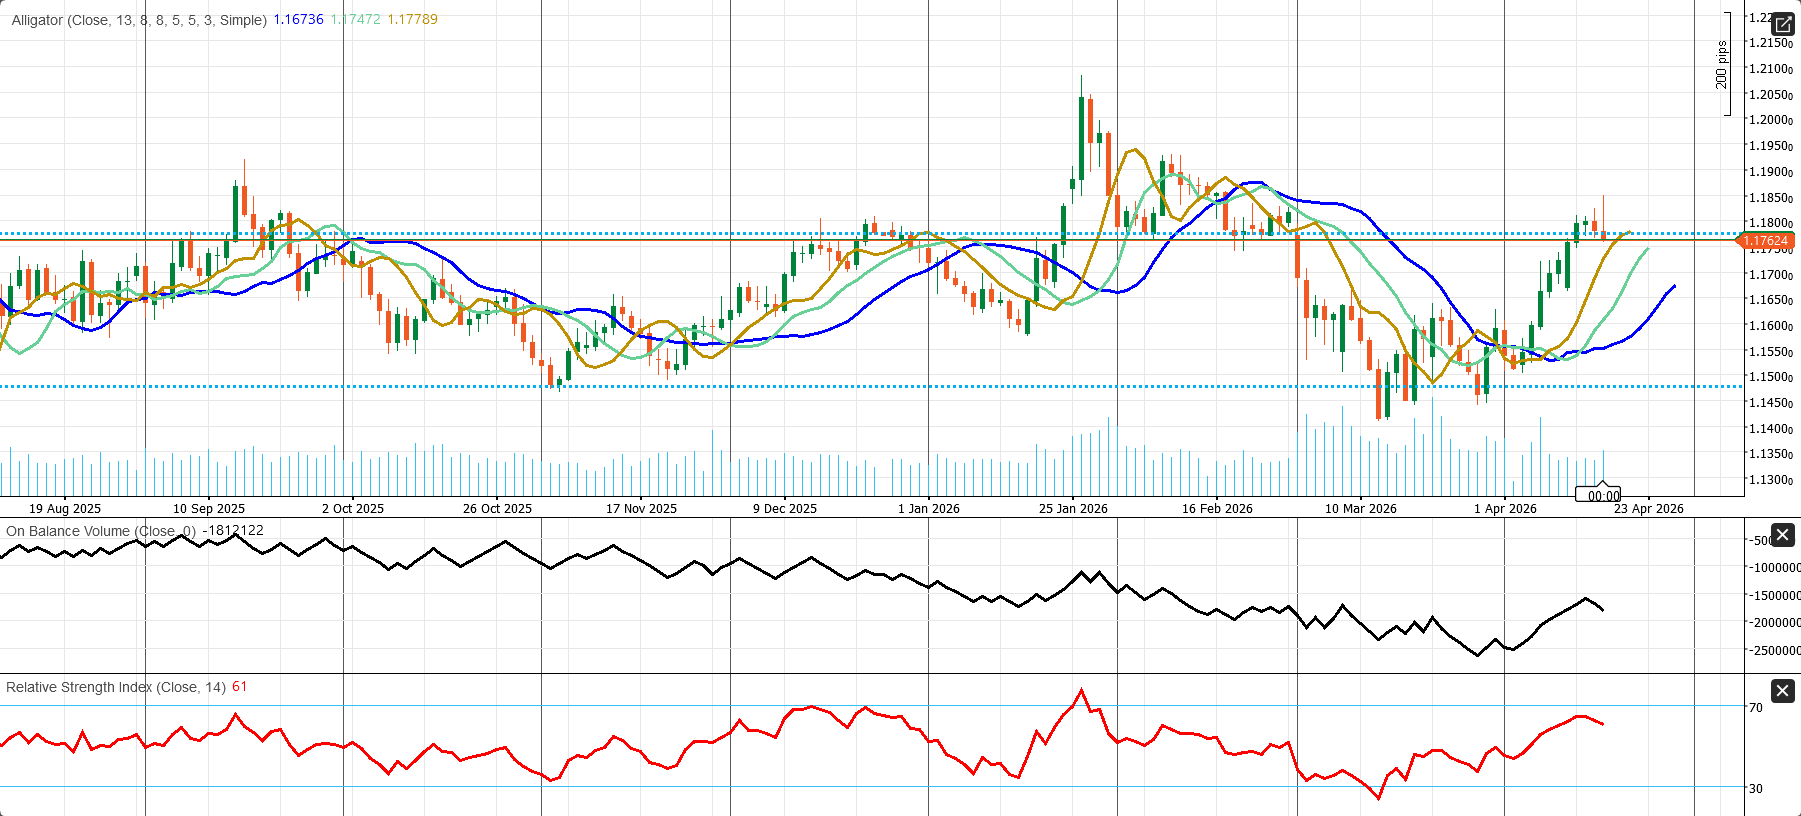
EUR/USD still looks constructive on the daily chart, but the pair is now trading just below an important resistance ceiling rather than in open upside territory. Price is near 1.17624, holding above the Alligator jaw at 1.16736 and the teeth at 1.17472, while sitting just under the lips at 1.17789. That structure keeps the broader recovery from the March low intact, but it also shows the market is entering a zone where breakout confirmation matters.
The rebound from the 1.1490–1.1500 support area has been strong, and the pair is now testing the 1.1775–1.1780 barrier. A daily close above that region would strengthen the bullish case and open the way toward 1.1850 and then 1.1900. On the downside, support sits at 1.1745–1.1675. With RSI at 61 and volume improving, the near-term bias remains moderately bullish.
Commodities market review and week ahead
Last week ended with much less immediate stress than it started with, but not with true stability. Oil’s collapse showed how much of the prior rally was a geopolitical premium. Gold’s rise showed that investors still wanted some protection even in a more optimistic market. And copper and nickel reminded the market that reopening a shipping lane does not instantly normalize every upstream industrial bottleneck. So, the energy and commodities picture improved meaningfully last week, but it remained fragile, headline-sensitive, and highly dependent on whether de-escalation in the Persian Gulf becomes durable rather than temporary, and that's exactly what can move and shape the market in the week ahead, as well.
Energy and Commodities Review:
Oil Collapsed, Gold Advanced, and Industrial Inputs Stayed Distorted
The commodity complex did not move as one block last week. Energy lost its war premium, precious metals held firm on lower yields and a weaker dollar, while parts of the industrial-metals space stayed supported by supply-chain disruption.
Last week, I saw the commodities story shift dramatically from an extreme Middle East supply-shock fear to a fragile de-escalation trade. That change produced one of the sharpest reversals of the year, especially in energy. But the move was not uniform across the complex. Oil fell hard as the market rapidly stripped out the geopolitical premium, while gold and silver continued to benefit from lower yields and a weaker dollar. Industrial commodities, meanwhile, remained more complicated because supply-chain distortion did not disappear as quickly as the oil panic did.
Crude oil was the biggest story. After trading near and above the $100 level earlier in the crisis, prices dropped sharply once Iran said the Strait of Hormuz in the Persian Gulf would remain open for commercial shipping during the ceasefire window. By Friday’s settlement, Brent had fallen $9.01, or 9.07%, to $90.38 a barrel, while WTI dropped $10.48, or 11.45%, to $83.85. Even after that collapse, crude still remained well above pre-war levels near $70, which shows how much geopolitical premium had built into the market before the late-week unwind.
The oil narrative changed in two phases. Early in the week, traders stayed focused on disrupted flows through Hormuz, a critical route for global oil and gas trade. By late week, attention shifted toward reopening, possible U.S.-Iran progress, and visible vessel movement through the strait. Around 20 ships were reportedly seen moving out through Hormuz, helping calm immediate worst-case fears. Still, I do not see the bullish oil case as fully dead. The U.S. military blockade on Iran remained in place, and any failure in sanctions or nuclear negotiations could quickly bring shipping risks back into focus.
Inventory data added another layer. For the week ended April 11, U.S. crude inventories fell by 0.9 million barrels to 463.8 million barrels. Gasoline inventories dropped 6.3 million barrels, distillates fell 3.1 million barrels, and total commercial petroleum inventories declined by 9.0 million barrels. That kept the refined-products backdrop constructive, even if crude prices ignored that support in the face of shifting geopolitical risk.
Precious metals told a different story. Spot gold rose 1.5% to $4,861.32 on Friday, while U.S. gold futures settled 1.5% higher at $4,879.60. Gold gained more than 2% on the week and extended its winning streak to a fourth straight week. Silver also stayed fundamentally well supported, with the global market heading toward a sixth consecutive annual deficit, widening to 46.3 million ounces in 2026 from 40.3 million in 2025. In industrial metals, sulfur-chain disruption continued to lift costs and helped support copper above $13,000 per ton and nickel near $18,655 per ton. The result was a decompressed commodity market: oil fell, metals held up, and supply-side distortion stayed very much alive.
Gold Holds a Strong Floor, but the Easy Upside Is Gone
The market still has support from a softer dollar, central-bank demand, and geopolitical uncertainty, but next week’s direction will depend on the balance between oil, the Fed, and the dollar.
Gold enters the new week in a constructive position, but no longer in a one-way panic-driven rally. By the end of the latest week, spot gold was holding roughly in the $4,785–$4,830 per ounce area after touching a one-month high earlier in the week and extending its advance to a fourth straight weekly gain. That tells me the market still wants exposure to gold, but it is no longer paying the same kind of premium for immediate crisis protection that it did at the height of the Middle East shock. Gold is still strong, but the character of the rally has changed.
The fundamental story is now being driven by three forces at once. First, the U.S. dollar has softened, and that mechanically supports bullion by making it cheaper for non-dollar buyers. Second, the reopening of the Strait of Hormuz during the truce window pushed oil lower, which eased some of the market’s inflation fear and reduced pressure for a more hawkish Fed. That is also positive for gold because lower oil can help bring down real-rate pressure. Third, the same de-escalation headlines reduce the need for an urgent safe-haven bid. In practical terms, gold is no longer trading as a pure crisis hedge. It is now trading as a more balanced macro asset linked to the dollar, rates, and geopolitical headlines.
The most important macro variable for next week remains the Fed and the direction of U.S. rates. Fed Governor Christopher Waller said rate cuts are still possible later in 2026 if the war ends quickly, but he also warned that a prolonged conflict could embed inflation more deeply through energy and shipping. That is a crucial balance for gold. A cleaner path toward eventual Fed easing is supportive, while a renewed oil spike that keeps the Fed cautious would become a headwind. Gold does not need immediate cuts to stay firm, but it clearly benefits when the market believes the next major Fed move is eventually lower rather than higher.
Investment flows remain mixed, but still supportive underneath. Commodity funds focused on gold and precious metals attracted about $822 million in the latest week, which shows investor appetite is still there. But physically backed global gold ETFs saw record March outflows of $12 billion, cutting first-quarter inflows in half. That tells me Western ETF demand has become less reliable in the near term, even though broader precious-metals allocation remains alive. Gold is not being supported by one single investor base right now. Instead, support is coming from a wider and more uneven mix of macro allocation and strategic demand.
That longer-term demand base still matters a lot. Central banks bought a net 27 tonnes in February, and official-sector buying reached 31 tonnes just two months into 2026. China also remains a key pillar. Local gold ETFs in China recorded inflows for a seventh straight month, first-quarter Chinese gold ETF demand reached a record, and the PBoC extended its gold-buying streak to 17 months in March. That is one of the main reasons I still see a strong medium-term floor under the market. Even when speculative flow becomes choppy, official buying and Chinese investment demand continue to provide structural support.
There is also a physical-market complication worth watching. Indian banks reportedly halted some gold and silver import orders because of delays in formal government clearance, leaving some bullion stuck at customs. This is not yet the main global driver, but India is one of the world’s most important precious-metals markets, so any sustained disruption could tighten local supply and distort short-term physical flows. It adds one more layer of support risk beneath the surface.
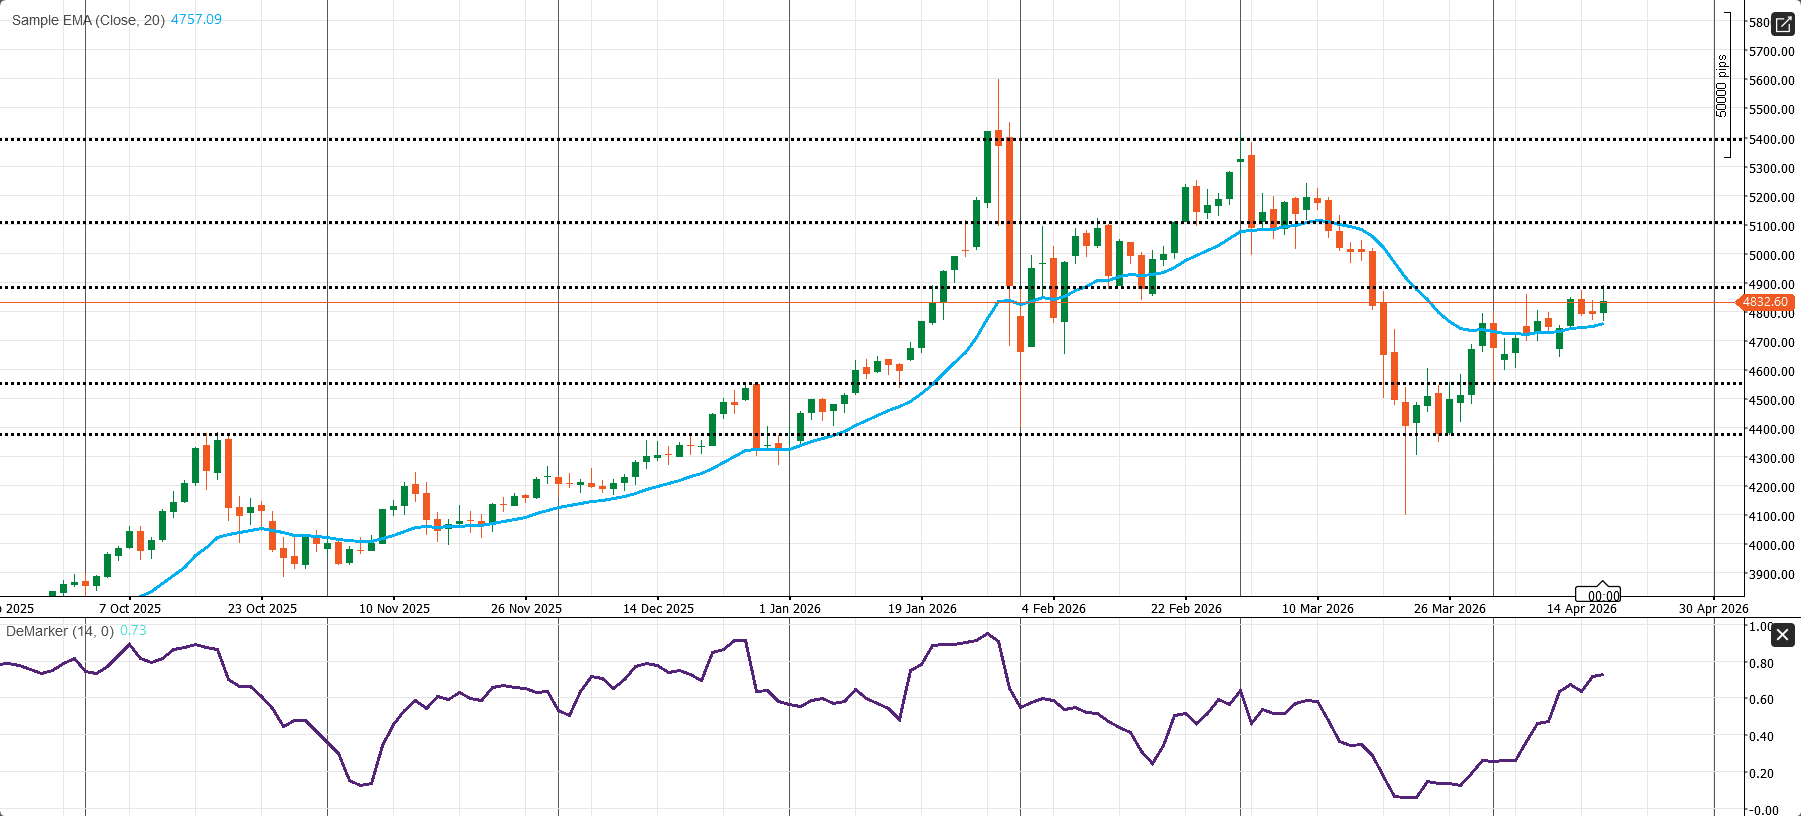
Technically, the daily chart still looks constructive. XAU/USD is trading near 4,832.60, above the 20-day EMA at 4,757.09, which shows the short-term structure has improved after the late-March correction into the 4,400–4,550 area. But price is now pushing directly into the 4,900 resistance band, and that is the key decision zone. A clean daily break above 4,900 would strengthen the bullish continuation case and open the way toward 5,100 and then 5,400. On the downside, support starts around 4,757, then 4,550, and then 4,400. Momentum is supportive, with the DeMarker near 0.73, but that also shows the rebound is becoming stretched. My base case is mildly bullish, but headline-sensitive: gold still has a firm floor, yet short-term upside now depends on how the dollar, oil, and Fed expectations evolve over the next several sessions.
WTI Weekly Outlook: Oil Loses Panic Premium, but the Market Is Still Far From Calm
WTI enters the new week in a volatile transition phase, where easing geopolitical fear is pushing prices lower, but unresolved supply disruption and fragile demand keep the market unstable.
WTI starts the new week in a very different mood from the one that dominated late March and early April. The panic premium has been unwound sharply, but the underlying supply shock has not been fully repaired. That is why I do not see this as a clean bearish oil story yet. WTI finished last week near the mid-$80s after a very large Friday drop, triggered by Iran’s statement that the Strait of Hormuz in the Persian Gulf would remain open to commercial shipping during the truce window. That helped spark a broad risk-on move across global markets. Even so, the broader disruption remains historically large, with more than 500 million barrels of crude and condensate reportedly removed from the market during the war and outages reaching roughly 12 million barrels per day since late March.
Fundamentally, WTI is being pulled in two opposite directions. On one side, de-escalation headlines are reducing the war premium, easing shipping fears, and allowing traders to price at least partial normalization in energy flows. On the other side, the physical market is still tight because production damage, export bottlenecks, and refinery disruption across the region cannot be reversed quickly. That is why Friday’s sharp selloff looked more like a repricing of immediate risk than a full return to pre-war oil conditions.
Demand is becoming a more serious issue. The IEA’s April 2026 Oil Market Report now expects global oil demand to contract by 80 kb/d in 2026, compared with expected growth of 730 kb/d in the previous report. It also sees a 1.5 mb/d decline in Q2 2026 demand, the steepest drop since the Covid shock. The biggest weakness is expected in the Middle East and Asia Pacific, especially in naphtha, LPG, and jet fuel. That matters because it shows the market is no longer just worrying about demand destruction in theory. High prices and war disruption are now actively hitting consumption.
At the same time, supply remains much tighter than the demand story alone would suggest. The IEA says global oil supply fell by 10.1 mb/d in March to 97 mb/d, while OPEC+ production dropped 9.4 mb/d month on month to 42.4 mb/d. Reuters also noted that some heavy crude fields in Kuwait and Iraq may need months to recover, and damage to refining and LNG infrastructure could stretch out the restoration timeline even if shipping lanes stay more open. That means WTI still has a structural bullish floor, even after the headline-driven collapse.
For WTI specifically, the U.S. backdrop is helping cap upside relative to Brent. The EIA still sees U.S. crude inventories above average, and that matters because domestic supply conditions are more comfortable than the global seaborne picture. For the week ended April 10, U.S. commercial crude stocks fell by 0.9 million barrels to 463.8 million, still about 1% above the five-year average. Gasoline inventories dropped 6.3 million barrels, distillates fell 3.1 million barrels, and total commercial petroleum inventories declined by 9.0 million barrels. That combination tells me U.S. product demand has not collapsed, but crude availability remains comfortable enough to prevent WTI from behaving like a true shortage contract.
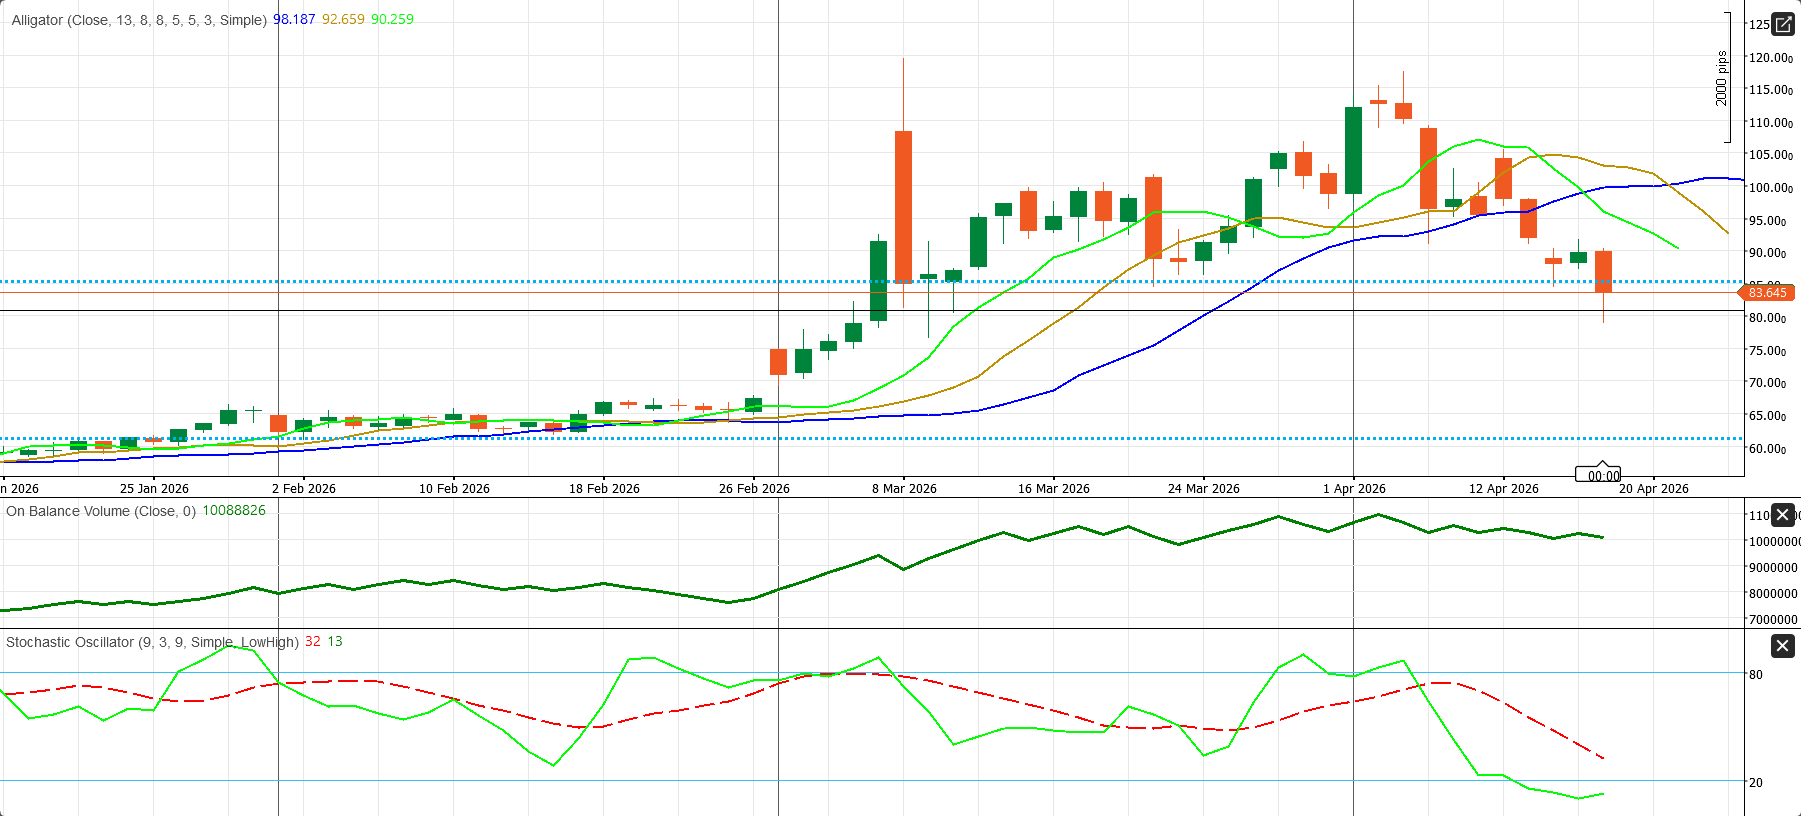
This is also why WTI is no longer a pure geopolitical contract. Brent is more directly tied to global shipping and Middle East physical tightness, while WTI is cushioned by U.S. inventories, SPR policy, and domestic logistics measures. For the week ahead, the biggest drivers remain clear: Middle East headlines, Wednesday’s EIA inventory report, global PMIs, and any new producer guidance from OPEC+ members. The technical picture also stays weak. WTI is trading near 83.645, well below the Alligator jaw at 98.187, teeth at 92.659, and lips at 90.259, which confirms that the prior uptrend has broken. The immediate pivot is 83.60. If WTI fails there, the next downside level is 80.00, followed by 75.00. Resistance sits at 90.25–92.65, and the broader structure only begins to improve above that band.
My base case is range-bound to mildly bearish, but with a very unstable floor. WTI still looks too high for a weak-demand world, but too low for a fully unresolved supply-disruption world. That usually means a choppy market with sharp reversals, not a clean trend.
Bitcoin’s Recovery Is Real, but It Still Depends on the Macro Mood
BTC enters the new week with stronger flows, better institutional support, and a more constructive chart, but the rally still needs help from softer oil, a weaker dollar, and stable risk appetite.
The crypto market enters the new week in recovery mode, but I still see Bitcoin trading more like a high-beta macro asset than a pure defensive hedge. BTC is holding around $76,605, after an intraday range of roughly $75,168 to $78,242, and that price action says a lot about the market’s current character. This is not a rally being driven only by crypto-native enthusiasm. It is a rebound supported by improving global risk appetite, easing geopolitical stress, and a softer macro backdrop. That is constructive, but it also means Bitcoin remains vulnerable if the broader market tone changes.
What has changed most in recent years is the way Bitcoin trades. It no longer moves mainly on crypto headlines. It now reacts strongly to inflation, interest-rate expectations, liquidity conditions, and institutional capital flows. That creates a more complex setup. In March, U.S. inflation moved higher again, largely because of energy and fuel prices. That pushed rate-cut expectations further out and made the macro picture less straightforward. On one side, higher inflation can support the long-term case for Bitcoin because of its limited supply. On the other hand, higher rates for longer usually pressure risky assets, including crypto. Right now, the market is balancing both forces at once.
The good news is that macro sentiment improved into the weekend. As oil fell and the market became more comfortable with de-escalation in the Iran conflict, risk appetite recovered across asset classes. That helped crypto as well. Bitcoin remains heavily tied to this environment. If markets keep leaning toward a “cuts later, not hikes again” framework, BTC can stay supported. If oil rises again and forces the Fed back into a more defensive stance, crypto could lose momentum quickly. That is why Bitcoin’s current recovery still looks tied to macro conditions rather than driven by a fully independent crypto catalyst.
Flows have improved meaningfully, and that is one of the strongest parts of the story. CoinShares reported $1.1 billion of inflows into digital-asset investment products in the week of April 13, the largest weekly total since early January, with Bitcoin alone drawing around $790 million. Even more telling, the week reportedly began with nearly $400 million of outflows before sentiment reversed sharply. That leaves year-to-date Bitcoin inflows around $2.4 billion. I read that as a sign of improving confidence, but not a fully repaired market. Flows are better, though still below the earlier 2026 peak.
The regulatory backdrop is also becoming more supportive. New guidance and legislative progress are helping reduce one of the biggest structural risks that held crypto back in earlier cycles. That does not create an instant price surge by itself, but it makes the market easier for institutions to engage with. And institutions are still showing up. Spot Bitcoin ETFs hold nearly $100 billion in assets, BlackRock remains a leader, and major financial firms continue to build products even after the correction. That matters because it suggests Bitcoin now has a more durable demand base than many other parts of the crypto market.
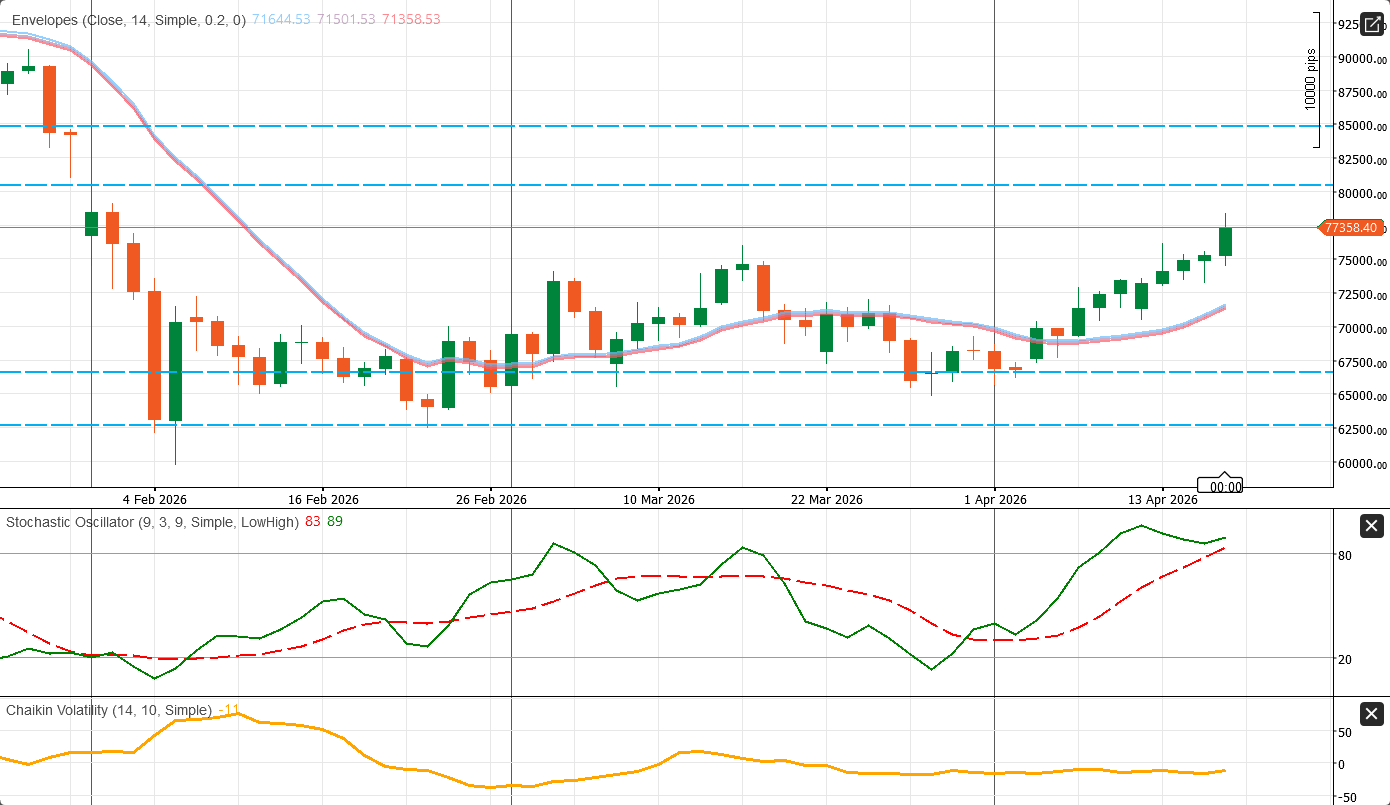
Technically, the daily chart is constructive. BTC/USD is trading around 77,358.40, well above the 71,358.53–71,644.53 envelopes cluster, showing that momentum has strengthened clearly from the late-March base. Bitcoin has already reclaimed the 67,000 and 70,000 zones and is now pressing the 77,350–80,000 resistance area. That is the key near-term barrier. A clean daily break above 80,000 would open room toward 85,000. On the downside, first support sits near 71,500, followed by broader support around 67,000. The chart is bullish, but it is also stretched, with the stochastic near 83/89, which means confirmation matters more than chasing late upside.
My base case for the week ahead is cautiously bullish, but still headline-sensitive. Bitcoin has a stronger structural foundation now, with better flows, improving regulation, and visible institutional support. But the rally is not yet fully self-sustaining. If the broader market stays in risk-on mode, BTC can keep grinding higher. If macro stress returns, this recovery is still young enough to reverse sharply.
FAQ
What is the main theme for the global economy in Week 17, 2026?
The main theme is the collision between geopolitical risk and macro data. Markets are reacting to the Iran war through oil and inflation channels, while investors are also waiting for fresh evidence on consumer demand and business activity.
Why does the Iran war matter for the global economic outlook?
It matters because the conflict has made oil prices and shipping risk more volatile, which feeds directly into inflation, business costs, and confidence across major economies.
Which economic data matters most this week?
The key releases are U.S. retail sales on April 21 and the global flash PMI surveys on April 23, which together should give a solid read on consumer demand and business activity.
Why are flash PMIs important this week?
Flash PMIs are important because they provide one of the earliest monthly snapshots of manufacturing and services momentum across major economies, including the euro area, the UK, Japan, India, Australia, and the U.S.
What is the biggest market risk this week?
The biggest risk is that geopolitical tension keeps inflation pressure elevated while the economic data starts to show softer growth, creating a more difficult backdrop for equities, bonds, and currencies.
Comments