 English
 پارسی


Global Economic Review: Growth Holds, but Inflation Takes Control
The global economy enters Week 21, 2026, with one clear message: growth is still alive, but inflation is back in control. Major economies are not showing broad recession signals, but the recovery is uneven and increasingly vulnerable to higher interest rates, elevated oil prices, and geopolitical risk around the Persian Gulf and the Strait of Hormuz.
U.S. Economy: Strong Growth, Stronger Inflation
The United States remains the strongest major economy, but it is also the biggest source of inflation pressure. U.S. CPI rose 0.6% MoM and 3.8% YoY, while core CPI increased 0.4% MoM and 2.8% YoY. Producer inflation was even hotter, with headline PPI at 6.0% YoY and core PPI up 1.0% MoM.
Other price signals confirmed the inflation risk. Import prices rose 1.9% MoM, while export prices jumped 3.3% MoM. At the same time, the Atlanta Fed GDPNow estimate for Q2 climbed to 4.0%, showing that growth momentum remains strong.
This creates a difficult policy mix for the Federal Reserve. After Kevin Warsh was confirmed as Fed Chair, markets moved further toward a higher-for-longer rate outlook. With retail sales still positive, industrial production up 0.7% MoM, and the NY Empire State Manufacturing Index rising to 19.60, the U.S. is showing a strong-growth, high-inflation profile.
Europe: Weak Growth, Sticky Prices
Europe remains the weakest major region. Eurozone GDP grew only 0.1% QoQ and 0.8% YoY, while industrial production fell 2.1% YoY. Germany, France, Italy, and Spain continued to face sticky inflation, but growth momentum stayed soft.
Germany’s wholesale prices rose 6.3% YoY, French unemployment increased to 8.1%, and eurozone employment growth slowed. The eurozone is not collapsing, but it remains trapped in a low-growth, sticky-inflation environment.
UK: Better Growth, but Not a Full Recovery
The UK delivered one of the greatest surprises. Q1 GDP rose 0.6% QoQ and 1.1% YoY, while March GDP increased 0.3% MoM against expectations for a decline. Services rose 0.8%, manufacturing production jumped 1.2% MoM, and construction output beat forecasts.
However, the recovery is not broad-based. The trade deficit widened to £27.22B, business investment missed expectations, and retail demand stayed weak.
China and Japan: Selective Recovery
China’s data were mixed. Inflation improved, with CPI up 1.2% YoY and PPI up 2.8% YoY, while consumer sentiment rose to 76.34. But credit data remained weak: new loans fell to -10.0B, total social financing dropped to 620.0B, and loan growth slowed to 5.6%. China is improving selectively, but the credit engine remains fragile.
Japan showed stronger external and industrial momentum. The current account surplus beat expectations, bank lending rose 5.4% YoY, machine-tool orders surged 45.1% YoY, and producer inflation reached 4.9% YoY. Still, domestic sentiment remained weak.
Markets: Dollar Strong, Oil Supported, Gold Pressured
Commodities remain dominated by Persian Gulf and Strait of Hormuz risk. Brent traded near $106–$107, while WTI held around $101–$102. Oil remains Neutral-to-Buy because supply risk is still active.
Gold had a difficult week. Strong U.S. data, higher Treasury yields, a stronger dollar, and fading Fed-cut expectations pushed gold near $4,620 per ounce, down about 2% for the week.
Equities became more selective. The S&P 500 and Nasdaq reached record highs, supported by AI and semiconductor momentum. But South Korea’s KOSPI fell more than 6% as Samsung and SK Hynix sold off, showing how fragile the AI trade has become.
Crypto stayed under pressure. Bitcoin held near $80,000–$81,000, but altcoins weakened. The crypto market remains Neutral-to-Sell unless Bitcoin regains stronger upside momentum.
Global Economic Outlook: Inflation Risk Returns as Growth Signals Turn Uneven
The global economy enters the week of May 18–23, 2026, in a Neutral-to-Defensive market condition. The main macro story is clear: inflation pressure is returning while growth signals are becoming more uneven across major economies. Markets are not only watching economic releases; they are also watching whether higher oil prices, tighter financial conditions, and the Persian Gulf / Strait of Hormuz risk premium begin to damage consumers, business confidence, and central-bank flexibility.
This is a confirmation week for global markets. The key events include China’s April activity data, UK CPI, Eurozone final inflation, FOMC minutes, global flash PMIs, Japan CPI, Canada CPI, Australia labor data, and UK retail sales. The most important global growth day is May 21, when flash PMIs are scheduled for Japan, India, France, Germany, the Eurozone, the UK, and the U.S.
United States: Fed Minutes Will Shape the Rate Narrative
The United States remains the central driver of global risk sentiment. After the recent inflation shock and stronger oil prices, investors will focus on the FOMC minutes on Wednesday, May 20, released at 2:00 p.m. ET. The minutes cover the April 28–29 meeting and will be important for understanding whether Fed officials are more worried about persistent inflation or the risk of growth damage.
The main U.S. data risk arrives on Thursday, May 21, with housing starts, building permits, the Philadelphia Fed Index, and flash U.S. PMI. On Friday, the final University of Michigan consumer sentiment reading for May will show whether households are becoming more cautious.
The key question is whether the U.S. is still in a “resilient growth + sticky inflation” regime, or whether housing and consumer weakness are starting to confirm a stagflation-style slowdown. My market view is that the U.S. dollar should remain supported if the Fed minutes sound hawkish and PMIs remain firm. However, Wall Street may stay selective and vulnerable if strong data also push yields higher.
China: Activity Data Will Test the Recovery Story
China begins the week with a major activity check. On May 18, markets will watch data on national economic performance, industrial production, energy production, fixed-asset investment, real estate development and sales, retail sales, and residential building prices.
The key issue is not only whether China is growing, but what kind of growth it is delivering. Strong industrial production alongside weak retail sales and property data would confirm a two-speed economy: factories and exports are holding up, while households and real estate remain fragile.
For markets, Chinese equities may remain choppy unless retail sales and property data improve. Commodity markets, especially copper, iron ore, and oil-linked assets, will react strongly to industrial production and fixed-asset investment.
Europe and the UK: Inflation Returns to the Center
Europe and the UK face another inflation test. The UK will release April CPI on Wednesday, May 20, followed by April retail sales on Friday, May 22. These data will be important for Bank of England expectations, especially if inflation proves sticky while retail demand weakens.
For the Eurozone, the final April inflation is also critical. The flash estimate showed euro-area annual inflation rising to 3.0% in April from 2.6% in March, with energy inflation estimated at 10.9%. Final HICP data on May 20 will confirm whether the energy shock is becoming broader.
The market reaction may be complex. Hot inflation could support EUR, GBP, and local yields, but it may pressure equities if investors see another energy-driven inflation squeeze.
Japan, Canada, and Australia: Inflation and Labor Data Matter
Japan has Q1 GDP early in the week, followed by April national CPI on May 22. The Bank of Japan is facing a difficult mix of imported inflation, yen sensitivity, and uneven domestic demand. A firm CPI reading could increase pressure on the BoJ to stay less dovish, although broad dollar strength may still limit yen upside.
Canada releases April CPI on Tuesday, May 19, making it a key test of whether higher energy prices are feeding into broader inflation. Australia’s main release is the April labor force data on Thursday, May 21.
For currencies, CAD and AUD should remain sensitive to commodities and rate expectations. Strong Canadian CPI or Australian labor data may support local yields, but risk-off sentiment could limit upside.
Market Outlook: Defensive, Selective, and Inflation-Sensitive
My base case is a fragile global expansion with rising inflation risk. The U.S. still looks relatively resilient, China remains uneven, Europe faces renewed energy-price pressure, Japan is approaching another inflation test, and commodity-linked economies are becoming more sensitive to oil and trade conditions.
Risk assets: Neutral-to-Defensive
U.S. dollar: Mildly bullish
Treasury yields: Volatile, with upside risk if PMIs and Fed minutes are hawkish
Gold: Supported by geopolitical risk, but pressured by real yields
Oil / WTI: Buy on dips while Persian Gulf risk remains active
Equities: Selective; quality, energy, defense, and cash-flow names should outperform high-duration growth if yields rise
Emerging markets: Vulnerable if the USD and oil rise together
U.S. Economy Weekly Review: Growth Holds, but Inflation Revives Fed Risk
The U.S. economy delivered a resilient but uncomfortable message over the past week. Growth indicators stayed firm, consumers continued to spend, manufacturing improved, and housing demand did not collapse. But the bigger story was inflation. Price pressure broadened across CPI, PPI, import prices, export prices, and energy-related channels, creating a more difficult environment for the Federal Reserve.
My overall market condition is clear: USD Buy, Treasuries Sell, Equities Neutral-to-Buy but selective, Gold Sell, and Crypto Neutral-to-Sell. The U.S. economy is not weak enough to justify near-term Fed easing, while inflation is strong enough to keep rate-hike risk alive.
Inflation Shock: CPI and PPI Rebuild the Hawkish Case
The most important development was the April inflation shock. U.S. CPI rose 0.6% month-over-month and 3.8% year-over-year, with the annual reading above the 3.7% forecast and the highest level since May 2023. Core CPI also surprised higher, rising 0.4% MoM and 2.8% YoY, both above expectations.
Energy was the main driver. The energy index increased 3.8% MoM and 17.9% YoY, while gasoline jumped 5.4% MoM and 28.4% YoY. This confirms that oil and transport costs linked to the Iran war and Strait of Hormuz disruption are feeding into consumer prices.
Producer inflation made the policy picture even more hawkish. Core PPI surged 1.0% MoM, far above the 0.3% forecast, while headline PPI jumped to 6.0% YoY, well above the 4.9% forecast and the previous 4.3% reading. Import and export prices also strengthened sharply. Import prices rose 1.9% MoM and 4.2% YoY, while export prices jumped 3.3% MoM and 8.8% YoY.
This means inflation is not only consumer-led. It is also visible in producer costs, trade prices, supply-chain pressure, and energy-sensitive channels.
Growth Remains Resilient
Despite the inflation problem, U.S. growth data stayed firm. The Atlanta Fed GDPNow estimate for Q2 rose to 4.0%, up from 3.7%, showing that real-time growth momentum remains strong.
Retail sales slowed but remained positive. Headline retail sales rose 0.5% MoM, core retail sales increased 0.7%, and the retail control group rose 0.5%, slightly above the 0.4% forecast. Annual retail sales accelerated to 4.87%, showing that consumers are still spending, even if momentum has cooled from March.
The industrial side also improved. The NY Empire State Manufacturing Index rose to 19.60, far above the 7.30 forecast. Industrial production increased 0.7% MoM, beating the 0.3% forecast, while manufacturing production rose 0.6% MoM. Capacity utilization climbed to 76.1%, above both the forecast and the previous reading.
This was one of the clearest positive growth signals of the week.
Labor, Housing, and Energy: Cooling, but Not Breaking
The labor market softened slightly, but it did not break. Initial jobless claims rose to 211K, above the 205K forecast and up from 199K. The four-week average edged up to 203.75K. However, continuing claims fell to 1,782K, better than the 1,790K forecast. Labor conditions are cooling at the margin, but not enough to change the broader resilient-economy narrative.
Housing data were mixed but not weak. Mortgage rates edged up to 6.46%, yet mortgage applications increased 1.7% week-over-week after a 4.4% decline. The purchase index improved to 177.7, while the mortgage market index rose to 290.1. Refinance demand slipped, but purchase activity shows housing demand has not collapsed despite elevated rates.
Energy data reinforced inflation risk. U.S. crude inventories fell 4.306 million barrels, while gasoline inventories dropped 4.084 million barrels. The Baker Hughes oil rig count rose to 415, and the total rig count increased to 551, showing some supply response, but not enough to neutralize near-term tightness linked to Hormuz-related risks.
Fed and Markets
The Fed backdrop became more hawkish after Kevin Warsh was confirmed as Federal Reserve Chair. Markets priced a higher probability of rate hikes later this year, while Warsh’s focus on reducing the Fed’s $6.7 trillion balance sheet added more uncertainty for liquidity and long-duration assets.
Treasury auctions also showed rising long-end pressure. The 30-year bond auction yield rose to 5.050%, up from 4.876%, while the 10-year auction yield rose to 4.468%. Higher long-term yields suggest weaker demand for duration and rising concern over inflation, debt supply, and Fed policy.
Bottom Line
The U.S. economy remains resilient, but the quality of that resilience is difficult for markets. Growth is strong, consumers are still spending, manufacturing is improving, and GDPNow is rising. But inflation is broadening again, energy costs are feeding into prices, producer inflation is hot, import prices are rising, and long-term yields are moving higher.
This is not a soft-landing-friendly mix. My base case is a strong-growth, high-inflation, higher-rate-risk environment. That supports the U.S. dollar, pressures Treasuries and gold, creates a selective setup for equities, and keeps speculative assets such as crypto vulnerable if yields continue rising.
U.S. Economic Outlook: Inflation Shock Meets the Growth Test
The U.S. economy enters the week of May 18–23, 2026, with a more fragile macro setup. Inflation pressure has clearly returned, but growth has not fully broken yet. That makes this week important because markets will look for confirmation: is the U.S. still in a resilient-growth cycle, or is the economy moving closer to a stagflation-style mix of weak confidence, higher prices, and tighter financial conditions?
The latest inflation data changed the policy narrative. Headline CPI rose 3.8% year-over-year in April, while core CPI increased 2.8%, and energy prices jumped 17.9%. Producer inflation also surprised strongly to the upside, with final-demand PPI rising 1.4% month-over-month and 6.0% year-over-year. Retail sales still increased 0.5% in April, but part of that strength likely reflects higher prices rather than clean real demand.
My base-case market view for the week is Neutral-to-Defensive for risk assets, mildly supportive for the U.S. dollar, and volatile for Treasury yields. The market will not focus on one single inflation release. Instead, investors will watch whether housing, labor data, consumer sentiment, and business surveys confirm a tougher mix of slower confidence, higher input costs, and a Federal Reserve with less room to ease policy.
Monday, May 18: Foreign Portfolio Flows
The week begins quietly with U.S. foreign portfolio flows for March. This is not normally a major market-moving release, but it matters more when Treasury yields, fiscal concerns, and dollar demand are already under scrutiny.
Strong foreign demand for U.S. assets would support the U.S. dollar and Treasuries. Weaker flows, however, could reinforce concerns about funding pressure, Treasury supply, and investor appetite for U.S. duration.
Tuesday, May 19: Housing and Wage Structure Data
Tuesday brings Pending Home Sales for April, which will be the main housing indicator. The housing sector remains highly sensitive to mortgage rates and affordability pressure. High financing costs, weak new home sales, and elevated inventory levels continue to weigh on buyer demand.
Residential construction also looks weaker beneath the surface. March housing starts improved, but that rebound likely reflected payback from February’s weather-related weakness rather than a strong new trend. Building permits have been trending lower this year, especially in single-family construction, where builders remain cautious.
Multifamily activity has held up better, helped by firmer apartment-market conditions and a slightly lower cost of capital. Overall, housing starts are expected to slow to around 1.337 million units in April. A weaker reading would increase concern that higher rates are again damaging interest-sensitive parts of the economy.
Wednesday, May 20: FOMC Minutes
The FOMC minutes from the April 28–29 meeting are the most important policy event of the week. Markets will look closely at how strongly policymakers discussed renewed inflation risks, energy-price pass-through, financial conditions, and the balance between possible rate cuts and future hikes.
The April meeting already showed growing discomfort inside the Committee. Three voters dissented against the easing bias in the post-meeting statement, even though they supported keeping rates unchanged. That matters because inflation risks have intensified since then.
I will watch whether non-voting members also believe the Fed’s next move could be either a cut or a hike. Even if the tone is more hawkish, the minutes are likely to show that most officials still prefer holding rates steady while they assess how the energy shock affects inflation, wages, and the labor market.
Thursday, May 21: The Main Macro Data Day
Thursday is the most important data day of the week. The calendar includes Housing Starts, Building Permits, Initial Jobless Claims, the Philadelphia Fed Manufacturing Index, and S&P Global Flash U.S. PMI.
Markets will focus on two questions. First, do jobless claims remain low enough to confirm labor-market resilience? Second, do PMIs stay above the 50 expansion line?
Strong labor and PMI data would support the view that U.S. growth remains resilient. However, if PMI price components stay elevated, the same data could also support higher Treasury yields and a stronger dollar. That would be a difficult setup for equities, especially high-duration growth stocks.
Weak housing data and softer PMIs would increase slowdown concerns, especially after the sharp fall in consumer sentiment. In that case, markets may begin to price a more uncomfortable macro mix: weaker activity but inflation still too high for quick Fed easing.
Friday, May 22: Michigan Sentiment and Fed Speeches
On Friday, the University of Michigan releases the final May consumer sentiment reading. The preliminary index fell to 48.2, down from 49.8 in April, while current conditions dropped to 47.8. This matters because the consumer is now the most vulnerable part of the U.S. macro story.
Higher food, fuel, and borrowing costs can quickly pressure real spending. If sentiment remains depressed, investors may question whether positive retail sales are sustainable in real terms.
Fed communication will also be important. Michael Barr speaks on consumer financial health, while Christopher Waller delivers an economic outlook speech. Waller’s comments could be especially market-sensitive if he discusses inflation persistence, growth risks, or the threshold for future policy changes.
Overall Market Expectations
The U.S. economy still looks resilient on the surface, but the quality of growth is weakening. Retail sales remain positive, but inflation is lifting nominal spending. Consumer sentiment is very weak. Housing remains rate-sensitive. Manufacturing has improved, but some strength may reflect stockpiling and supply-chain caution rather than clean demand.
For the Federal Reserve, this week is unlikely to open the door to rate cuts. Hot CPI, hot PPI, stronger import prices, and still-positive consumer spending give policymakers little reason to sound dovish.
Bottom Line
The week of May 18–23 is a confirmation week. If housing weakens, sentiment stays depressed, and PMI price pressures remain high, the U.S. outlook will move closer to stagflation risk. If claims stay low and PMIs remain above 50, markets may continue to price resilient growth, but with the Fed trapped in a more hawkish inflation environment.
USD Index and S&P 500 Technical Analysis: Dollar Recovery Strengthens as Stocks Hold Bullish Structure
The daily charts of the U.S. Dollar Index (DXY) and S&P 500 / US500 both show constructive technical structures, but they are at different stages of the move. The DXY is attempting a fresh breakout after recovering from its late-April base, while the S&P 500 remains in an established uptrend but is now approaching an important confirmation zone.
- USD Index Technical Analysis: DXY Attempts a Short-Term Breakout
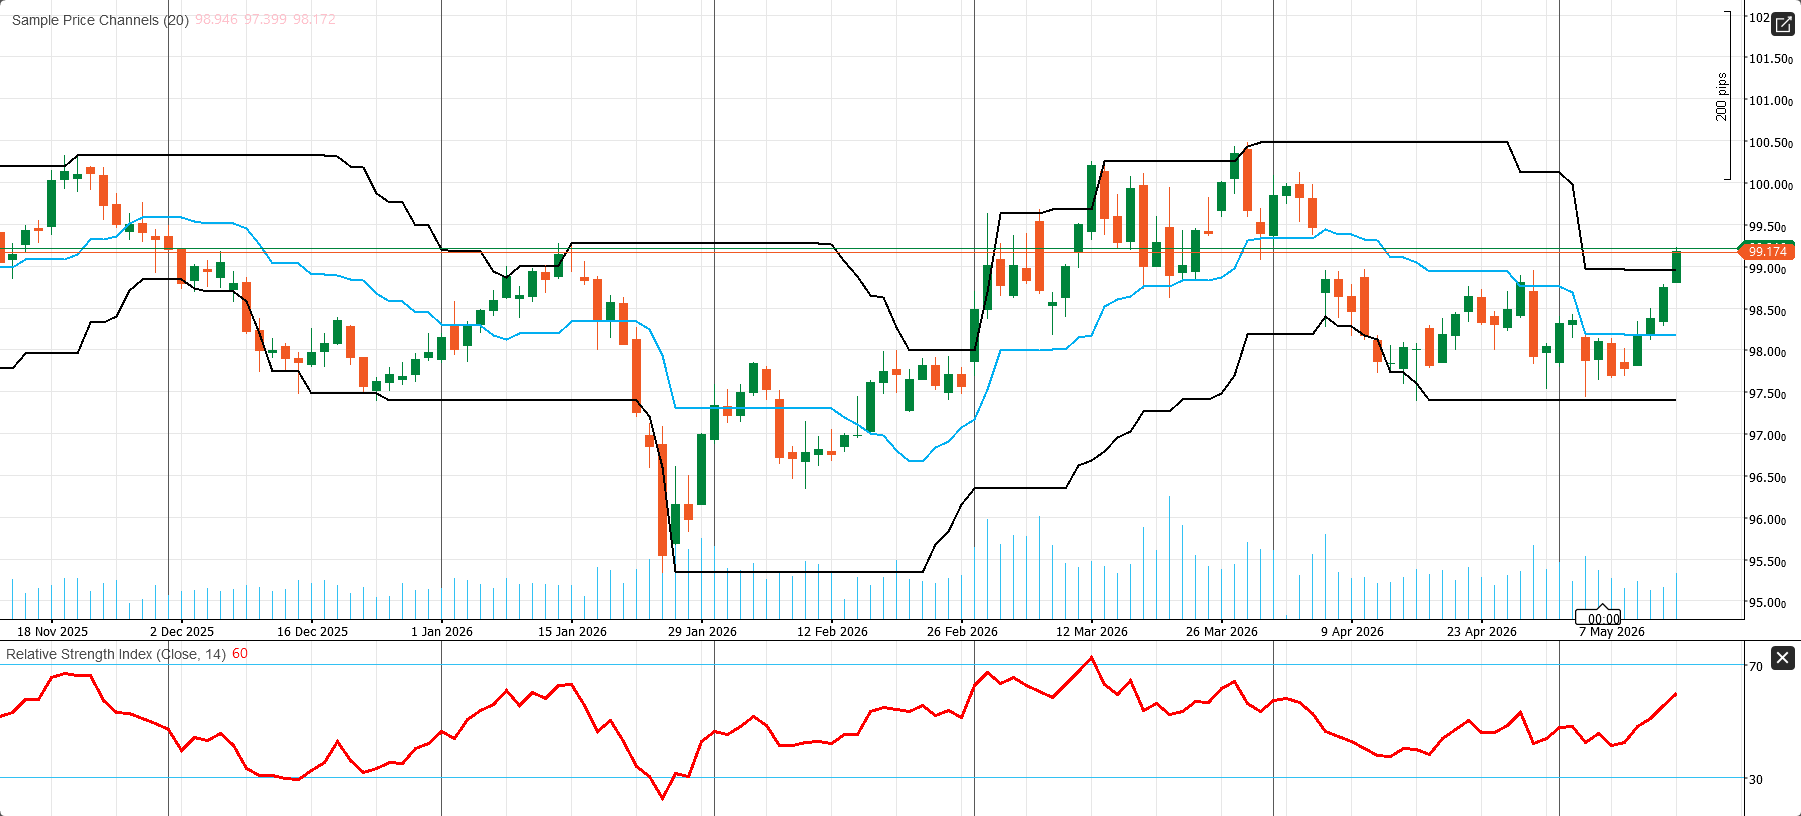
The U.S. Dollar Index (DXY) has improved technically and now shows a constructive recovery pattern. Price is trading around 99.174, above the 20-day Price Channel upper boundary near 98.946. The channel midline stands around 98.172, while the lower boundary is near 97.399.
This move above the upper channel is important because it suggests buyers are no longer only defending the range. Instead, they are trying to push the index into a short-term breakout structure. The recovery from the late-April base has clearly strengthened, and the index is now testing the next resistance zone around 99.17–99.50.
A clean move above 99.50 would make the bullish structure stronger and could open the way toward the broader resistance area near 100.50. On the downside, the first important support is now around 98.17, followed by the stronger floor near 97.40.
Momentum supports the recovery. RSI is near 60, which keeps the index above the neutral 50 line and confirms improving bullish pressure. At the same time, RSI is not yet overstretched, meaning the dollar still has room to extend if buyers maintain control.
For now, the DXY technical bias is mildly bullish, but the breakout still needs confirmation above 99.50.
- S&P 500 Technical Analysis: Bullish Trend Holds, but Breakout Confirmation Matters
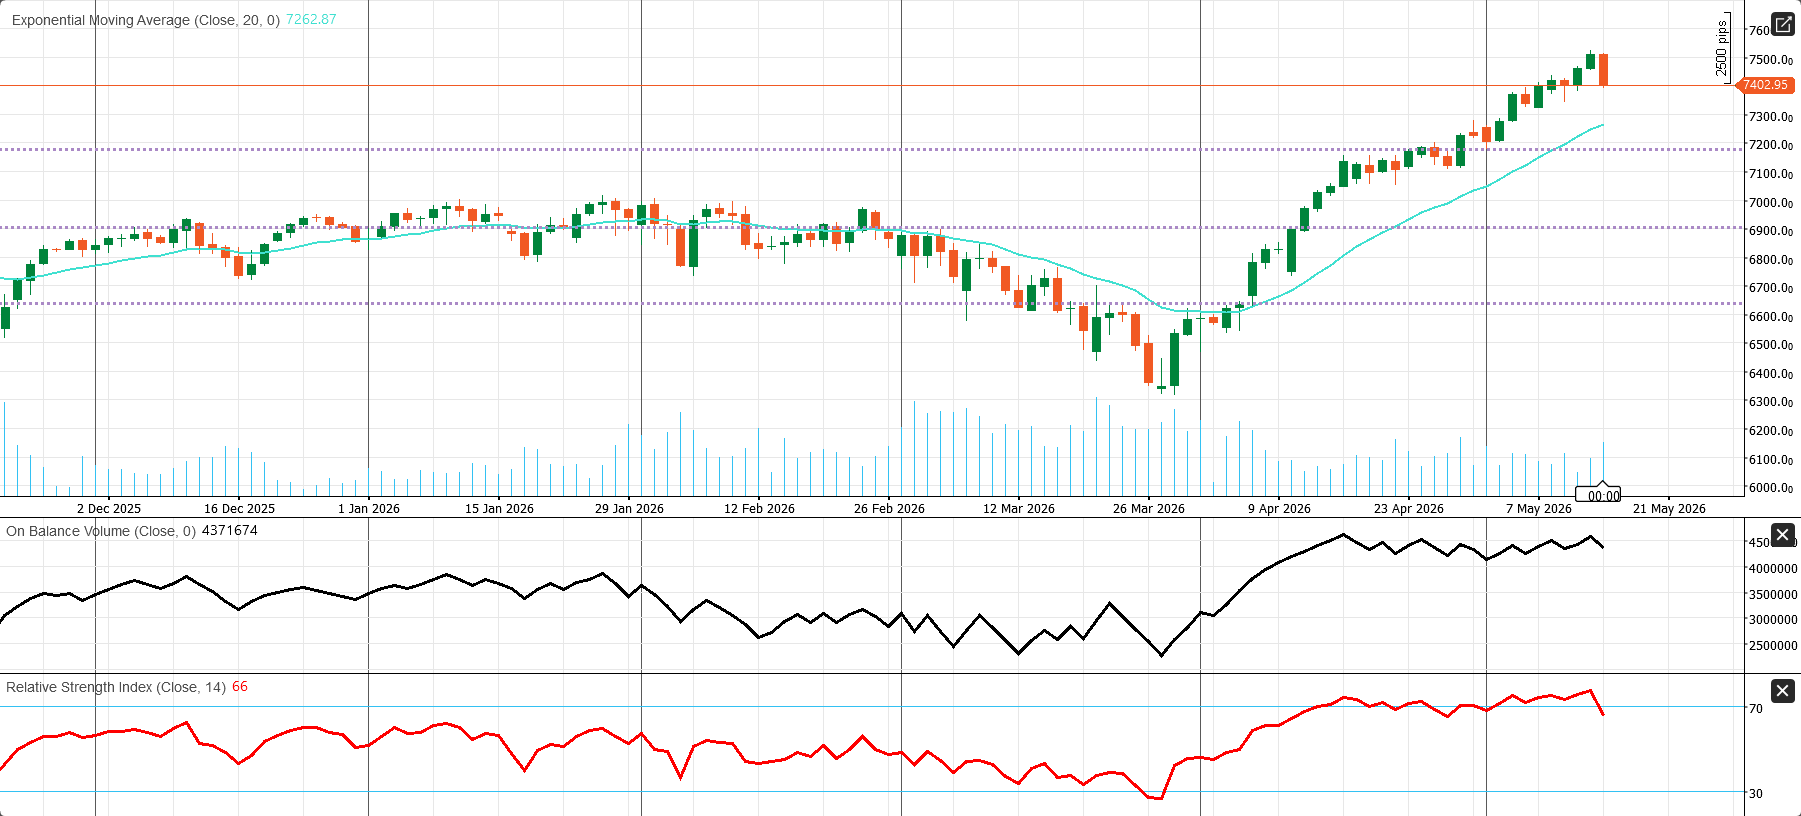
The daily S&P 500 / US500 chart remains constructive. Price is trading around 7,402.95, clearly above the 20-day EMA at 7,262.87. This confirms that the short-term trend still points higher.
The rebound from the late-March low near the 6,300–6,400 zone has already carried the index through major intermediate levels around 6,600, 6,900, and 7,200. That shows a strong recovery structure, supported by improving participation.
The key issue now is extension. Price is pressing the immediate resistance zone around 7,403, which is the current local high. A clean daily close above this area would strengthen the bullish continuation case and open the door toward 7,500, followed by the broader upside target near 7,600.
On the downside, first support sits near the 20-day EMA at 7,263. Below that, the next important levels are 7,200 and 6,900.
Momentum remains positive. RSI is at 66, below classic overbought territory but strong enough to show firm upside pressure. On-Balance Volume has also risen strongly from the March base, confirming that the rally has been supported by better participation, not only a weak technical bounce.
- Bottom Line
The DXY has a mildly bullish setup as long as it holds above 98.95, with breakout confirmation needed above 99.50. The S&P 500 remains bullish above 7,263, but after a strong rally, buyers need a daily close above 7,403 to confirm the next leg higher.
China Weekly Review: Selective Recovery Faces a Weak Credit Engine
China’s latest macro picture remains mixed. Inflation improved, consumer sentiment strengthened, and U.S.-China diplomatic headlines created support for aviation, agriculture, AI, and technology trade. However, the most important warning came from credit data. Financing demand remains weak, which shows that China’s recovery is still uneven and not yet broad-based.
The main message is clear: China is improving in selected areas, but the credit engine is still not strong enough to confirm a full economic acceleration.
Credit Data: The Weakest Part of China’s Recovery
The biggest domestic concern is the credit cycle. New Loans fell to -10.0B in April, far below the 320.0B forecast and sharply weaker than the previous 2,990.0B. This was a major negative signal because new lending is one of the clearest indicators of business confidence, household borrowing appetite, and investment momentum.
Total Social Financing also disappointed heavily, dropping to 620.0B, missing the 1,500.0B forecast and falling sharply from 5,230.0B. Outstanding loan growth slowed to 5.6%, below the 5.8% forecast.
These numbers show that companies and households are still cautious. Banks may have liquidity available, but demand for credit remains weak. This suggests that the private sector is not yet confident enough to borrow aggressively, expand investment, or increase long-term spending.
Liquidity Is Available, but Transmission Is Weak
The only positive signal inside the credit data came from liquidity. M2 Money Stock rose 8.6% year-over-year, slightly above expectations. This means money supply is still expanding, and authorities have not allowed liquidity conditions to become too tight.
However, liquidity alone is not enough. The bigger problem is policy transmission. Money supply is growing, but it is not translating into strong loans, stronger investment, or broader economic confidence. In practical terms, China does not have a liquidity shortage. It has a credit-demand problem.
That distinction matters for markets. When money supply rises, but lending remains weak, it usually reflects cautious companies, fragile households, and a private sector that is still waiting for stronger demand signals before committing capital.
Inflation Improves, but Margin Pressure Risk Rises
Inflation data were more constructive. CPI rose 0.3% month-over-month in April, beating expectations for a 0.1% decline. Annual CPI increased to 1.2%, above the 0.9% forecast and the previous 1.0%.
This reduces deflation concerns and suggests that China’s price environment is stabilizing. However, the producer side was much stronger. PPI rose 2.8% year-over-year, well above the 1.7% forecast and sharply higher than the previous 0.5%.
A stronger PPI can be positive if it reflects better demand. But if input costs rise while final demand remains weak, corporate profit margins may come under pressure. That is the key risk: China may be moving away from deflation, but not yet toward a clean demand-led inflation cycle.
Consumer Sentiment and Yuan Strength Offer Support
Consumer sentiment was one of the better signals of the week. China’s Thomson Reuters IPSOS PCSI rose to 76.34 in May, up from 74.60. This suggests households are not deeply defensive, even though spending and credit behavior remain cautious.
The yuan also remained relatively strong. USD/CNY traded around 6.79, keeping the Chinese currency near a three-year high. This resilience is important because many Asian currencies were under pressure from a stronger U.S. dollar, hot U.S. inflation, and higher Fed rate expectations.
For now, yuan strength reflects summit optimism, policy confidence, and relative macro stability. A firm yuan can help reduce imported inflation pressure and support investor confidence, but it also depends heavily on continued policy credibility and stable capital flows.
U.S.-China Summit: Positive Tone, Limited Details
The U.S.-China summit was the biggest geopolitical event. Discussions covered trade, tariffs, AI, rare earths, agriculture, aviation, and the Iran conflict. The tone was positive, but details remained limited.
Chip export controls were not deeply discussed, which reduced hopes for a major technology breakthrough. Still, reports that Nvidia received approval to sell H200 AI chips to 10 Chinese companies supported sentiment around China’s AI ecosystem, even though no sales had been completed yet.
The Boeing agreement was another positive headline. China agreed to buy 200 Boeing jets, with potential for the order to rise to 750 aircraft if conditions are met. However, the initial order was below expectations for around 500 jets, making it strategically positive but less powerful as an immediate market catalyst.
Alibaba Confirms AI and Cloud Strength
Alibaba reinforced the strength of China’s AI and cloud sectors. Revenue rose 3% to 243.4B yuan, slightly below estimates, but like-for-like revenue increased 11% after excluding divested businesses.
The strongest area was cloud. Cloud Intelligence revenue jumped 38% to 41.6B yuan, while AI-related product revenue reached 8.97B yuan, marking the 11th consecutive quarter of triple-digit annual growth. Alibaba also said it will exceed its planned 380B yuan three-year AI investment commitment.
This confirms that AI and cloud remain China’s strongest structural growth themes.
Bottom Line
China’s economy is improving, but selectively. Inflation and consumer sentiment are better, the yuan remains firm, and AI, cloud, aviation, and trade diplomacy offer positive themes. However, weak loans and social financing show that the credit engine is still not working properly.
For now, China looks like a selective recovery story, not a full-cycle acceleration.
China Economic Outlook: Growth Test, Property Weakness, and PBOC Patience
China enters the week of May 18–23, 2026, with a mixed and fragile macro picture. Headline growth has remained resilient, but domestic demand, credit appetite, and property activity are still weak. The key question for markets is whether April activity data confirm a deeper slowdown in consumption and investment, or whether industrial production and external trade remain strong enough to keep Beijing patient on broad stimulus.
My base-case view is Neutral-to-Defensive for Chinese equities, cautious for the yuan, and selectively supportive for commodities only if industrial output and fixed-asset investment hold up. China still looks like a selective recovery story, not a full-cycle acceleration.
Monday, May 18: April Activity Data Will Define the Week
The most important event comes on Monday, May 18, when China releases its April activity data. Markets will focus on industrial production, retail sales, fixed-asset investment, real estate development and sales, residential property prices, and urban unemployment.
This release will provide the first clear read on how China’s economy started the second quarter. The result matters because China’s recovery is not broad-based. Manufacturing and exports have helped stabilize growth, but households, property, and private-sector confidence remain weak.
Industrial Production: The Main Growth Stabilizer
Industrial production remains China’s main support pillar. March output grew 5.7% year-over-year, slower than 6.3% in January–February but still above expectations. A strong April reading would support the view that China’s factory sector remains resilient despite softer domestic demand.
However, a weak reading would be more concerning. It would suggest that higher energy costs, export uncertainty, and weaker global demand are starting to pressure production. For commodities, this is especially important. Strong industrial output could support copper, iron ore, energy-linked assets, and broader Asian industrial sentiment. Weak output would challenge the view that China can rely on manufacturing to offset property and consumer weakness.
Retail Sales: The Key Domestic-Demand Test
Retail sales are the most important domestic-demand signal. March retail sales rose only 1.7% year-over-year, down from 2.8% in January–February. If April retail sales remain soft, it will confirm that Chinese households are still cautious despite policy support.
This is important because China’s recovery cannot become durable without stronger consumer spending. Weak retail sales would show that sentiment, income confidence, and housing-related wealth effects are still limiting household demand. Markets may tolerate weak consumption if industrial production is strong, but they will not treat it as a clean recovery.
Fixed-Asset Investment and Property: The Structural Risk
Fixed-asset investment is another major focus. Investment rose 1.7% in the first quarter, below expectations. Infrastructure and manufacturing are still helping, but real estate remains the main drag.
Property data remains the biggest structural risk in China’s outlook. Weak home prices, falling real estate investment, or poor sales would increase expectations for more targeted support. That could include measures for developers, mortgages, local government financing, and household demand.
Urban unemployment will also matter. If labor conditions weaken, it would reinforce the cautious consumer story and increase pressure on Beijing to support household confidence more directly.
China’s Two-Speed Economy
The broader picture is a two-speed economy. China started 2026 better than expected, supported by manufacturing production, solid external trade, and front-loaded fiscal stimulus. However, domestic demand remains soft.
April PMI signals suggest conditions may have weakened at the start of the second quarter. Export-backed manufacturing resilience appears to be contrasting with weakness in services and construction. Industrial production is expected to remain near 5.9% year-over-year, while retail sales may improve only modestly to around 1.9%.
That mix would keep China stable, but not strong. It would also support targeted policy easing rather than a major broad stimulus package.
Wednesday, May 20: PBOC and the Loan Prime Rate Decision
The second key event is the Loan Prime Rate decision on Wednesday, May 20. The one-year LPR was held at 3.00% in April, while the five-year LPR, the key mortgage reference rate, stayed at 3.50%. Markets expect another hold.
The reason is simple. China needs growth support, but the PBOC has limited room for aggressive easing while the yuan remains sensitive, and external inflation pressure has increased. Cutting rates too aggressively could pressure the currency and complicate capital-flow management.
April credit data already showed that the problem is not only the price of credit. There is also weak borrowing demand. New yuan loans contracted by 10 billion yuan, the first monthly contraction since July 2025, while household loans fell by 786.9 billion yuan. This signals weak confidence among households and firms, limiting the effectiveness of easier liquidity.
Thursday, May 21: Global PMIs Matter for China
On Thursday, May 21, global flash PMIs will matter indirectly for China. The U.S., Eurozone, UK, Japan, India, and Australia PMIs will provide a real-time signal on global demand, supply-chain pressure, and export conditions.
China has no major domestic PMI release this week, but global PMIs are still important because part of China’s recent industrial resilience may reflect front-loaded orders, inventory building, and supply-chain caution rather than clean final demand.
If global PMIs weaken, markets may question whether China’s export and manufacturing support can continue.
Inflation: Less Deflation Risk, More Margin Risk
Inflation has become more complicated. China’s April PPI rose 2.8% year-over-year, the fastest pace in 45 months, while CPI rose 1.2%. This reduces deflation fears, but it is not necessarily a clean reflation story.
Much of the pressure appears linked to higher energy-related costs. If input costs rise while demand remains weak, factory margins and household purchasing power could come under pressure. That means stronger inflation is not automatically positive for China unless it is supported by stronger final demand.
USD/CNH Technical Analysis: Broader Bias Still Downside
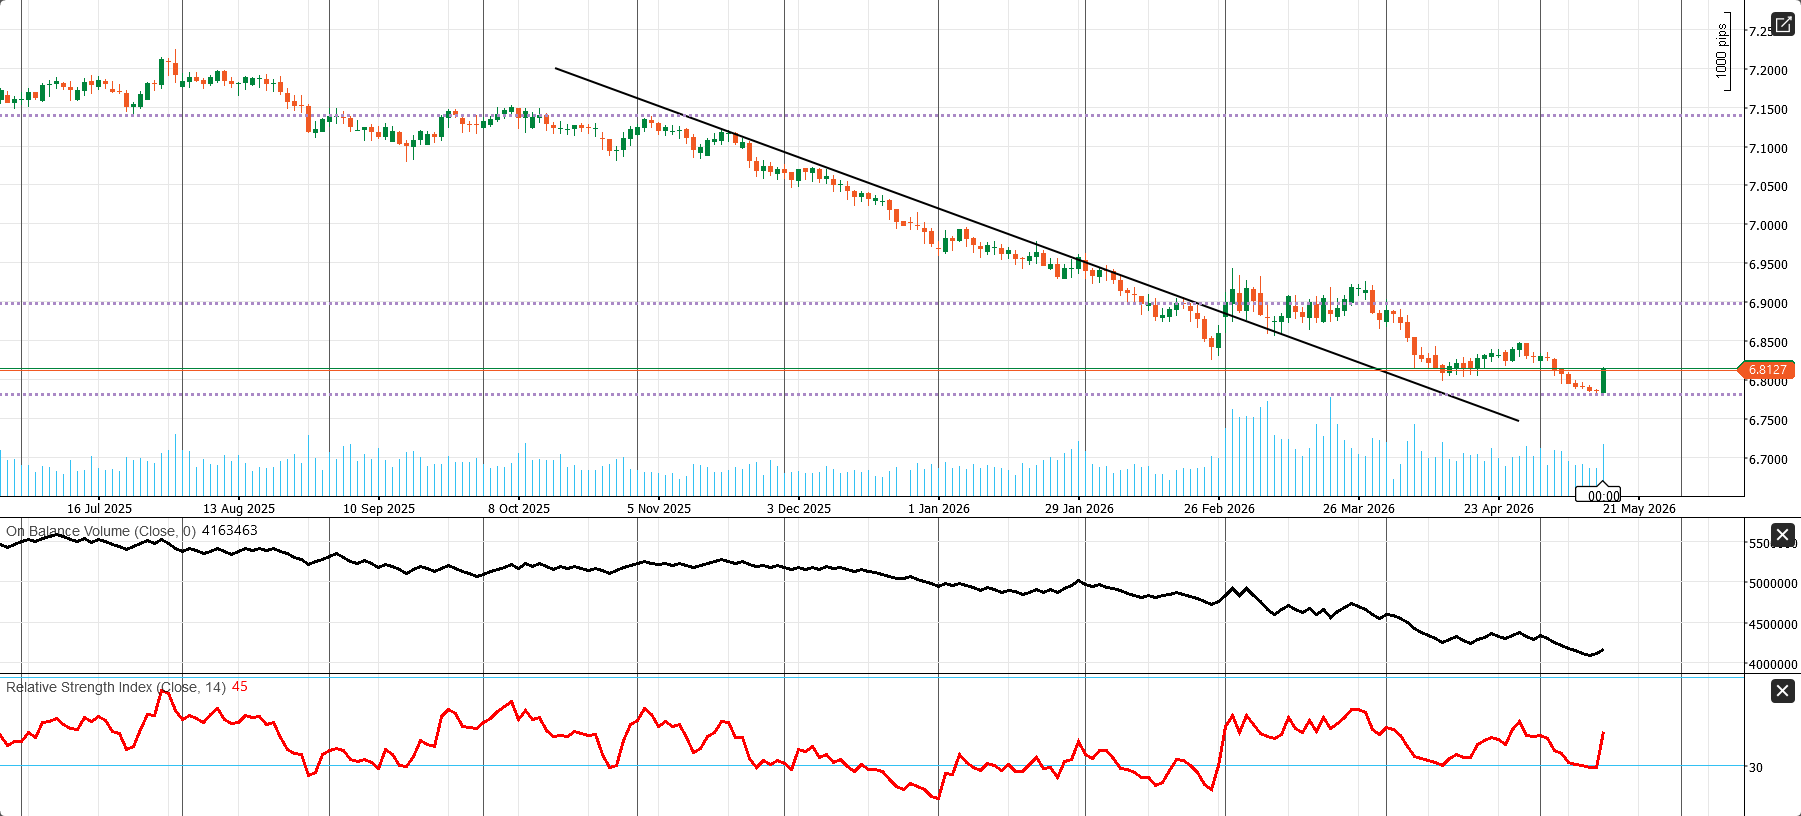
The daily USD/CNH chart still carries a broader bearish structure, even though the pair is trying to stabilize after the latest decline. Price is trading near 6.8127, just above nearby support around 6.78–6.80.
The longer-term structure from the January peak remains a sequence of lower highs and lower lows. Although the pair has moved back above the descending trendline from the late-2025 to early-2026 decline, follow-through has not been strong enough to confirm a full trend reversal.
The first important resistance is the 6.90 zone, while the higher ceiling remains near 7.15. On the downside, a decisive break below 6.80 would expose the next support area near 6.70.
Momentum remains soft. RSI near 45 is below the neutral 50 line, while On-Balance Volume is still trending lower overall. In practical terms, the chart argues for caution on long USD/CNH positions and still favors selling strength unless the pair reclaims 6.90.
Bottom Line
The week of May 18–23 is a major confirmation week for China. If industrial production holds up but retail sales, property activity, and credit demand remain weak, Beijing will likely continue with targeted support rather than broad stimulus. If the data disappoint across the board, markets will start pricing stronger policy action, especially around housing, consumption support, and liquidity.
For now, China remains a selective recovery story. The economy is stable, but not broad-based. The yuan outlook is cautious, Chinese equities remain Neutral-to-Defensive, and commodities need confirmation from industrial production and fixed-asset investment.
Gold Weekly Outlook: Strong Dollar and Hot Inflation Keep XAU/USD Under Pressure
Gold enters the week of May 18–23, 2026, in a corrective phase, with short-term sentiment still weak. After falling for four consecutive sessions, XAU/USD is trading around $4,540 per ounce, following a sharp weekly decline. The recent trading range has been roughly $4,511–$4,666, while Comex gold ended the week down 3.49% at $4,555.80, marking its largest weekly decline since March 2026.
My overall gold market condition is Neutral-to-Sell, with a clear sell-on-rallies bias unless gold quickly recovers above the $4,700 area. Gold remains a strategic hedge, but the short-term setup is not clean for aggressive buying.
Why Gold Is Under Pressure
Gold’s weakness is not because geopolitical risk has disappeared. The U.S.-Iran conflict, the fragile ceasefire, and continued concern around the Persian Gulf and the Strait of Hormuz still provide a support floor. Earlier in the week, gold found some demand after President Donald Trump rejected Iran’s response to the U.S. peace proposal and described the ceasefire as being on “massive life support.”
However, safe-haven demand was not strong enough to offset the pressure coming from U.S. macro data. The main bearish driver was the latest U.S. inflation shock.
April CPI rose 0.6% month-over-month and 3.8% year-over-year, while core CPI increased 0.4% MoM and 2.8% YoY. Producer inflation was even stronger, with headline PPI rising to 6.0% YoY and core PPI jumping 1.0% MoM. Trade-price inflation also added pressure, with import prices up 1.9% and export prices up 3.3%.
This broad inflation pressure reduced expectations for near-term Federal Reserve easing and increased the probability that U.S. monetary policy may stay tighter for longer. For gold, this is a difficult macro mix because higher rates and higher real yields increase the opportunity cost of holding a non-yielding asset.
Strong Dollar Adds a Second Headwind
The U.S. dollar became the second major headwind for gold. The U.S. Dollar Index rose to around 99.20, its strongest level in more than a month, gaining more than 1% for the week.
A stronger dollar makes gold more expensive for non-U.S. buyers. At the same time, higher Treasury yields reduce gold’s relative appeal. This explains why gold struggled even while geopolitical risk remained active.
In practical terms, gold is currently caught between two forces: geopolitical support on one side, and stronger U.S. inflation, higher yields, and a firmer dollar on the other. For now, the macro pressure from the dollar and yields is stronger.
Silver, Platinum, and Physical Demand
Weakness was not limited to gold. Silver also came under heavy pressure after trading around $86–$87 earlier in the week. Dollar strength, higher yields, and weaker precious-metal sentiment dominated the move.
Platinum was more mixed but still softer, falling from around $2,141 to near $2,028.60.
Physical demand is also mixed. India raised import duties on gold and silver from 6% to 15%, which could reduce demand from one of the world’s largest bullion-consuming markets. Higher import costs may widen local discounts and encourage investor selling. In contrast, Chinese gold premiums remained firm around $15–$20 per ounce, supported by investment and industrial demand.
Key Events to Watch This Week
The main event for gold is the FOMC minutes on Wednesday, May 20. If the minutes show stronger concern about inflation persistence, real yields and the dollar could rise further, keeping pressure on gold. If the minutes show more concern about growth damage, gold could stabilize.
Thursday’s U.S. data will also be important: housing starts, building permits, jobless claims, the Philadelphia Fed Index, and flash PMI. Strong data would likely support yields and the dollar, which would be negative for gold. Softer data could increase slowdown fears and help gold recover some ground.
On Friday, Michigan Consumer Sentiment will show whether higher food, fuel, and borrowing costs are damaging household confidence.
Gold Technical Analysis: Weak Daily Chart, Rebound Risk
Gold’s technical structure confirms the short-term pressure. The metal failed to hold above $4,700, then broke below the $4,650–$4,680 support zone and moved toward $4,540–$4,555.
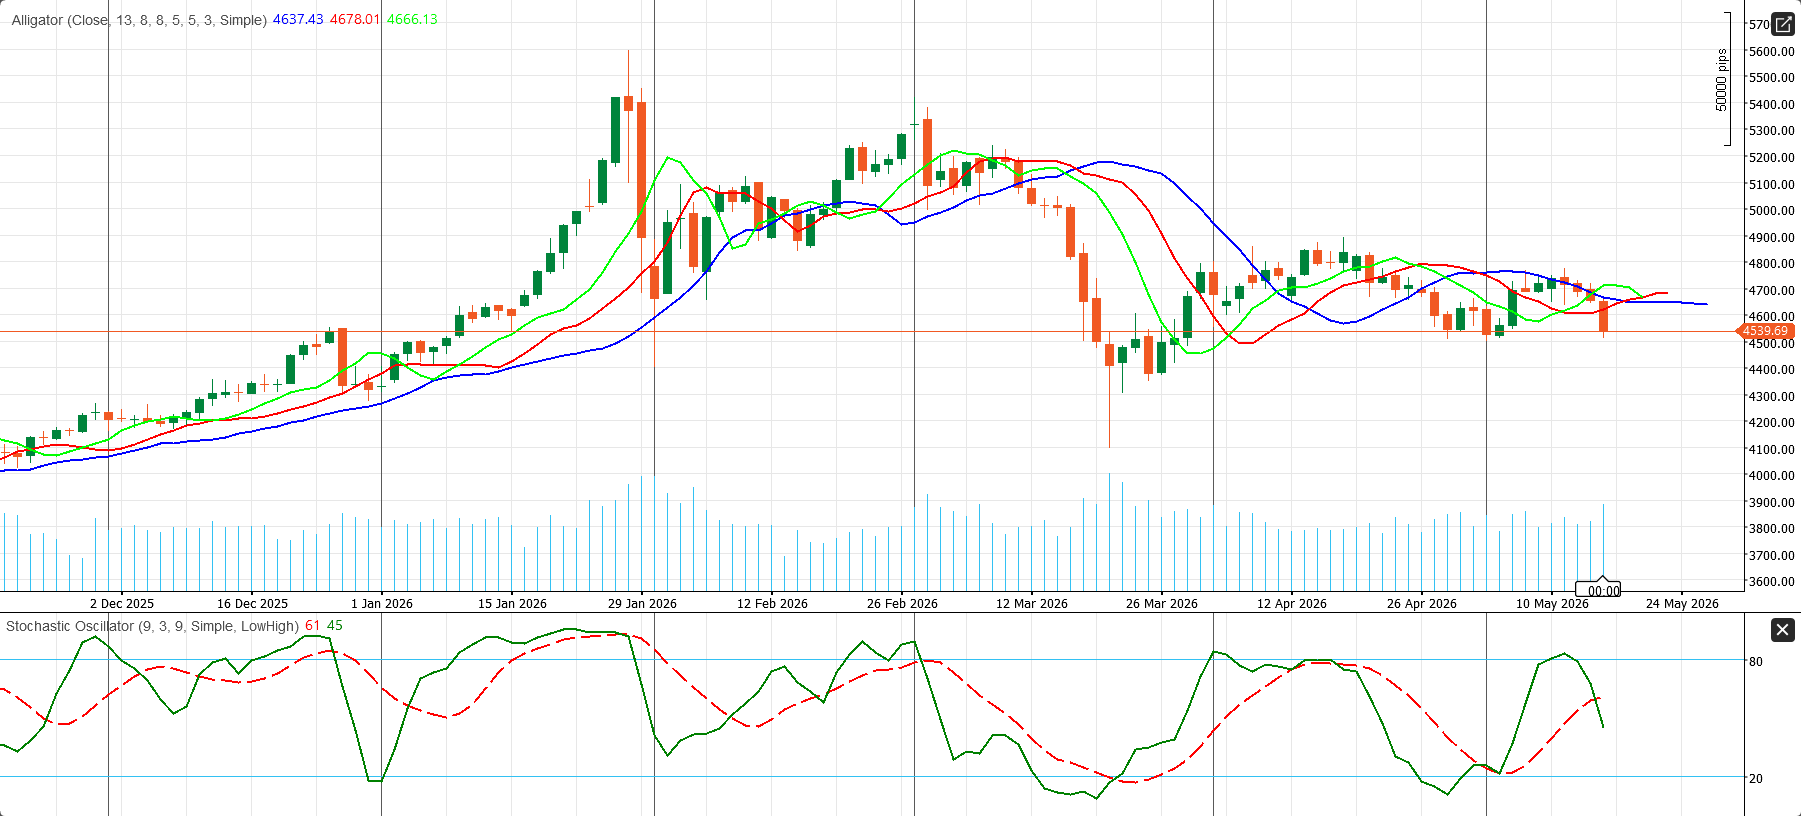
The daily XAU/USD chart has weakened again and is now trading below all three Alligator lines. Price is near 4,539.69, while the jaw is around 4,637.43, the teeth near 4,678.01, and the lips near 4,666.13. This alignment shows that the short-term structure remains soft and that the latest rebound has not been strong enough to reclaim the main dynamic resistance cluster.
The immediate pivot is $4,540. If gold closes decisively below $4,500, the next downside area comes near $4,400, followed by the broader support zone around $4,300. On the upside, the first resistance band stands at $4,637–$4,678, while the stronger recovery barrier remains closer to $4,800.
Only a sustained move back above $4,678 would materially improve the technical picture. Until then, rallies may remain vulnerable to renewed selling.
Momentum is mixed rather than bullish. The stochastic oscillator is hovering around 61/45, suggesting that momentum has improved from weaker levels but is still not strong enough to confirm a durable bullish reversal while price remains below the Alligator cluster.
Bottom Line
Gold remains a strategic hedge, but the short-term market condition is still Neutral-to-Sell. Inflation, higher yields, and dollar strength are currently stronger than safe-haven demand.
For the week of May 18–23, rallies toward $4,600–$4,700 are likely to face selling pressure unless U.S. data weaken sharply or geopolitical risk escalates around the Persian Gulf and Strait of Hormuz.
Energy Market Weekly Outlook: Hormuz Shock Keeps WTI Bullish but Volatility High
The energy market enters the week of May 18–23, 2026, in a strong but highly volatile condition. Oil prices remain elevated as the Strait of Hormuz disruption, the fragile U.S.-Iran ceasefire, and deeper-than-expected U.S. inventory draws continue to support the supply-risk premium.
WTI closed around $105.42 per barrel on May 15, rising 4.2% on the day and roughly 10% for the week, after climbing from near $95.42 on May 8. This is not a normal demand-led oil rally. It is mainly a supply-risk rally, driven by the possibility that Persian Gulf flows remain restricted, tanker traffic stays disrupted, shipping and insurance costs rise, and global inventories draw faster than expected.
My overall view for the week is clear: WTI remains Buy, but volatile. Dips are likely to attract buyers while Hormuz risk remains unresolved, but chasing sharp spikes near the highs is risky.
Hormuz Risk Remains the Main Oil Driver
The biggest fundamental support for oil comes from the Strait of Hormuz. The market is pricing the risk that restricted flows continue through late May, creating a tighter global balance even if demand indicators begin to weaken.
The most important signal came from the U.S. Energy Information Administration (EIA). The EIA expects the Strait of Hormuz to remain effectively closed through late May, forcing a much steeper drawdown in global inventories. It is estimated that global stockpiles could shrink by around 2.6 million barrels per day this year, while Brent may average about $106 per barrel in May and June.
The scale of the disruption remains severe. Before the war, around 20% of the global oil supply moved through the Strait of Hormuz. Saudi Aramco CEO Amin Nasser warned that the oil market may not fully normalize until 2027 if the disruption persists beyond mid-June. He said more than 600 ships were stuck in the Persian Gulf, around 240 ships were waiting outside Hormuz, and only 2 to 5 ships were passing through daily, compared with around 70 vessels before the war. He also estimated that the market is losing around 100 million barrels per week while Hormuz remains closed.
This keeps the supply premium alive and explains why oil can remain supported even when broader macro conditions become less friendly.
U.S. Inventory Draws Confirm Tight Near-Term Supply
U.S. inventory data reinforced the bullish picture. The API reported a 2.188 million-barrel crude draw for the week ended May 8, larger than expected. The official EIA report was even more supportive, showing crude inventories down 4.306 million barrels, while Cushing stocks fell 1.702 million barrels.
Gasoline inventories also dropped 4.084 million barrels, which is especially important ahead of the U.S. summer driving season. Distillates were the only softer point, rising 0.190 million barrels.
The U.S. supply response is starting, but it is not strong enough to change the near-term balance. Baker Hughes reported that the oil rig count rose to 415, up from 410, while the total rig count increased to 551. This shows producers are reacting to higher prices, but new rigs cannot quickly offset a major geopolitical supply shock.
Oil Is Now Feeding Back Into Inflation
The inflation effect is no longer theoretical. Higher energy prices fed directly into U.S. inflation data, with the energy index rising 3.8% month-over-month in April and contributing more than 40% of the monthly headline CPI increase.
On an annual basis, the energy index surged 17.9%, while gasoline prices rose 5.4% monthly and 28.4% yearly. This has changed the broader policy narrative by reducing expectations for near-term Federal Reserve easing and increasing pressure on Treasury yields, the U.S. dollar, gold, and risk assets.
For oil, this creates a complex setup. Supply risk supports prices, but if higher energy costs begin damaging demand, consumer confidence, and business activity, the market could become more volatile.
Key Events to Watch This Week
The key oil-specific event is the EIA Weekly Petroleum Status Report on Wednesday, May 20. Markets will focus on crude stocks, Cushing inventories, gasoline stocks, refinery utilization, exports, and implied demand. Another large crude or gasoline draw would support WTI above $100 and could extend the rally toward the $106–$110 zone.
The FOMC minutes, also on Wednesday, matter indirectly. A hawkish tone could lift the dollar and pressure commodities. However, if oil remains primarily supply-driven, geopolitical risk may dominate macro pressure.
On Thursday, U.S. jobless claims, housing data, the Philadelphia Fed Index, and flash PMI will show whether high energy prices are starting to hurt growth. On Friday, Michigan Consumer Sentiment and the Baker Hughes rig count will help markets assess demand pressure and the U.S. producer response.
WTI Technical Analysis: Bullish Recovery Bias Holds
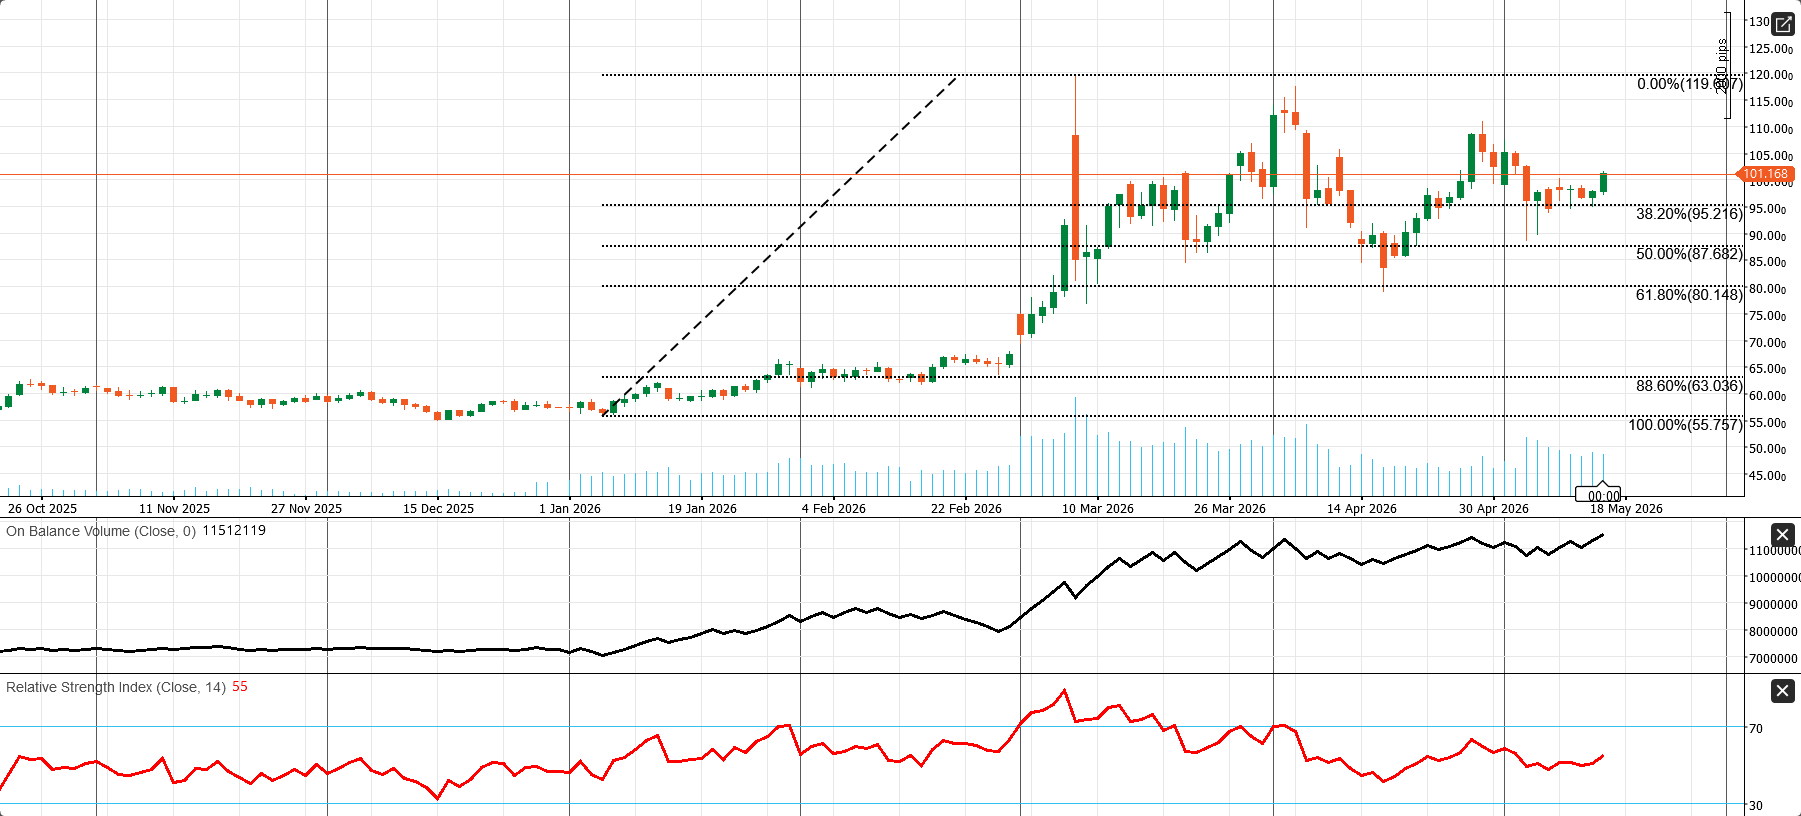
The daily WTI chart still carries a constructive structure. Price is trading around 101.168, well above the key Fibonacci retracement levels at 95.216, 87.682, and 80.148. This shows that the market has preserved most of the powerful upside leg from the 55.757 base toward the 119.607 peak, rather than giving it back in a full trend reversal.
The most important near-term pivot is 101.17. Price is sitting around that level after stabilizing above the 38.2% retracement at 95.216. As long as WTI holds above 95.216, the chart keeps a bullish recovery bias and leaves room for another move toward 105.00 first.
If momentum strengthens, the next broader upside area comes near 110.00, while the larger chart ceiling remains the previous high around 119.607. On the downside, a decisive daily break below 95.216 would weaken the structure and expose 87.682.
Momentum is constructive but not overheated. On-Balance Volume is still rising, confirming improving participation. RSI near 55 is above neutral but far from extreme. This is not a cheap market, but it is also not exhausted.
Bottom Line
WTI remains in a Buy but volatile condition. Supply disruption, inventory draws, and Persian Gulf risk still dominate the market. The key support zone is $100, while the main upside area is $106–$110. As long as Hormuz risk remains unresolved, dips should attract buyers, but chasing price spikes remains risky.
Crypto Market Weekly Outlook: Bitcoin Holds Support, but Macro Pressure Keeps Crypto Fragile
The crypto market enters the week of May 18–23, 2026, in a defensive but not broken condition. Bitcoin remains the main stabilizer, but short-term momentum has weakened as hot U.S. inflation, a stronger dollar, higher Treasury yields, and renewed geopolitical risk continue to pressure risk assets.
My overall market condition is Neutral. The BTC outlook is Neutral-to-Buy only if key support holds, while the altcoin outlook remains selective and high-risk. The main trigger for stronger upside is clear: Bitcoin must reclaim $82,500 to rebuild bullish momentum.
Bitcoin Holds the Line, but Buyers Need Confirmation
Bitcoin recently traded around $78,970–$81,100 after failing to hold cleanly above the $80,000–$82,500 resistance zone. The fact that BTC stayed near the important $80,000 area helped prevent a deeper bearish breakdown. However, the failure to sustain the weekend move toward $82,000–$82,400 shows that buyers are not yet strong enough to push the market into a broad risk-on phase.
This is an important distinction. Bitcoin is not breaking down, but it is also not yet confirming a clean bullish breakout. For now, the market is holding support, not accelerating.
U.S. Inflation Is the Main Macro Headwind
The biggest pressure on crypto came from U.S. macro data. April CPI rose 0.6% month-over-month and 3.8% year-over-year, while core CPI increased 0.4% monthly and 2.8% yearly. Producer inflation was even stronger, with headline PPI rising to 6.0% year-over-year and core PPI jumping 1.0% month-over-month.
Import and export prices also accelerated sharply, confirming that inflation pressure is broader than only consumer prices. For crypto, this is negative because stronger inflation reduces the probability of near-term Federal Reserve easing and increases the risk of tighter policy later this year.
Crypto remains highly sensitive to liquidity expectations. When markets price higher rates, stronger yields, and less central-bank support, speculative assets usually struggle.
Stronger U.S. Dollar Pressures Bitcoin and Altcoins
The U.S. dollar also became a major headwind. The U.S. Dollar Index rose to around 99.20, its strongest level in more than a month, gaining more than 1% for the week.
A stronger dollar usually weakens Bitcoin and altcoins because it reduces global liquidity appetite and pressures high-beta assets. This is why crypto has struggled, even though medium-term institutional interest remains alive.
Fed risk is another key issue. Kevin Warsh’s confirmation as Federal Reserve Chair and his pledge to shrink the Fed’s $6.7 trillion balance sheet added another layer of pressure for liquidity-sensitive markets. If balance-sheet reduction becomes a stronger policy theme, crypto could face tighter liquidity conditions even if spot demand remains positive.
Ethereum and Altcoins Show Weak Risk Appetite
Ethereum underperformed Bitcoin, trading around $2,224–$2,300. This weaker relative strength shows that the market is not yet rotating aggressively into higher-beta crypto assets.
Altcoins were also mostly lower. XRP, Solana, Cardano, Dogecoin, and TRUMP came under pressure, while BNB showed relative resilience. Overall, altcoin weakness confirms that risk appetite remains fragile.
This matters because a healthy crypto bull phase usually includes broader participation beyond Bitcoin. Right now, Bitcoin is stabilizing the market, but altcoins are not confirming strong risk-on conditions.
Regulation and Institutional Demand Remain Positive
The main positive theme is regulation. The U.S. Senate Banking Committee is moving forward with the CLARITY Act, which aims to create a broader digital-asset regulatory framework. A compromise around stablecoin rewards helped the bill regain momentum.
The proposed framework would ban bank deposit-style passive yields but allow rewards tied to active stablecoin use, transactions, and staking-related activity. This supports long-term institutional confidence, even though banks continue to push back.
Institutional Bitcoin demand also remains supportive, but flows are choppy. CoinShares reported $857.9 million of inflows into digital asset investment products, marking the sixth consecutive positive week, with Bitcoin leading at $706.1 million.
However, U.S. spot Bitcoin ETF flows were volatile. The market saw a $630.4 million outflow on May 13, a $131.3 million inflow on May 14, and a $290.4 million outflow on May 15. This shows institutional demand is still present, but conviction is no longer one-way.
Geopolitical Risk Keeps Crypto Defensive
Geopolitics remains another pressure point. The fragile U.S.-Iran ceasefire, the Strait of Hormuz disruption, and elevated oil prices are feeding inflation concerns and weighing on broader risk sentiment.
In this environment, crypto is trading more like a high-beta liquidity asset than a pure safe haven. That means Bitcoin may benefit from long-term institutional accumulation, but in the short term, it remains vulnerable to stronger yields, a firmer dollar, and weaker risk appetite.
Key Event: FOMC Minutes on May 20
The biggest macro event this week is the FOMC minutes on Wednesday, May 20. If the Fed sounds more worried about inflation persistence, the dollar and yields could rise further, pressuring Bitcoin. If the minutes show more concern about growth damage, risk assets could stabilize.
For crypto traders, the message is simple: Fed tone matters because liquidity expectations remain the main macro driver.
BTC/USD Technical Analysis
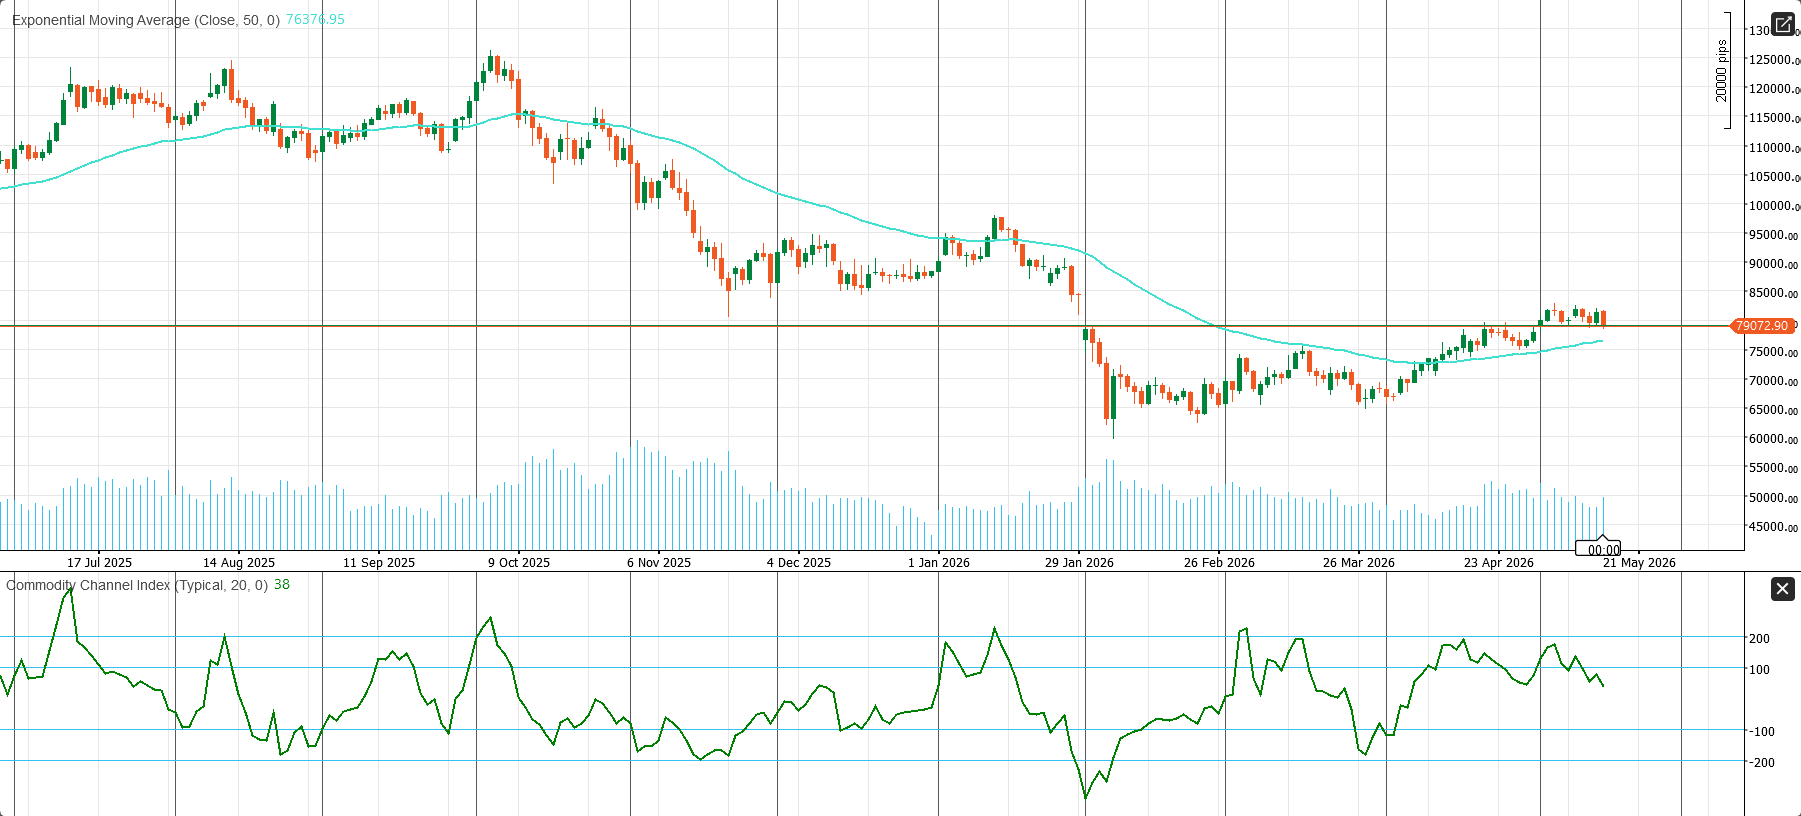
The daily BTC/USD chart has improved meaningfully after the late-March recovery and now shows a constructive structure. Price is trading around 79,072.90, above the 50-day EMA at 76,376.95. This suggests the broader daily trend has stabilized and shifted back toward the upside.
The key near-term pivot is 79,000. If Bitcoin can stay above this level, the next upside zone is 80,000–82,000. A stronger daily close above that area would open room toward 85,000.
On the downside, the first important support is the 50-day EMA near 76,377, followed by the broader support area around 72,000. A deeper break below that region would weaken the recovery structure materially.
Momentum is positive but not overheated. The CCI near 38 shows bullish pressure, but not a stretched market. On-Balance Volume also remains well above the March low, confirming that participation has improved.
Bottom Line
Bitcoin is holding the line, but crypto is not yet in a clean bull phase. Regulatory progress and institutional demand support the medium-term outlook, but hot U.S. inflation, stronger yields, a firmer dollar, and geopolitical risk keep the short-term setup fragile.
For now, the better strategy is buying controlled dips while BTC holds $75,000–$78,000, not chasing price action below $82,500.
FAQ
Is the global economy heading into recession?
No clear global recession signal is visible, but growth is uneven and vulnerable to inflation and geopolitical shocks.
What is the main risk for markets in Week 21, 2026?
The main risk is the combination of sticky inflation, higher rates, and oil supply pressure linked to the Persian Gulf and Strait of Hormuz.
Is Bitcoin still bullish?
Not yet. Bitcoin near $80,000–$81,000 is stable, but the broader crypto market remains Neutral-to-Sell without stronger upside momentum.
What is the main market theme for May 18–23, 2026?
The main theme is rising inflation risk combined with uneven growth across major economies.
Why are the FOMC minutes important this week?
The May 20 FOMC minutes will show whether Fed officials are more concerned about persistent inflation or slowing growth.
Why are global PMIs important on May 21?
The May 21 flash PMIs will show whether businesses are still expanding or whether higher energy costs and weaker demand are starting to hurt activity.
What is the market condition for the week?
The overall global market condition is Neutral-to-Defensive, with support for the U.S. dollar, selective equities, and buy-on-dips oil strategies.
Is the U.S. economy weakening?
Not significantly. Growth remains resilient, with GDPNow at 4.0%, positive retail sales, and stronger industrial production.
Why is the Federal Reserve outlook more hawkish?
Inflation is broadening across CPI, PPI, energy, import prices, and export prices, making near-term easing difficult.
What is the main market impact of this U.S. data?
The data support a stronger U.S. dollar, higher Treasury yields, selective equities, weaker gold, and a cautious crypto outlook.
Is gold still attractive in this environment?
Gold has geopolitical support, but higher real yields and a stronger dollar keep the near-term condition negative.
What is the main theme for the U.S. economy this week?
The main theme is whether resilient growth can survive renewed inflation pressure and tighter financial conditions.
Why are the FOMC minutes important?
The April 28–29 FOMC minutes may show how seriously Fed officials are discussing renewed inflation risks and whether rate cuts are becoming less likely.
What is the key market risk this week?
The key risk is a stagflation-style signal: weaker housing and consumer sentiment, but still-high inflation and elevated PMI price pressures.
What is the expected market condition?
The base case is Neutral-to-Defensive for risk assets, mildly bullish for the U.S. dollar, and volatile for Treasury yields.
Is the USD Index bullish now?
Yes, the DXY has a mildly bullish bias while trading above 98.95, but stronger confirmation requires a breakout above 99.50.
What is the next resistance for the S&P 500?
The first key resistance is near 7,403, followed by 7,500 and 7,600.
Is the S&P 500 overbought?
Not yet. RSI at 66 shows strong momentum, but it remains below classic overbought territory.
Is China’s economy recovering?
Yes, but selectively. Inflation, consumer sentiment, AI, cloud, and trade diplomacy are improving, while credit demand remains weak.
What was the weakest China data point?
The weakest signal was credit. New Loans fell to -10.0B, and Total Social Financing dropped to 620.0B.
Why is Alibaba important for China’s outlook?
Alibaba shows that China’s AI and cloud sectors remain strong, with Cloud Intelligence revenue up 38% and AI-related revenue reaching 8.97B yuan.
What is the main risk for China?
The main risk is weak credit transmission. Liquidity is available, but companies and households are not borrowing strongly enough to confirm a broad recovery.
What is the most important China data this week?
The most important release is China’s April activity data on May 18, especially industrial production, retail sales, fixed-asset investment, property data, and unemployment.
Will the PBOC cut the Loan Prime Rate?
Markets expect the PBOC to keep the one-year LPR at 3.00% and the five-year LPR at 3.50%, because currency pressure and weak credit demand limit the case for aggressive easing.
Why is China’s property market still important?
Property remains the biggest structural drag. Weak home prices, poor sales, and falling real estate investment would increase pressure for targeted support.
What is the key USD/CNH level to watch?
The key support is 6.78–6.80. A break below 6.80 could expose 6.70, while a move above 6.90 is needed to improve the bullish USD/CNH case.
Is gold bullish or bearish this week?
Gold is Neutral-to-Sell this week. The broader hedge value remains, but short-term pressure from the U.S. dollar, yields, and inflation is still strong.
What is the key support level for XAU/USD?
The first key support is around $4,510–$4,500. A break below this zone could open the way toward $4,400 and then $4,300.
What level would improve the gold outlook?
Gold needs a sustained recovery above $4,678, and especially above $4,700, to reduce bearish pressure.
What is the biggest event for gold this week?
The FOMC minutes on May 20 are the biggest event because they could affect the dollar, real yields, and Fed policy expectations.
Is WTI bullish this week?
Yes. WTI remains Buy but volatile while the Strait of Hormuz disruption and inventory draws support the market.
What is the key support level for WTI?
The key support zone is around $100, with deeper technical support near 95.216.
What is the main upside target for oil?
The first upside area is $106–$110, while the broader technical ceiling remains near 119.607.
What is the biggest event for oil this week?
The EIA Weekly Petroleum Status Report on May 20 is the key oil-specific event.
Is Bitcoin bullish this week?
Bitcoin is Neutral-to-Buy only if it holds the $75,000–$78,000 support zone and reclaims $82,500.
What is the key Bitcoin resistance level?
The key resistance area is $82,000–$82,500. A clean breakout could open room toward $85,000–$88,000.
Why is crypto under pressure?
Crypto is under pressure from hot U.S. inflation, higher yields, a stronger U.S. dollar, Fed liquidity risk, and geopolitical uncertainty.
Are altcoins attractive now?
Altcoins remain selective and high-risk because broader risk appetite is still fragile and Ethereum is underperforming Bitcoin.
Comments