IFC Markets Live Quotes

Market news roundup: Monday, 13 July 2026

43 short market news items, grouped by 14 sections.

Political

United States, July 12, 2026: CENTCOM Strikes Dozens of Iranian Military Targets in New Attack Wave

U.S. Central Command announced that American forces completed a new wave of strikes against Iran on Sunday, July 12, hitting dozens of military targets at several locations with precision-guided munitions.

According to CENTCOM, the operation targeted Iranian military air-defence systems, coastal radar sites, missile and drone capabilities, and small boats. U.S. fighter aircraft, naval vessels and one-way attack aerial and maritime drones participated in the operation, with CENTCOM saying maritime attack drones were used for the first time.

CENTCOM said the attacks were intended to reduce Iran’s ability to target international shipping passing through the Strait of Hormuz. The command maintained that Iran does not control the strategic waterway and said U.S. forces remained prepared to protect freedom of navigation for commercial vessels.

The strikes formed part of an escalating cycle of attacks between the United States and Iran over control and security in the Strait of Hormuz. Reuters reported that the U.S. operations targeted air defences, coastal radars, missile and drone systems and small boats, while Iran subsequently launched attacks against U.S.-linked military facilities across the region.

Importance: ★★★ High

Possible Market Effect

The new attacks increase the geopolitical and supply-risk premium in energy markets, particularly because the Strait of Hormuz is a critical route for global oil and liquefied natural-gas shipments. Brent crude rose 4.3% to $79.31 per barrel on Monday as concerns over shipping security and a broader regional conflict intensified.

Continued escalation could support crude-oil prices and defensive assets while pressuring global equities, airline stocks, transportation companies and energy-importing economies.

Overall Market Condition and Sentiment

  • Crude Oil: Bullish — Buy-on-dips bias, but with extremely high volatility
  • Gold: Neutral to Bullish — Geopolitical support remains, although higher inflation expectations and bond yields could limit gains
  • U.S. Dollar: Neutral to Bullish — Supported by risk aversion, but exposed to inflation and fiscal concerns
  • Global Equities: Bearish — Risk-off or defensive sentiment
  • Shipping and Airline Stocks: Bearish — Higher fuel, insurance and transportation costs may create further pressure

Q&A

What targets did the United States strike in Iran on July 12, 2026?

CENTCOM said U.S. forces targeted Iranian air-defence systems, coastal radar sites, missile and drone capabilities and small military boats.

Why did CENTCOM launch the new attacks against Iran?

CENTCOM said the operation was intended to reduce Iran’s ability to attack international commercial vessels passing through the Strait of Hormuz.

Did the United States use new weapons during the July 12 strikes on Iran?

CENTCOM said U.S. forces used one-way attack aerial and maritime drones, and that maritime attack drones were employed for the first time.

Are the latest U.S. attacks on Iran bullish for crude oil?

Yes. The attacks are broadly bullish for oil because they increase the risk of disruption to shipping and energy exports through the Strait of Hormuz. However, volatility and reversal risks remain exceptionally high.

Sources: U.S. Central Command; Reuters; Associated Press
Jordan, July 13, 2026: IRGC Claims Strike on U.S. Fuel and Missile Depots at Prince Hassan Air Base

Iran’s Islamic Revolutionary Guard Corps said it launched missiles and drones at Prince Hassan Air Base in Jordan on Monday, July 13, claiming that U.S. fuel tanks and major missile or ammunition depots were destroyed.

The IRGC described the strike as the first phase of retaliation after U.S. forces attacked Iranian coastal military positions following a confrontation involving two vessels near the Strait of Hormuz. Reuters confirmed that the IRGC announced attacks on U.S.-linked facilities in Jordan, Bahrain and other regional countries, but the extent of the reported damage has not been independently verified.

Jordan’s military presented a different account, saying it intercepted four Iranian missiles and that the incident caused no casualties or material damage. U.S. officials had not publicly confirmed damage at Prince Hassan Air Base at the time of reporting.

Importance: ★★★ High

Possible Market Effect:

The expansion of direct attacks to Jordan increases the geopolitical risk premium across Middle Eastern markets. Brent crude rose 4.3% to $79.31 per barrel on Monday as renewed fighting and uncertainty over navigation through the Strait of Hormuz intensified supply concerns. Continued escalation could support oil and safe-haven assets while pressuring regional equities and broader risk sentiment.

Overall Market Condition and Sentiment:

  • Crude Oil: Bullish — Buy-on-dips bias, with exceptionally high volatility
  • Gold: Bullish — Supported by safe-haven demand
  • U.S. Dollar: Neutral to Bullish — Safe-haven support may be offset by higher energy and inflation risks
  • Regional Equities: Bearish — Defensive or Sell bias

Q&A

Did Jordan confirm that Prince Hassan Air Base was damaged?

No. Jordan’s military said four Iranian missiles were intercepted and reported no casualties or material damage.

Has the IRGC claim of destroying U.S. fuel tanks and missile depots in Jordan been independently verified?

No. The claimed destruction had not been independently confirmed at the time of reporting.

Why is the reported attack in Jordan important for global markets?

It indicates a broader geographical expansion of the conflict and increases the risk of disruption to Gulf energy supplies, military infrastructure and regional transportation routes.

Sources: IRGC Public Relations statement; Reuters; Associated Press

Kuwait, July 13, 2026: Iranian Army Claims Drone Strikes on U.S. Military Positions

Iran’s regular army said it launched one-way attack drones against U.S. military facilities in Kuwait on Monday, July 13, in retaliation for renewed American strikes on Iran.

According to the Iranian military statement, the operation targeted locations housing U.S. forces, air-defence and missile systems, personnel shelters and logistical support hangars. Iran condemned what it described as repeated U.S. attacks on military sites, civilian infrastructure and civilians.

Kuwait’s General Staff confirmed that its air-defence forces were engaging “hostile aerial targets” inside Kuwaiti airspace. It said explosions heard in the country resulted from interception operations and urged residents to follow official safety instructions. Kuwait did not immediately identify the origin of the aerial targets or confirm that U.S. facilities had been hit.

Therefore, the Iranian claim that specific U.S. military positions and systems were successfully struck had not been independently verified at the time of reporting.

Importance: ★★★ High

Possible Market Effect

The attack claims increase the risk of a broader conflict involving Gulf countries that host U.S. forces. The escalation could raise shipping, insurance, and energy-transportation costs and strengthen the geopolitical premium in oil prices. Brent crude had risen 4.3% to $79.31 per barrel as concerns surrounding the Strait of Hormuz and regional military escalation intensified.

Overall Market Condition and Sentiment

  • Crude Oil: Bullish — Buy-on-dips sentiment, with exceptionally high volatility
  • Gold: Bullish — Supported by safe-haven demand
  • U.S. Dollar: Neutral to Bullish — Risk aversion supports the dollar, while energy-driven inflation creates conflicting pressure
  • Kuwaiti and Gulf Equities: Bearish — Defensive or Sell sentiment
  • Airline and Transportation Stocks: Bearish — Exposed to higher fuel, insurance and operating costs

Q&A

Did Kuwait confirm that Iranian drones struck U.S. military facilities on July 13, 2026?

No. Kuwait confirmed that its air defences were engaging hostile aerial targets, but it did not immediately confirm that U.S. facilities had been struck.

What targets did the Iranian Army claim it attacked in Kuwait?

Iran claimed it targeted U.S. troop positions, air-defence and missile systems, shelters and logistical support hangars.

Were the explosions heard in Kuwait caused by successful drone strikes?

According to Kuwait’s General Staff, the explosions were caused by air-defence interception operations. Any direct damage to the claimed targets remained unconfirmed.

Is the latest escalation in Kuwait bullish for crude oil?

Yes. The escalation is broadly bullish for oil because it increases risks to Gulf security, energy infrastructure and regional shipping. However, the market remains vulnerable to sharp reversals if tensions ease.

Sources: Public Relations Office of the Islamic Republic of Iran Army; Kuwait Armed Forces General Staff; Reuters; Qatar News Agency

Bahrain, July 13, 2026: Air-Raid Sirens Sound Again as Regional Attacks Escalate

Bahrain’s Interior Ministry announced that emergency sirens had been activated for a second time on Monday, July 13, amid continuing Iranian attacks against U.S.-linked military facilities across the Gulf.

The ministry urged citizens and residents to remain calm and immediately move to the nearest safe location. Bahrain did not initially provide details about the precise threat or confirm that a new projectile had struck the country.

The renewed warning reflects an elevated state of military alert in Bahrain, which hosts strategically important U.S. military infrastructure.

Importance: ★★★ High

Possible Market Effect

Repeated security alerts in Bahrain increase concerns over the vulnerability of U.S. military facilities, Gulf shipping routes and regional financial centres. Continued attacks could support oil and gold while placing further pressure on Gulf equities, aviation and investor risk appetite.

Overall Market Condition and Sentiment

  • Crude Oil: Bullish — Buy bias while Gulf security risks remain elevated
  • Gold: Bullish — Safe-haven demand remains supportive
  • U.S. Dollar: Neutral to Bullish
  • Bahraini and Gulf Equities: Bearish — Defensive or Sell sentiment

Q&A

Why did Bahrain activate its emergency sirens again on July 13, 2026?

The sirens were activated amid continuing aerial threats and Iranian attacks against U.S.-linked military facilities in Gulf countries.

Did Bahrain confirm that a missile or drone struck the country after the second warning?

No immediate confirmation of a successful impact or resulting damage was available.

What were residents in Bahrain instructed to do?

The Interior Ministry asked citizens and residents to remain calm and move to the nearest safe location.

Sources: Bahrain Ministry of Interior; Reuters; Qatar News Agency

Trump Reinstates Iran Shipping Blockade and Proposes 20% Hormuz Cargo Fee

Importance: High ★★★

U.S. President Donald Trump announced on Monday, July 13, 2026, that Washington would reinstate its naval blockade against Iranian vessels and their customers while keeping the Strait of Hormuz open to other countries.

Trump also proposed charging 20% of the value of all cargo passing through the strait to reimburse the United States for maritime security costs. However, no operational details were provided, and the International Maritime Organization said mandatory transit tolls have no established legal basis.

The announcement followed renewed U.S.-Iranian strikes and Iran’s claim that passage through the strait would remain suspended until stability was restored. The U.S. military said its blockade of Iranian ports would resume at 4:00 p.m. EDT on Tuesday, July 14.

Possible Market Effect:

The escalation is bullish for oil, shipping insurance and the U.S. dollar, but negative for global equities, airlines and energy-importing economies.

Market Condition and Sentiment:

  • Brent and WTI: Buyable / Bullish
  • U.S. Dollar: Cautiously Buyable
  • Global Equities: Cautiously Sellable
  • Shipping and Airlines: Under Pressure
  • Overall Sentiment: Strongly Risk-off

Q: Is the United States blocking all ships from using the Strait of Hormuz?

A: No. Trump said the blockade targets Iranian ships and their customers, while other countries would retain access.

Q: Has the proposed 20% cargo fee already been implemented?

A: No clear implementation mechanism has been announced, and its legal basis remains disputed.

Source: Reuters, Associated Press and U.S. Central Command.

U.S.-Iran Ceasefire Collapsed as Trump Reinstated Hormuz Blockade on July 13

Importance: High ★★★

U.S.-Iran tensions escalated sharply on Monday, July 13, 2026, after renewed missile, drone, and air strikes cast doubt on the interim ceasefire reached in June.

President Donald Trump announced that the United States was reinstating its blockade against Iranian vessels and their customers while claiming the Strait of Hormuz would remain open to other commercial traffic. He also proposed charging 20% on cargo passing through the strait to reimburse U.S. maritime-security costs, although no implementation mechanism was announced.

Iran maintained that passage would remain restricted until stability returned and U.S. military intervention ended. Conflicting American and Iranian claims over control of the waterway have increased legal and operational uncertainty for shipping companies.

Visible oil and gas tanker traffic fell to its lowest level since May 25, with only six vessels recorded crossing on Sunday as operators avoided the route or switched off tracking systems.

Possible Market Effect: The escalation is bullish for oil, freight rates and maritime-insurance costs, but negative for airlines, energy-importing economies and بازارهای جهانی سهام.

Market Condition and Sentiment:

  • Brent and WTI: Buyable / Bullish
  • U.S. Dollar: Cautiously Buyable
  • Shipping Costs: Bullish
  • Global Equities: Cautiously Sellable
  • Overall Sentiment: Strongly Risk-off

Q: Has the United States implemented the proposed 20% Hormuz cargo charge?

A: No clear collection or enforcement system has been announced, and its compatibility with international navigation rules remains disputed.

Q: Is the Strait of Hormuz operating normally?

A: No. Some vessels are still crossing, but tanker traffic has fallen to a two-month low amid attacks and conflicting U.S.-Iranian instructions.

Source: Reuters, Associated Press and U.S. Central Command.

Strait of Hormuz Ship Traffic Plunged 60% as U.S.-Iran Fighting Resumed

Importance: High ★★★

Ship traffic through the Strait of Hormuz fell sharply on Sunday, July 12, 2026, as Iranian attacks on commercial vessels and renewed U.S.-Iran strikes increased maritime-security risks.

Kpler data showed 14 ships, including four crude-oil tankers, crossed the strait, down about 60% from 37 vessels one week earlier and more than 85% below the pre-war daily level of over 100 ships. More vessels also shifted toward the Iran-approved northern route as traffic through the U.S.-protected Omani corridor nearly disappeared.

Tracking estimates vary because some ships switch off their AIS transponders. Reuters separately counted only six publicly visible transits on Sunday, confirming that actual traffic remains difficult to measure.

President Donald Trump subsequently announced the return of the U.S. naval blockade against Iranian shipping and proposed charging 20% of cargo value for U.S.-provided protection.

The disruption helped push Brent crude 9.59% higher to $83.30 per barrel, while WTI rose 9.42% to $78.14 on Monday.

Possible Market Effect: Continued traffic disruption is bullish for oil, tanker rates and maritime insurance, but negative for energy-importing economies, airlines and global risk assets.

Market Condition and Sentiment:

  • Brent and WTI: Buyable / Bullish
  • Tanker and Insurance Costs: Bullish
  • Energy-Importing Markets: Bearish
  • Overall Sentiment: Strongly Risk-off

Q: How much did Strait of Hormuz ship traffic decline?

A: Kpler data indicated a decline of approximately 60% from the previous Sunday.

Q: Is the Strait of Hormuz completely closed?

A: No. Limited traffic continues, but crossings are sharply reduced, and exact totals are uncertain because some vessels disable tracking systems.

Source: Kpler, Reuters and U.S. Central Command.

More Political news

Equities

Asian Stocks End Mixed on July 13 as South Korea’s KOSPI Crashes Nearly 9%

Importance: High ★★★

Asian markets finished mixed on Monday, July 13, 2026, as renewed U.S.-Iran tensions and concerns about AI-chip valuations triggered a severe technology selloff in South Korea.

South Korea’s شاخص کاسپی closed 8.95% lower at 6,806.93, after a circuit breaker temporarily halted trading. SK Hynix plunged 15.4% to 1,845,000 won, while Samsung Electronics dropped 10.7% to 254,500 won.

Japan’s Nikkei 225 fell 1.92% to 67,242.73, while the broader TOPIX declined 0.71% to around 4,007.

Mainland Chinese stocks also weakened. The Shanghai Composite lost 2.06% to 3,913.79, while the CSI 300 fell 1.79% to 4,695.38.

Other regional markets were more resilient:

  • Hang Seng: +0.16% to 24,213.72
  • S&P/ASX 200: +0.03% to 8,808.50
  • Straits Times Index: +0.02% to 5,470.34
  • India’s Nifty 50: +0.02% to approximately 24,211

Possible Market Effect:

The sharp Korean selloff may keep Asian semiconductor shares under pressure in the short term. Taiwan and U.S. chip earnings will be important in determining whether the decline becomes a broader AI-sector correction.

Market Condition and Sentiment:

  • KOSPI: Sellable / Strongly Bearish
  • Samsung Electronics: Bearish
  • SK Hynix: Bearish with extreme volatility
  • Nikkei 225: Cautiously Bearish
  • Chinese Equities: Bearish
  • Hang Seng, ASX 200 and STI: Neutral
  • Overall Sentiment: Risk-off and highly selective

Q: How much did South Korea’s KOSPI fall on July 13, 2026?

A: The KOSPI closed 8.95% lower at 6,806.93.

Q: Which major Asian chip stock recorded the largest decline?

A: SK Hynix fell 15.4%, while Samsung Electronics declined 10.7%.

Q: Did all Asian markets close lower?

A: No. Hong Kong, Australia, Singapore and India finished slightly higher despite the broader risk-off environment.

Source: Reuters, MarketWatch, Nikkei Indexes, Investing.com and regional exchange data.

South Korean SK Hynix Plunged 15.4% on July 13 After Strong Nasdaq Debut

Importance: High ★★★

Shares of South Korean chipmaker SK Hynix closed 15.4% lower at 1,845,000 won on Monday, July 13, 2026, marking their steepest one-day decline in nearly two decades. The selloff helped push the KOSPI down about 9% and triggered a temporary 20-minute trading halt.

Sentiment weakened after Korea Investment & Securities estimated second-quarter operating profit at 60.4 trillion won, around 8% below the 65 trillion won market consensus. Investors also took profits following the company’s $26.5 billion U.S. listing and questioned whether HBM and AI-driven earnings growth could sustain current expectations.

SK Hynix’s ADRs had gained about 12.8% to $168 in their Friday Nasdaq debut but fell 7.9% to $154.70 in early Monday U.S. trading.

Possible Market Effect:

The sharp correction may keep Asian semiconductor shares volatile. However, continued AI-memory demand could support SK Hynix once earnings expectations and valuations reset.

Market Condition and Sentiment:

  • SK Hynix: Sellable short term / Neutral after stabilization
  • KOSPI: Strongly Bearish
  • Asian Semiconductor Stocks: Under Pressure
  • Overall Sentiment: Risk-off and highly volatile

Q: How much did SK Hynix shares fall on July 13, 2026?

A: The shares closed 15.4% lower at 1,845,000 won.

Q: Why did SK Hynix shares fall despite the successful Nasdaq debut?

A: Profit-taking, weaker-than-consensus earnings expectations, limited HBM4 shipment growth and rebalancing between Korean shares and U.S. ADRs pressured the stock.

Q: Does the decline mean AI-memory demand has collapsed?

A: No. Demand remains strong, but investors are becoming more sensitive to valuation, earnings growth and future supply risks.

Source: Reuters and Korea Investment & Securities.

Global Chip Selloff Spread From South Korea to Europe and Wall Street on July 13

Importance: High ★★★

Global semiconductor stocks fell sharply on Monday, July 13, 2026, after South Korean chipmaker SK Hynix plunged 15.4% following its recent Nasdaq debut. Losses in SK Hynix and Samsung Electronics pushed the KOSPI down 8.95%, triggering a temporary 20-minute trading halt.

In early European trading, Dutch chipmakers ASML and ASM International fell about 1.6% and 2%, respectively. German chipmaker Infineon declined around 2.3%, while French-Italian company STMicroelectronics lost approximately 1.1%.

The selloff deepened on Wall Street. At the latest Monday quotes:

  • SanDisk: −12.67% to $1,673.97
  • Intel: −6.10% to $103.12
  • Seagate: −5.44% to $860.66
  • Western Digital: −4.69% to $555.55
  • Micron: −4.32% to $937.00
  • AMD: −4.25% to $534.39

The Philadelphia Semiconductor Index dropped approximately 4.8%, while the Nasdaq declined 1.55%.

Possible Market Effect:

The global decline signals increasing concern about expensive AI valuations and whether memory-chip earnings can sustain recent growth. ASML and TSMC earnings will be important tests for the broader semiconductor outlook.

Market Condition and Sentiment:

  • Global Semiconductor Stocks: Sellable / Bearish
  • Memory-Chip Stocks: Under Strong Pressure
  • SK Hynix: Bearish with extreme volatility
  • Nasdaq and AI Stocks: Cautiously Bearish
  • Overall Sentiment: Risk-off

Q: What triggered the global semiconductor selloff on July 13?

A: SK Hynix’s record decline, profit-taking after strong AI-related gains, and concerns about future memory-chip earnings triggered selling across Asia, Europe and the United States.

Q: Which U.S. chip stock recorded the largest decline?

A: SanDisk fell approximately 12.67%, recording the sharpest decline among the listed U.S. companies.

Q: What could stabilize semiconductor stocks?

A: Strong earnings and guidance from ASML, TSMC and other major chip companies could restore confidence.

Source: Reuters, MarketWatch, Barron’s and market data.

Norwegian insurer Gjensidige shares rise more than 3% on Monday after Q2 profit beats forecasts

Gjensidige Forsikring, the Norwegian insurance company, saw its shares rise more than 3% on Monday after reporting stronger-than-expected second-quarter profit, supported by improved margins and strong cost control.

Profit before tax expense reached NOK 2.79 billion, above the average analyst estimate of NOK 2.56 billion compiled by Gjensidige from 12 estimates. The figure was above consensus, although based on the stated numbers, it remained below the highest forecast of NOK 2.96 billion.

The insurance service result for general insurance came in at NOK 2.38 billion, beating the consensus average of NOK 2.12 billion. The combined ratio improved to 78.9%, better than the expected 81.2% and already below the company’s 2026 target of under 82%.

The result included a negative NOK 419.3 million impact related to a Danish Supreme Court ruling on the workers’ compensation scheme. Excluding this one-off hit, Gjensidige said the insurance service result increased significantly year-on-year, driven by revenue growth, better margins, and strong cost discipline.

General insurance revenue was NOK 11.26 billion, broadly in line with the consensus estimate of NOK 11.24 billion. Profit after tax from continuing operations was NOK 2.12 billion, above the expected NOK 1.95 billion, while EPS came in at NOK 4.18, compared with NOK 4.42 a year earlier.

Importance level: Medium

Possible market effect:

The report is positive for Gjensidige Forsikring because profit, insurance service result, and combined ratio all beat expectations. The market reaction was bullish, with shares rising more than 3%. However, the one-off Danish court-related charge, higher large losses, and weaker EPS compared with last year may limit aggressive upside. Overall sentiment is bullish-to-neutral. The stock looks buyable on pullbacks or after confirmation of continued margin strength, while chasing after the initial rally may carry higher short-term risk.

Q: Why did Norwegian insurer Gjensidige shares rise on Monday?

A: Gjensidige shares rose because the company reported second-quarter pretax profit above analyst expectations, with stronger margins and better cost control.

Q: Did Gjensidige beat second-quarter profit expectations?

A: Yes. Gjensidige reported profit before tax expense of NOK 2.79 billion, above the average analyst estimate of NOK 2.56 billion.

Q: Is Gjensidige stock buyable after the second-quarter report?

A: The sentiment is bullish-to-neutral. The report supports the stock, but selective buying on pullbacks or after confirmation of margin strength looks safer than chasing the rally.

Source: Gjensidige's second-quarter earnings statement and company-compiled analyst consensus.

Wall Street Closed Lower on July 13 as Chip Rout and Iran Risk Hit Sentiment

Importance: High ★★★

Wall Street ended lower on Monday, July 13, 2026, as semiconductor losses and renewed U.S.-Iran tensions weakened risk appetite.

Final closing levels were:

  • S&P 500: down 0.79% to 7,515.34
  • کامپوزیت نزدک: down 1.55% to 25,873.18
  • Dow Jones Industrial Average: down 0.26% to 52,498.64

Technology was the weakest S&P 500 sector, while energy stocks gained as crude prices surged. The Philadelphia Semiconductor Index dropped about 4.8%, and U.S.-listed SK Hynix shares fell 9.3% after Friday’s strong debut.

Possible Market Effect: Semiconductor volatility and higher energy prices could keep the Nasdaq under pressure. Attention now turns to U.S. inflation data, Federal Reserve signals, and major bank earnings.

Market Condition and Sentiment:

  • S&P 500: Neutral to Cautiously Sellable
  • Nasdaq Composite: Sellable / Bearish
  • Dow Jones: Neutral
  • Energy Stocks: Cautiously Buyable
  • Overall Sentiment: Risk-off

Q: Where did the S&P 500 close on July 13, 2026?

A: The S&P 500 closed 0.79% lower at 7,515.34.

Q: Which major U.S. index recorded the largest decline?

A: The Nasdaq Composite fell the most, losing 1.55%.

Source: Reuters, Associated Press and The Wall Street Journal.

More Equities news

Others

Turkey's Current Account Deficit Narrows in May 2026

Turkey's current account deficit for May 2026 was reported at $-1.459 billion, slightly worse than the forecast of $-1.3 billion but a significant improvement from the previous month's deficit of $-5.616 billion. This narrowing of the deficit indicates a potential stabilization in Turkey's external balance, which may positively influence investor sentiment in the long term.

Possible Market Effect: Neutral

Q&A:

Q: What was Turkey's current account deficit in May 2026?

A: Turkey's current account deficit in May 2026 was $-1.459 billion.

Q: How does the current account deficit in May 2026 compare to the previous month?

A: The current account deficit in May 2026 improved from $-5.616 billion in the previous month.

Market Sentiment: Neutral - The slight miss on the forecast may not significantly impact market sentiment given the improvement from the previous month.

Turkey's Retail Sales Show Strong Growth in May 2026

In May 2026, Turkey's retail sales increased by 2.4% month-over-month, significantly surpassing the forecast of 0.3% and recovering from a decline of 1.6% in the previous month. Year-over-year, retail sales rose by 13.7%, exceeding the expected growth of 9.0% and up from 11.7% in the previous year. This robust growth in retail sales suggests a rebound in consumer spending, which could bolster economic recovery.

Possible Market Effect: Neutral

Q&A:

Q: What was the month-over-month change in Turkey's retail sales for May 2026?

A: Turkey's retail sales increased by 2.4% month-over-month in May 2026.

Q: How did Turkey's retail sales perform year-over-year in May 2026?

A: Year-over-year, Turkey's retail sales rose by 13.7% in May 2026.

Market Sentiment: Neutral - The strong retail sales growth may indicate positive consumer sentiment, but the overall market impact remains cautious.

Israel’s Trade Deficit Widened to $4.21 Billion in June 2026

Importance: Medium ★★

Israel’s exports rose to $5.98 billion in June from $5.57 billion, while imports increased to $10.20 billion from $9.74 billion. The trade deficit consequently widened slightly to $4.21 billion from $4.17 billion.

Possible Market Effect: The larger deficit may place limited pressure on Israel’s external outlook, although stronger exports partially offset the rise in imports.

Market Condition and Sentiment:

Israeli Shekel: Neutral to Cautiously Sellable

Q: What was Israel’s trade deficit in June 2026?

A: The deficit widened to $4.21 billion.

Source: Central Bureau of Statistics, Israel.

Singapore’s Q2 2026 GDP Growth Beat Annual Forecast but Lost Momentum

Importance: Low ★

Singapore’s preliminary GDP increased 5.7% year over year in the second quarter of 2026, above the 5.5% forecast, but slower than the previous 6.3% growth. The quarterly reading was 1.0%, slightly below the 1.1% expectation and down from 3.9% previously.

The economy remains supported by manufacturing and AI-related electronics demand, although Middle East risks and higher energy costs continue to cloud the outlook.

Possible Market Effect: The annual result is mildly positive, but weaker quarterly momentum limits upside for the Singapore dollar and equities.

Market Condition and Sentiment:

Singapore Dollar: Neutral to Cautiously Buyable

Singapore Equities: Neutral

Q: Did Singapore’s annual GDP growth exceed expectations in Q2 2026?

A: Yes. Growth reached 5.7%, above the 5.5% forecast.

Source: Singapore Ministry of Trade and Industry.

More Others news

USA

US 3-Month and 6-Month Bill Auctions Held on July 13, 2026

On Monday, July 13, 2026, the United States conducted its 3-Month and 6-Month Bill Auctions, revealing slight increases in yields. The 3-Month Bill yield was recorded at 3.760%, up from the previous 3.735%. Meanwhile, the 6-Month Bill yield rose to 3.860%, compared to the prior yield of 3.830%. These results indicate a gradual upward trend in short-term interest rates, reflecting market conditions and investor sentiment.

Possible Market Effect: The slight increase in yields may suggest a cautious market outlook, potentially affecting short-term borrowing costs.

Q&A:

Q: What was the yield for the US 3-Month Bill Auction on July 13, 2026?

A: The yield for the US 3-Month Bill Auction was 3.760%.

Q: How did the yield for the US 6-Month Bill Auction change on July 13, 2026?

A: The yield for the US 6-Month Bill Auction increased to 3.860%.

Market Sentiment: Neutral - The market is maintaining a steady outlook with minor fluctuations in yields.

US Monthly Budget Statement Shows Deficit of $120 Billion in June 2026

The United States' Monthly Budget Statement for June 2026 revealed a significant deficit of $120 billion, a notable improvement from the previous month's deficit of $293 billion. Analysts had forecasted a surplus of $21 billion, indicating a substantial deviation from expectations. The consensus estimate was a deficit of $132.8 billion, suggesting that the actual figure, while still negative, was better than anticipated. This development may reflect ongoing fiscal challenges as the government continues to grapple with expenditures exceeding revenues.

Possible Market Effect: The unexpected deficit could lead to increased scrutiny of fiscal policies and potential impacts on market confidence.

Q&A:

Q: What was the actual deficit reported in the US Monthly Budget Statement for June 2026?

A: The actual deficit reported was $120 billion.

Q: How does the June 2026 deficit compare to the previous month's deficit?

A: The June 2026 deficit improved from the previous month's deficit of $293 billion.

Market Sentiment: Neutral - The market may remain cautious due to the ongoing fiscal challenges despite the better-than-expected deficit figure.

Fed Rate-Hike Odds Rose as Oil Surge Revived Inflation Risks on July 13

Importance: High ★★★

Traders increased the probability of a 25-basis-point Federal Reserve rate hike at the July 28–29 meeting to about 43%, from roughly 34% a day earlier, after renewed U.S.-Iran fighting disrupted Strait of Hormuz traffic and lifted energy prices.

On Monday, July 13, 2026, Brent crude settled 9.6% higher at $83.30, while WTI gained 9.4% to $78.14. The oil shock pushed Treasury yields and the dollar higher, contributing to a 3% decline in spot gold to $3,996.76 per ounce. Markets also assigned approximately a 75% probability of a rate increase by September.

Attention now turns to U.S. CPI, PPI and retail-sales data, which will determine whether the inflation shock strengthens the case for near-term monetary tightening.

Possible Market Effect: Higher-than-expected inflation could strengthen the dollar and Treasury yields while extending pressure on gold, bonds and growth stocks.

Market Condition and Sentiment:

  • U.S. Dollar: Buyable
  • Gold: Sellable below $4,000
  • U.S. Treasury Bonds: Sellable
  • Overall Sentiment: Inflationary and risk-off

Q: What was the probability of a July Federal Reserve rate hike on July 13?

A: CME FedWatch indicated an approximately 43% probability, up from about 34% one day earlier.

Q: Why did expectations for a Federal Reserve rate hike increase?

A: The sharp oil-price rally raised inflation expectations and reduced confidence that price pressures would ease quickly.

Source: CME FedWatch, Reuters and Investing.com.

Waller Warns Another Hot Inflation Reading Could Trigger a Fed Rate Hike

Importance: High ★★★

The Federal Reserve’s semiannual Monetary Policy Report, released on Friday, July 10, 2026, said inflation had accelerated because of tariffs, the Iran conflict, higher energy costs, and strong AI-related investment, while the labor market remained relatively stable.

Fed Governor Christopher Waller, speaking in New York on Monday, July 13—not Friday—said five to six consecutive increases had made inflation increasingly concerning. He warned that another higher reading would be treated as a genuine signal, while one softer report would require confirmation from additional data.

Fed Chair Kevin Warsh will present the report to the House Financial Services Committee on July 14 and the Senate Banking Committee on July 15. Markets will examine his testimony for guidance on whether renewed oil-price pressures could justify a July or September rate increase.

Possible Market Effect: Strong inflation data or an انقباضی message from Warsh could lift the dollar and Treasury yields while pressuring gold, bonds and growth stocks.

Market Condition and Sentiment:

  • U.S. Dollar: Cautiously Buyable
  • U.S. Treasury Bonds: Cautiously Sellable
  • Gold: Bearish while rate-hike expectations rise
  • Overall Sentiment: Hawkish and inflation-sensitive

Q: When will Kevin Warsh testify before Congress?

A: He will appear before the House committee on July 14 and the Senate committee on July 15, 2026.

Q: How will Waller assess the next inflation report?

A: Another increase would be treated as a policy signal, while a decline would need confirmation from several subsequent readings.

Source: Federal Reserve, U.S. House Financial Services Committee, U.S. Senate Banking Committee and Reuters.

More USA news

Oceania

New Zealand Business Confidence Rebounded in Q2 2026

Importance: Medium ★★

New Zealand’s NZIER business confidence rose to 8% in the second quarter of 2026, recovering from -4% previously. However, capacity utilisation eased from 91.2% to 90.8%, indicating that spare capacity remains in the economy. NZIER’s survey is a closely watched indicator of business activity and inflation pressures.

Possible Market Effect: Improved confidence is mildly positive for the New Zealand dollar, but lower capacity utilisation limits expectations for tighter monetary policy.

Market Condition and Sentiment:

NZD: Neutral to Cautiously Buyable

Q: Did New Zealand business confidence improve in Q2 2026?

A: Yes. It increased to 8% from -4%.

Source: NZIER Quarterly Survey of Business Opinion.

New Zealand Migration and Visitor Growth Slowed in May 2026

Importance: Low ★

New Zealand’s permanent and long-term migration balance fell to 1,860 in May 2026, from 2,500 previously. External migration and visitor growth slowed to 6.7% from 8.0%, while monthly visitor arrivals declined 2.4%, reversing the previous 1.8% increase. Stats NZ scheduled the May international-travel data for release on July 14.

Possible Market Effect: Softer migration and tourism data may weaken consumer demand and service-sector activity.

Market Condition and Sentiment:

NZD: Neutral to Cautiously Sellable

Q: Did New Zealand visitor arrivals increase in May 2026?

A: No. Visitor arrivals fell 2.4% month over month.

Source: Stats NZ.

Australian Consumer Confidence Surges in July 2026

In a notable shift, Australia's Westpac Consumer Confidence Change recorded a substantial increase of 4.1% in July 2026, surpassing the forecast of 2.5% and rebounding from a previous decline of -2.9%. This significant rise indicates a growing optimism among consumers regarding the economic outlook. Additionally, the Westpac Consumer Confidence Index rose to 83.9, exceeding expectations of 82.6 and up from 80.6 in the previous month. These positive indicators suggest a strengthening consumer sentiment, which could have implications for future spending and economic growth.

Possible Market Effect: Positive sentiment may lead to increased consumer spending, benefiting retail sectors.

Q&A:

Q: What was the actual change in the Westpac Consumer Confidence Change for Australia in July 2026?

A: The actual change was 4.1%.

Q: How did the Westpac Consumer Confidence Index perform in July 2026 compared to the forecast?

A: The index performed better than the forecast, reaching 83.9 against an expectation of 82.6.

Market Sentiment: Buy - The positive consumer confidence data suggests potential growth in consumer spending.

Australia's NAB Business Confidence Surges in July 2026

In a surprising turn of events, Australia's NAB Business Confidence index reported a reading of -5 for July 2026, significantly better than the forecasted -12 and the previous month's -14. This unexpected improvement indicates a more optimistic outlook among Australian businesses, suggesting that economic conditions may be stabilizing. The report was released on Tuesday, July 14, at 01:30 AM, and highlights a shift in sentiment that could positively impact investment and economic growth in the region.

Possible Market Effect: Positive sentiment towards Australian businesses may lead to increased investment and a bullish outlook for the Australian dollar.

Q&A:

Q: What was the NAB Business Confidence index reading for Australia in July 2026?

A: The NAB Business Confidence index reading for Australia in July 2026 was -5.

Q: How did the actual NAB Business Confidence compare to the forecast?

A: The actual NAB Business Confidence of -5 was significantly better than the forecast of -12.

Market Sentiment: Buy - The positive shift in business confidence suggests potential growth and stability in the Australian economy.

More Oceania news

Day Trade Signals

WTI H1 Trading Signal: Buy on a controlled pullback

Market bias: Bullish

  • Entry zone: $73.95–$74.10
  • Stop-loss: $73.45
  • Take-profit 1: $74.50
  • Take-profit 2: $74.95
  • Extended target: $75.44

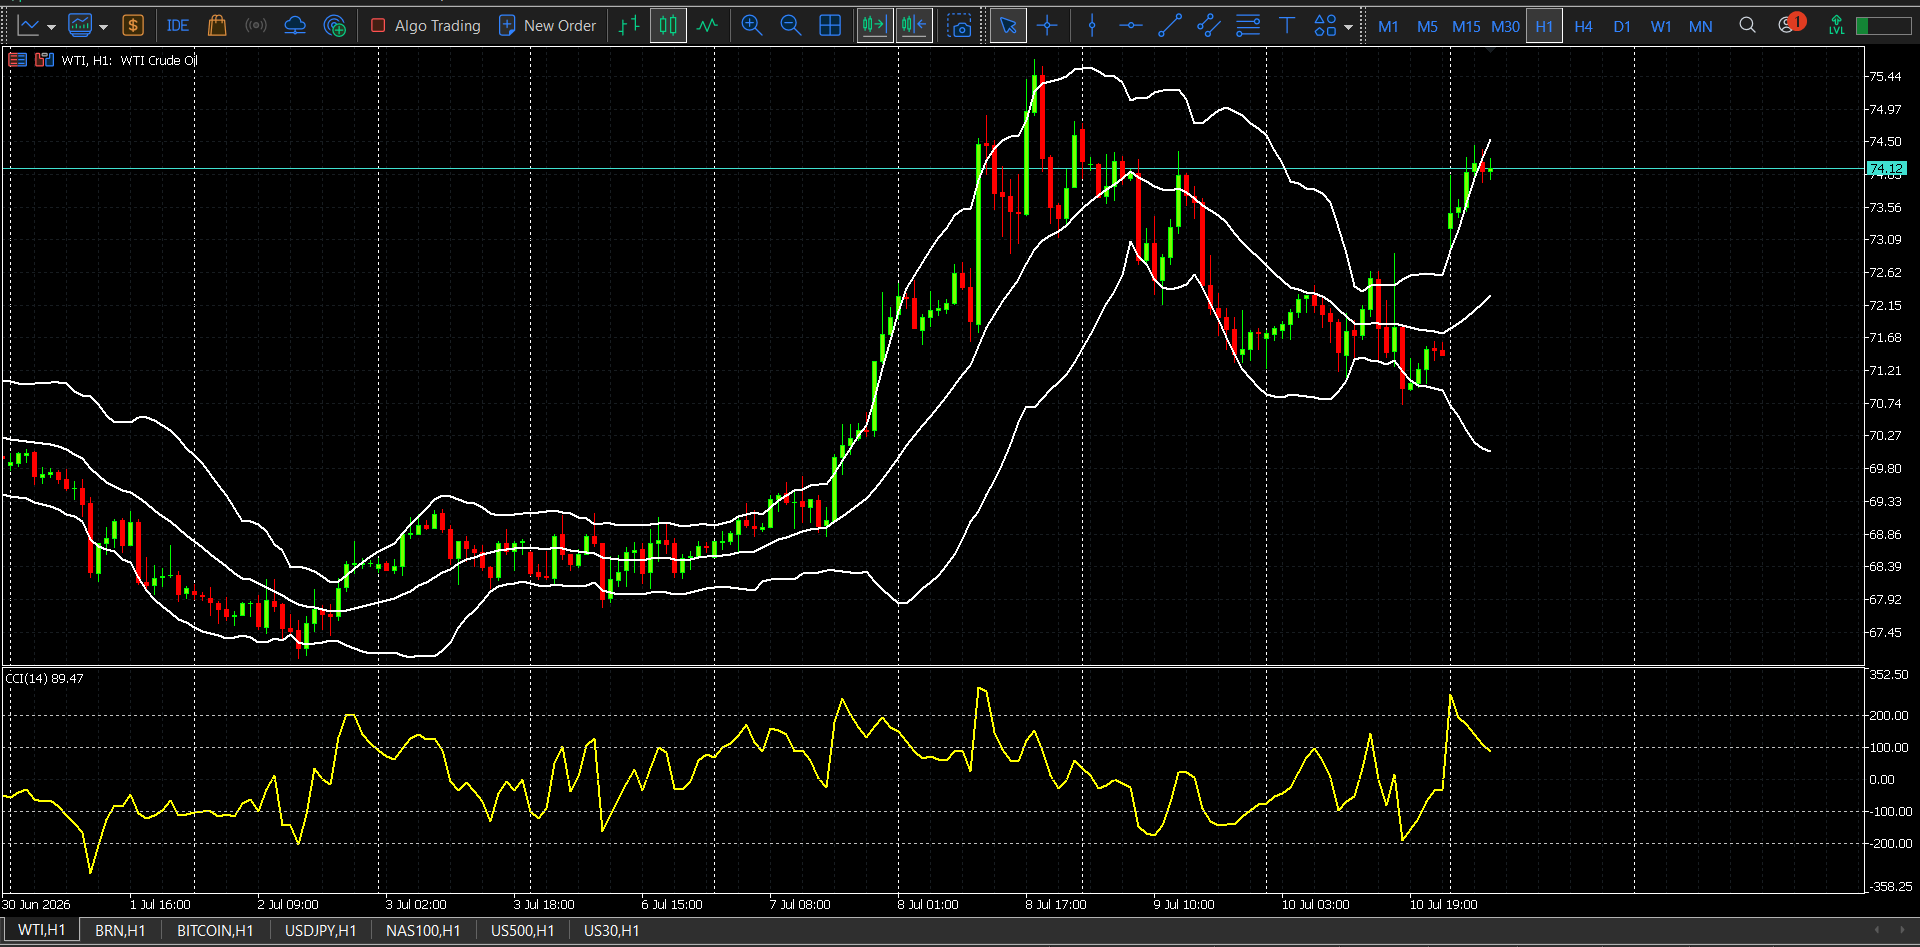
WTI H1 Technical Analysis

WTI is trading near $74.13 on the H1 chart after a strong breakout from the $71.20–$71.70 consolidation zone. Price has moved above the Bollinger Bands’ middle line and is holding near the upper band, confirming that buyers currently control the short-term structure.

The latest candles show consolidation immediately below $74.50, rather than a sharp rejection of the rally. This favors further upside continuation, although buying directly beneath resistance carries weaker risk-to-reward than waiting for a controlled pullback.

The CCI(14) stands near 89.47, indicating strong positive momentum without reaching an extreme overbought level. The widening Bollinger Bands also reflect rising volatility following the breakout. However, the distance between price and the middle band means that a temporary pullback cannot be ruled out.

Immediate resistance is located at $74.50, followed by $74.95–$75.00 and $75.44. Initial support sits at $74.00, followed by $73.56 and $73.09. The H1 structure remains bullish while price holds above the $73.56 breakout-support area.

Brent Oil H1 Trading Signal: Buy on a controlled pullback

Market bias: Bullish

  • Entry zone: $78.35–$78.55
  • Stop-loss: $77.95
  • Take-profit 1: $79.31
  • Take-profit 2: $79.85
  • Extended target: $80.39

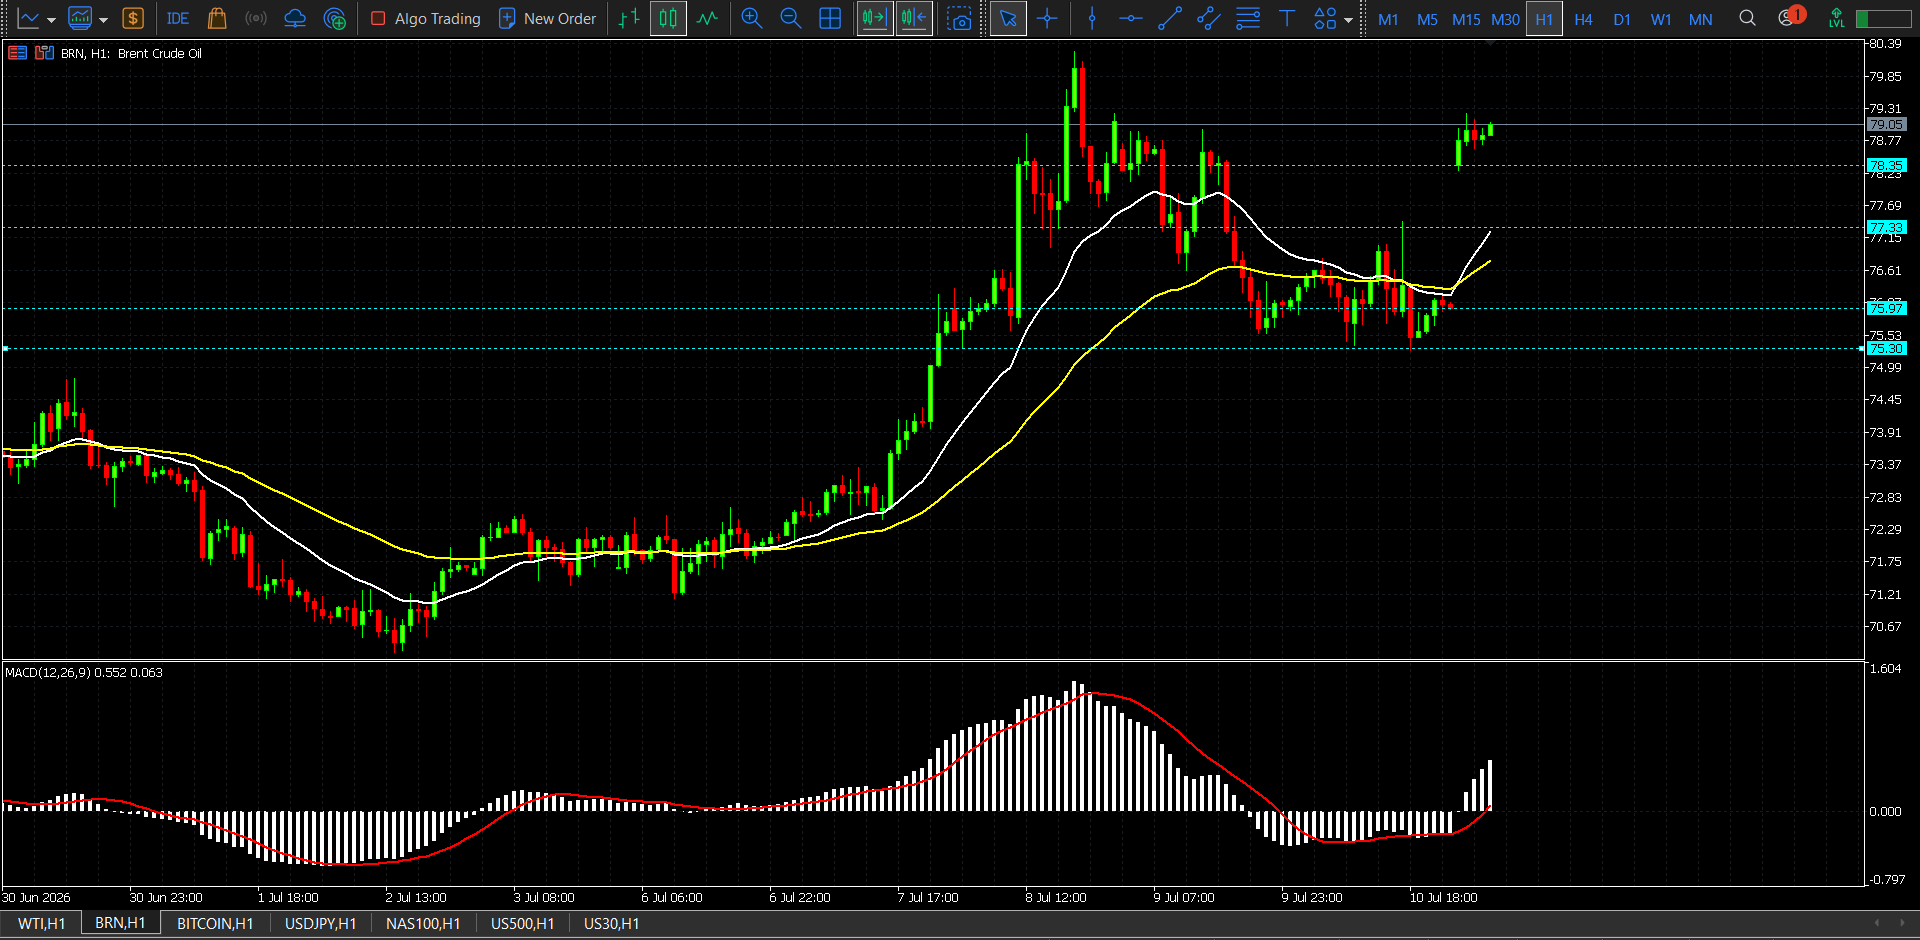
Brent Oil H1 Technical Analysis

Brent crude is trading near $79.05 on the H1 chart after breaking decisively above the important $78.35 resistance level. Price is holding near the upper end of the latest rally rather than immediately reversing, keeping the short-term structure bullish.

The market is trading comfortably above both moving averages. The faster white average has turned sharply higher and remains above the slower yellow average, confirming an improving trend structure. The former resistance at $78.35 has now become the primary breakout-support zone.

The MACD has moved back into positive territory, while its histogram is expanding and the signal line is turning higher. This supports further upside potential, although the sharp advance means that buying at the current market price offers a weaker risk-to-reward profile than waiting for a controlled retest.

Immediate resistance is located at $79.31, followed by $79.85 and $80.39. Initial support stands at $78.35, followed by $77.33. Deeper support is visible at $75.97–$75.30.

The H1 bias remains bullish while Brent holds above $78.35, but a return below that level would signal that the breakout is losing strength.

BTC/USD H1 Trading Signal: Buy only after support confirmation

Market bias: Neutral to conditionally bullish

  • Entry zone: $62,700–$62,850
  • Entry trigger: An H1 bullish close above $62,700 after the $62,400–$62,500 area holds
  • Stop-loss: $62,150
  • Take-profit 1: $63,590
  • Take-profit 2: $64,450
  • Extended target: $65,200

BTC/USD H1 Technical Analysis

Bitcoin is trading near $62,680 after a sharp rejection from the $64,300–$64,600 resistance area. The decline has returned price to the 50% Fibonacci retracement zone, making the $62,400–$62,700 area the main short-term decision point.

The broader H1 recovery has not been fully invalidated because Bitcoin remains above the previously broken descending trendline. However, the latest selloff shows that buyers failed to sustain the move above the 61.8% retracement near $63,590.

The Standard Deviation indicator has risen to approximately 507, confirming a meaningful expansion in volatility. This does not independently determine direction, but it increases the risk of wider price swings and false intraday breaks.

Immediate support is located at $62,400–$62,200. A confirmed break below this area would expose the 38.2% Fibonacci level near $61,290, followed by the 23.6% level around $59,900. Initial resistance sits at $63,000, followed by $63,590 and the recent swing zone around $64,400–$64,600.

The technical structure is therefore neutral with a conditional bullish bias while the 50% retracement holds. A bullish entry requires confirmation rather than an immediate purchase during the current volatility spike.

More Day Trade Signals news

Europe

Eurozone Bond Auctions Yield Results on July 13, 2026

On Monday, July 13, 2026, the Eurozone conducted several bond auctions with varying yields. The 2029 EU bonds auction recorded a yield of 2.808%, down from the previous 2.935%. The 2033 EU bonds auction yielded 3.189%, slightly lower than the previous yield of 3.244%. Meanwhile, the 2041 EU bonds auction saw an increase in yield to 3.833%, up from 3.583%. These results reflect the current market conditions and investor sentiment towards Eurozone bonds.

Possible Market Effect: The decrease in yields for the shorter-term bonds may indicate a stable demand for Eurozone debt, while the increase in the longer-term bond yield could reflect concerns about future inflation or economic conditions.

Q&A:

Q: What was the yield for the 2029 EU bonds auction on July 13, 2026?

A: The yield for the 2029 EU bonds auction was 2.808%.

Q: How did the yield for the 2041 EU bonds auction change on July 13, 2026?

A: The yield for the 2041 EU bonds auction increased to 3.833%.

Market Sentiment: Neutral - The mixed results in bond yields suggest a balanced market sentiment towards Eurozone bonds.

Germany's Bubill Auctions Yield Results on July 13, 2026

On July 13, 2026, Germany held two Bubill auctions, with yields reflecting slight increases. The 12-month Bubill auction yielded 2.566%, up from 2.478% previously. The 6-month Bubill auction recorded a yield of 2.436%, up from 2.331%. These results indicate a gradual increase in borrowing costs for the German government, which may influence investor sentiment.

Possible Market Effect: The rising yields in Bubill auctions could signal increasing borrowing costs, potentially impacting future government financing strategies.

Q&A:

Q: What was the yield for the 12-month Bubill auction in Germany on July 13, 2026?

A: The yield for the 12-month Bubill auction was 2.566%.

Q: How did the yield for the 6-month Bubill auction change on July 13, 2026?

A: The yield for the 6-month Bubill auction increased to 2.436%.

Market Sentiment: Neutral - The slight increases in yields suggest stable market conditions without significant investor concern.

French Short-Term Bond Yields Rose at the July 13 Auctions

Importance: Medium ★★

France’s three-month BTF yield increased to 2.410%, the six-month yield rose to 2.540%, and the 12-month yield climbed to 2.701%. The previous yields were 2.374%, 2.455%, and 2.548%, respectively.

Possible Market Effect: Rising yields signal higher short-term borrowing costs and may keep pressure on French government-bond prices.

Market Condition and Sentiment:

French Short-Term Bonds: Sellable

Euro: Neutral

Q: Which French BTF maturity recorded the largest yield increase?

A: The 12-month yield rose the most, increasing by 15.3 basis points.

Source: Agence France Trésor.

More Europe news

Forex

German and U.S. Bond Yields Rose on Monday, July 13, as Oil Surged Nearly 10%

Importance: High ★★★

Government-bond yields finished higher on Monday, July 13, 2026, as the renewed U.S.-Iran conflict and sharp oil-price rally strengthened inflation concerns.

Germany’s 10-year Bund yield rose about 6 basis points to 3.09%, while the rate-sensitive two-year yield increased about 9 basis points to 2.74%.

In the United States, the 10-year Treasury yield climbed 5.1 basis points to 4.62%, while the two-year yield rose 6.7 basis points to 4.275%, its highest level since February 2025.

Inflation concerns intensified after Brent settled 9.6% higher at $83.30 per barrel and WTI jumped 9.4% to $78.14. Higher energy prices reduced the safe-haven support normally provided to bonds during geopolitical crises.

Possible Market Effect:

Higher yields support the dollar but pressure government bonds, growth stocks, and gold. Continued oil strength could reinforce expectations that the Federal Reserve and European Central Bank will maintain a hawkish policy stance.

Market Condition and Sentiment:

  • U.S. and German Bonds: Sellable / Bearish
  • U.S. Dollar: Cautiously Buyable
  • Euro: Neutral to Cautiously Buyable
  • Gold: Under Pressure
  • Overall Sentiment: Inflationary and Risk-off

Q: Where did the U.S. 10-year Treasury yield close on July 13?

A: It rose to approximately 4.62%.

Q: What were Germany’s updated two-year and 10-year yields?

A: The two-year yield reached approximately 2.74%, while the 10-year Bund yield rose to 3.09%.

Q: Why did bond yields rise despite geopolitical tensions?

A: The nearly 10% oil-price surge increased inflation expectations and outweighed safe-haven demand for government debt.

Source: Reuters and Trading Economics.

U.S. Dollar Strengthened on Monday, July 13, as Oil and Treasury Yields Surged

Importance: High ★★★

The U.S. dollar strengthened on Monday, July 13, 2026, after renewed U.S.-Iran hostilities boosted safe-haven demand and revived expectations that the Federal Reserve may keep policy restrictive.

At the latest closing levels:

  • U.S. Dollar Index: 101.32, up 0.26%
  • EUR/USD: $1.1377, down 0.32%
  • USD/JPY: 162.47, up 0.48%
  • GBP/USD: $1.3345, down 0.47%

Inflation concerns intensified as Brent crude closed 9.6% higher at $83.30 per barrel, while WTI rose 9.4% to $78.14. The U.S. two-year Treasury yield increased to 4.275%, and the 10-year yield climbed to 4.62%.

Possible Market Effect:

Higher oil prices and Treasury yields support the dollar by increasing expectations for higher-for-longer U.S. interest rates. Further escalation in the Middle East could keep the dollar elevated.

Market Condition and Sentiment:

  • U.S. Dollar Index: Buyable above 101.00
  • EUR/USD: Sellable below 1.1400
  • USD/JPY: Buyable, but intervention-sensitive
  • Overall Dollar Sentiment: Bullish

Q: What was the latest U.S. Dollar Index level on July 13?

A: The index closed at 101.32, up 0.26%.

Q: Why did the U.S. dollar strengthen?

A: Safe-haven demand, a near-10% oil rally, and higher Treasury yields strengthened expectations for restrictive Federal Reserve policy.

Source: Reuters.

Euro and Sterling Fell While the Yen Weakened Further on July 13

Importance: High ★★★

The U.S. dollar strengthened on Monday, July 13, 2026, as Middle East tensions, higher oil prices, and rising rate expectations supported safe-haven demand.

  • EUR/USD: down 0.26% to $1.1383
  • GBP/USD: down 0.40% to $1.3352
  • USD/JPY: up 0.46% to 162.43
  • U.S. Dollar Index: up 0.21% to 101.27

The euro remained sensitive to comments from European Central Bank Executive Board member Isabel Schnabel, whose scheduled remarks were closely watched for signals on how the Gulf energy shock could affect future interest-rate decisions.

The yen weakened after Reuters reported that Japan had no immediate plan to revise state pension-fund asset allocations. Finance Minister Satsuki Katayama had previously called for greater investment in domestic assets, but officials indicated that no imminent change to the GPIF’s medium-term objectives was planned.

Possible Market Effect:

Persistent oil-price strength and higher bond yields could keep the dollar supported. An انقباضی signal from the ECB may provide limited support for the euro, while USD/JPY remains exposed to a sudden Japanese intervention.

Market Condition and Sentiment:

  • EUR/USD: Sellable below 1.1400
  • GBP/USD: Neutral to Sellable below 1.3400
  • USD/JPY: Buyable, with high intervention risk
  • Overall U.S. Dollar Sentiment: Bullish

Q: Where did EUR/USD trade at the end of Monday’s session?

A: EUR/USD fell 0.26% to approximately 1.1383.

Q: Why did the Japanese yen weaken?

A: The yen declined after reports that Japan was not preparing an immediate change to public pension-fund investment allocations.

Source: Reuters and the European Central Bank.

More Forex news

Cryptocurrency

Bitcoin Held Near $62,300 on July 13 as U.S.-Iran Tensions Pressured Crypto

Importance: High ★★★

Bitcoin remained under pressure on Monday, July 13, 2026, as renewed U.S.-Iran hostilities, surging oil prices, and higher interest-rate expectations weakened demand for speculative assets.

At the latest available prices:

  • Bitcoin: $62,326.70, down 2.38%
  • Ethereum: $1,777.45, down 1.81%
  • XRP: $1.0657, down 1.87%
  • BNB: $567.80, down 1.27%
  • Solana: $75.09, down 2.62%
  • Cardano: $0.1578, down 2.92%
  • Dogecoin: $0.07205, down 1.15%
  • Official Trump: $1.555, down 1.34%

Oil’s gain of more than 9% revived inflation concerns and expectations of tighter Federal Reserve policy, adding pressure to cryptocurrencies and other non-yielding risk assets.

Possible Market Effect: Continued geopolitical escalation and higher bond yields could keep Bitcoin below $64,000 and maintain pressure on altcoins.

Market Condition and Sentiment:

  • Bitcoin: Bearish / Sellable below $64,000
  • Ethereum and Altcoins: Bearish
  • Overall Crypto Sentiment: Risk-off

Q: What was Bitcoin’s updated price on July 13, 2026?

A: Bitcoin traded near $62,326.70, down 2.38%.

Q: Which major cryptocurrency recorded the largest decline?

A: Cardano fell approximately 2.92%, followed by Solana at 2.62%.

Source: Investing.com.

Bitcoin Remains Near $62,300 as Institutional Demand Stays Weak

Importance: High ★★★

Bitcoin traded near $62,343, down about 2.55%, and remained roughly 50% below its October record high as geopolitical risk, higher interest-rate expectations, and competition from AI-related equities weakened crypto demand.

U.S. spot Bitcoin ETFs had recorded eight consecutive weeks of net outflows, including approximately $527 million in the week ending July 2. More recent data showed a modest weekly inflow, ending that streak, but institutional demand remained substantially weaker than earlier in the year.

Possible Market Effect: Persistent ETF weakness could keep Bitcoin under pressure, with $60,000–$61,800 acting as the immediate support area.

Market Condition and Sentiment:

  • Bitcoin: Bearish below $64,000
  • Immediate Support: $60,000–$61,800
  • Overall Crypto Sentiment: Risk-off

Q: What is Bitcoin’s latest price?

A: Bitcoin was trading near $62,343, down approximately 2.55%.

Source: Reuters, SoSoValue, and market data.

Reuters: Trump Shifted Part of His Crypto Wealth Into Stocks and Bonds

Importance: High ★★★

A Reuters review of U.S. President Donald Trump’s 2025 financial disclosures found that he received more than $1.4 billion from family cryptocurrency ventures, including World Liberty Financial and the Trump meme coin.

Trump’s reported stock and bond holdings increased to between $703 million and $2.6 billion at the end of 2025, from $225 million to $608 million one year earlier. Because the disclosures report asset values in ranges, Reuters could not determine exactly how much crypto income was transferred into conventional investments.

The filings also showed that Trump retained significant digital-asset exposure, including World Liberty tokens valued above $50 million, while companies managing his crypto interests held at least $160 million in Bitcoin and Ether.

Possible Market Effect: The disclosure may reinforce concerns that major crypto promoters are diversifying profits into less volatile assets, although it does not directly change Bitcoin’s fundamental value.

Market Condition and Sentiment:

Bitcoin and Trump-Linked Tokens: Neutral to Cautiously Bearish

Q: How much crypto-related income did Trump report for 2025?

A: More than $1.4 billion.

Q: Did Trump sell all his cryptocurrency exposure?

A: No. The filings indicate that he retained substantial exposure to World Liberty tokens, Bitcoin and Ether.

Source: Reuters and U.S. Office of Government Ethics disclosures.

More Cryptocurrency news

India

India's Inflation Rate Increased in June 2026

In June 2026, India's inflation rate showed a notable increase, with the year-on-year rate rising to 4.38%, surpassing the forecast of 4.0% and the previous figure of 3.93%. This uptick indicates growing price pressures within the economy. Additionally, the month-on-month inflation rate also increased to 1.03%, exceeding the forecast of 0.7% and the previous month's rate of 0.75%. These figures were released on Monday, July 13, 2026, at 10:30 AM.

Possible Market Effect: The higher-than-expected inflation rates may lead to concerns about monetary policy tightening, potentially affecting market sentiment.

Q&A:

Q: What was the year-on-year inflation rate in India for June 2026?

A: The year-on-year inflation rate in India for June 2026 was 4.38%.

Q: How did the month-on-month inflation rate perform in June 2026 compared to forecasts?

A: The month-on-month inflation rate in June 2026 was 1.03%, which was higher than the forecast of 0.7%.

Market Sentiment: Neutral - The inflation data may cause mixed reactions among investors as they assess potential impacts on monetary policy.

Foreign Inflows Could Drive India’s Next Equity Rally in H2 2026, Goldman Sachs Says

Importance: Medium ★★

U.S. investment bank Goldman Sachs said foreign investors could become the main driver of India’s next equity rally after selling approximately $30 billion of Indian shares during a three-and-a-half-month period in the first half of 2026.

Foreign funds have recently returned as modest buyers, particularly in financial stocks. Reuters reported that overseas investors purchased about $1.54 billion of Indian banking shares during the second half of June, the strongest inflow in 14 months.

Goldman maintained its June 2027 Nifty 50 target of 26,500. The index closed nearly unchanged at 24,211 on Monday, July 13, implying approximately 9.5% potential upside to the target.

The bank prefers large-cap value stocks, banks, utilities, oil refiners, tourism and defence companies, while remaining cautious about exporters and expensive mid-cap shares.

Possible Market Effect:

Renewed foreign inflows could support the Nifty 50 and banking sector. However, high oil prices, rupee weakness and further earnings downgrades remain important risks.

Market Condition and Sentiment:

  • Nifty 50: Cautiously Buyable
  • Indian Banks: Buyable on pullbacks
  • Utilities, Refiners, Tourism and Defence: Positive
  • Expensive Mid-Caps: Cautiously Sellable
  • Overall Sentiment: Improving but selective

Q: What is Goldman Sachs’ June 2027 target for India’s Nifty 50?

A: Goldman Sachs has maintained a target of 26,500, around 9.5% above Monday’s close.

Q: Which Indian sectors does Goldman Sachs prefer?

A: Banks, utilities, energy refiners, tourism, defence and other domestically focused large-cap companies.

Q: What could weaken India’s equity outlook?

A: Persistently high oil prices, renewed rupee weakness and additional corporate earnings downgrades.

Source: Goldman Sachs, Reuters and Investing.com.

More India news

Commodities

Gold Fell 3% Below $4,000 on Monday, July 13, as Oil and Rate Expectations Surged

Importance: High ★★★

Gold declined sharply on Monday, July 13, 2026, as renewed U.S.-Iran hostilities lifted oil prices, the dollar, and expectations for tighter Federal Reserve policy.

Spot gold fell 3.0% to $3,996.76 per ounce by 1:40 p.m. EDT, its lowest level since July 1. U.S. gold futures settled 2.6% lower at $4,005.70 per ounce.

Higher energy prices revived inflation concerns, while markets priced a 75% probability of a Federal Reserve rate increase in September, reducing demand for non-yielding gold.

Possible Market Effect: Continued strength in oil, the dollar and Treasury yields could pressure gold toward $3,800. Stabilization above $4,000 would be needed to ease the immediate bearish pressure.

Market Condition and Sentiment:

  • Gold: Sellable below $4,000
  • Immediate Resistance: $4,005–$4,050
  • Downside Risk: $3,800
  • Overall Sentiment: Bearish

Q: What was the latest spot-gold price on July 13, 2026?

A: Spot gold was down 3.0% at $3,996.76 per ounce.

Q: Where did U.S. gold futures settle?

A: Gold futures settled 2.6% lower at $4,005.70 per ounce.

Source: Reuters.

Brent and WTI Surged More Than 9% on July 13 as Iran Supply Risks Returned

Importance: High ★★★

Oil prices recorded their strongest rally in weeks on Monday, July 13, 2026, after renewed U.S.-Iran fighting and plans to reinstate a naval blockade raised fears of disruption around the Strait of Hormuz.

Brent crude settled 9.59% higher at $83.30 per barrel, gaining $7.29. U.S. West Texas Intermediate crude rose 9.42% to $78.14, up $6.73. Both benchmarks reached one-month highs.

Possible Market Effect: Continued disruption could support oil and energy stocks while increasing inflation, transportation costs, and pressure on energy-importing economies.

Market Condition and Sentiment:

  • Brent: Bullish / Buyable above $80
  • WTI: Bullish / Buyable above $75
  • Overall Sentiment: Strong geopolitical risk premium

Q: Where did Brent and WTI close on July 13?

A: Brent closed at $83.30, while WTI settled at $78.14 per barrel.

Source: Reuters.

More Commodities news

Russia

Russia's Balance of Trade Surged in May 2026

In a surprising turn of events, Russia's Balance of Trade for May 2026 recorded a surplus of $14.15 billion, significantly exceeding the forecast of $11.7 billion and the previous month's figure of $11.43 billion. This positive outcome reflects a strengthening in Russia's export performance, contributing to a more favorable trade environment. The data was released on Monday, July 13, 2026, at 1:00 PM.

Possible Market Effect: Potentially positive for the Russian currency as a stronger trade balance may bolster investor confidence.

Q&A:

Q: What was Russia's Balance of Trade surplus in May 2026?

A: Russia's Balance of Trade surplus in May 2026 was $14.15 billion.

Q: How does the May 2026 figure compare to the previous month's balance?

A: The May 2026 figure of $14.15 billion is higher than the previous month's balance of $11.43 billion.

Market Sentiment: Neutral - The balance is positive but the low importance rating suggests limited immediate market impact.

More Russia news

UK

UK Retail Sales Growth Slows in June 2026

The BRC Retail Sales Monitor for June 2026 revealed a year-on-year growth of 1.7%, significantly below the forecast of 2.5% and the previous month's growth of 3.4%. The consensus estimate was also higher at 2.9%, indicating a slowdown in consumer spending. This trend may raise concerns about the overall health of the retail sector in the UK as inflationary pressures and changing consumer habits continue to impact sales.

Possible Market Effect: Potentially negative for retail stocks as consumer spending appears to be weakening.

Q&A:

Q: What was the actual growth rate of the BRC Retail Sales Monitor in June 2026?

A: The actual growth rate was 1.7%.

Q: How does the June 2026 retail sales growth compare to the previous month?

A: It decreased from 3.4% in May 2026 to 1.7% in June 2026.

Market Sentiment: Neutral - The slowdown in retail sales growth suggests caution among consumers.

More UK news

China

China's Trade Surplus Surges to $125.8 Billion in June 2026

In a remarkable performance, China's balance of trade recorded a surplus of $125.8 billion in June 2026, significantly surpassing the forecast of $110 billion and the previous month's surplus of $105.43 billion. This strong trade surplus is indicative of robust export activity, which saw year-over-year growth of 27%, up from 19.4% in the previous month. Imports also rose sharply, increasing by 36% compared to 27.4% in May, reflecting strong domestic demand. The consensus forecast for exports was 18.2%, while imports were expected to grow by 24%. These figures highlight China's ongoing economic resilience and its ability to capitalize on global demand.

Possible Market Effect: Positive sentiment towards the Chinese economy, potential strengthening of the yuan.

Q&A:

Q: What was China's balance of trade surplus in June 2026?

A: China's balance of trade surplus in June 2026 was $125.8 billion.

Q: How did China's exports perform year-over-year in June 2026?

A: China's exports increased by 27% year-over-year in June 2026.

Market Sentiment: Buy - Strong trade figures indicate a healthy economy and may attract investment.

More China news