IFC Markets Live Quotes

Market news roundup: Monday, 6 July 2026

62 short market news items, grouped by 11 sections.

Equities

U.S. Stock Futures Rise on Monday as Nasdaq Leads Ahead of Fed Minutes

Importance level: Medium

U.S. stock index futures moved higher in Asian trading on Monday, extending momentum after weekly gains in the holiday-shortened week. Investors continued to reassess artificial intelligence-linked trades, while markets waited for the minutes of the Federal Reserve’s June policy meeting.

Nasdaq 100 Futures outperformed, rising 0.8% to 29,779.75 points by 01:50 ET / 05:50 GMT. S&P 500 Futures added 0.3% to 7,550.25 points, while Dow Jones Futures were nearly flat at 53,199.0 points.

The major U.S. indexes also ended the previous week higher despite choppy trading. The Dow Jones Industrial Average rose about 2% to a record close, marking its fourth consecutive weekly gain, while the S&P 500 and Nasdaq Composite also advanced nearly 2% each.

Possible market effect:

The move shows that risk appetite remains positive, especially in technology and AI-linked sectors. Nasdaq outperformance suggests investors are still willing to buy growth and tech exposure, but the upcoming Fed minutes could affect sentiment if they signal a more cautious or hawkish policy outlook.

Market sentiment:

Nasdaq 100 Futures: Buyable, but watch Fed minutes

S&P 500 Futures: Mildly buyable

Dow Jones Futures: Neutral

USD: Neutral to slightly buyable if Fed minutes sound hawkish

Q: Why did U.S. stock futures move higher on Monday?

A: U.S. stock futures rose as investors extended last week’s positive momentum and reassessed AI-linked trades ahead of the Federal Reserve’s June meeting minutes.

Q: Which U.S. futures index performed the best in Asian trading?

A: Nasdaq 100 Futures performed the best, rising 0.8% to 29,779.75 points.

Q: Is the U.S. stock market sentiment still positive?

A: Yes, the short-term sentiment remains positive, especially for technology and AI-linked stocks, but the Fed minutes remain an important risk event.

Source: Market data cited in the provided report
U.S. Earnings Season Begins as PepsiCo and Delta Prepare to Report Q2 Results

Importance level: Medium

Traders will also focus on the start of the second-quarter earnings season, with PepsiCo (NASDAQ: PEP) and Delta Air Lines (NYSE: DAL) among the first major U.S. companies scheduled to report results.

These reports could give investors an early view of corporate demand, consumer spending, travel activity, profit margins, and pricing power. PepsiCo’s results may offer signals about consumer staples and food-and-beverage demand, while Delta’s earnings may provide insight into travel demand, fuel-cost pressure, and airline profitability.

Possible market effect:

Strong earnings from early reporters could support risk sentiment and help U.S. equities extend recent gains. Weak guidance, margin pressure, or cautious consumer-demand commentary could create short-term pressure, especially on consumer, travel, and cyclical stocks.

Market sentiment:

U.S. equities: Neutral to mildly buyable before earnings

PEP: Neutral, waiting for results

DAL: Neutral, waiting for results

USD: Neutral; stronger risk appetite may slightly reduce safe-haven demand

Q: Which major U.S. companies are among the first to report second-quarter earnings?

A: PepsiCo and Delta Air Lines are among the first major companies expected to report Q2 results.

Q: Why are PepsiCo and Delta earnings important for markets?

A: PepsiCo can show consumer staples demand and pricing power, while Delta can provide signals about travel demand and airline profitability.

Q: Could the start of U.S. earnings season affect stock market sentiment?

A: Yes. Strong results may support risk appetite, while weak guidance or margin pressure could hurt market sentiment.

Source: Market report provided

U.S. Technology Rally Faces AI Valuation Test as Apple Gains Strength

Importance level: Medium

Investors are becoming more cautious about high valuations across the artificial intelligence supply chain, especially after recent volatility in semiconductor shares. While optimism remains strong for software and platform companies that could benefit from broader AI adoption, the market is questioning whether the rally in AI-linked chip stocks can continue at the same pace.

Market participants are also watching whether major technology companies can regain leadership after recent sector rotation. Apple shares have strengthened on optimism around its upcoming iPhone lineup, while weakness in AI-focused semiconductor stocks has raised concerns about the sustainability of this year’s technology-led market rally.

Possible market effect:

The market effect is mixed. Stronger Apple momentum may support large-cap technology sentiment, but continued weakness in semiconductor stocks could pressure the Nasdaq 100 and broader AI-related trades. If investors rotate from expensive chip names into software, platforms, or mega-cap tech, the rally may continue but become more selective.

Market sentiment:

Nasdaq 100: Neutral to mildly buyable, but selective

AI semiconductor stocks: Neutral to slightly sell

AI software/platform stocks: Neutral to buyable

Apple: Mildly buyable while iPhone optimism remains active

Q: Why are investors questioning the U.S. AI rally?

A: Investors are questioning the rally because valuations across the AI supply chain remain high, while recent volatility in semiconductor shares has created doubts about the sustainability of gains.

Q: Is the AI trade still positive for U.S. technology stocks?

A: Yes, but it is becoming more selective. Software and platform companies still have positive sentiment, while AI-focused semiconductor stocks face more valuation pressure.

Q: Why are Apple shares gaining strength?

A: Apple shares have strengthened because of optimism surrounding the company’s upcoming iPhone lineup.

Source: Market report provided

easyJet Shares in Focus After Sunday Takeover Offer Values Airline at £5.23 Billion

Importance level: High

easyJet announced on Sunday that it has agreed in principle to a takeover offer from Castlelake at £6.90 per share, valuing the airline at around £5.23 billion, according to a Reuters report.

This is the fifth and highest offer from the Minneapolis-based private credit firm. Castlelake reportedly lifted its bid from an opening 560 pence to 690 pence per share after first approaching easyJet on May 29. easyJet shares (LON: EZJ) closed Friday at 558.2 pence, leaving the stock at roughly a 20% discount to the offer price.

The two sides have also extended the “put up or shut up” deadline to August 3 at 5 p.m. London time, according to a Bloomberg report citing a joint statement from the companies.

Castlelake has partnered with Mark Breen and Peter Bellew, a former easyJet executive who left the airline in 2022. The firm said it intends to support easyJet’s future growth and fleet modernization programme.

easyJet’s strategic value comes from its modern Airbus A320-family fleet and valuable airport slots in London, Milan, and Geneva. However, the airline remains under financial pressure. Its latest first-half FY2026 results showed EPS of -£0.501, missing analyst expectations of -£0.4345 by 15.3%, as higher jet fuel costs linked to the Iran conflict and softer summer booking trends weighed on margins.

The Haji-Ioannou family, linked to founder Stelios Haji-Ioannou, remains the largest single shareholder with a 15.3% stake, making its position important for any final deal outcome.

Possible market effect:

The offer is strongly supportive for easyJet shares in the short term because the proposed 690 pence bid is well above Friday’s close of 558.2 pence. However, the large discount to the offer price shows that investors may still be pricing in execution risk, shareholder approval risk, or uncertainty around whether a binding deal will be finalized before the August 3 deadline.

Market sentiment:

easyJet / EZJ: Speculative buyable, but with deal-risk caution

UK airline sector: Neutral to slightly positive

European travel stocks: Neutral to slightly positive

GBP impact: Neutral

Q: What is Castlelake’s takeover offer for easyJet?

A: Castlelake’s offer is £6.90 per share, valuing easyJet at around £5.23 billion.

Q: How much upside does the offer imply compared with easyJet’s Friday closing price?

A: easyJet closed Friday at 558.2 pence, which is roughly a 20% discount to the 690 pence offer price.

Q: Is easyJet stock buyable after the takeover offer?

A: easyJet looks speculative buyable from an event-driven perspective, but the trade carries deal-execution risk until a final binding agreement is confirmed.

Source: Reuters; Bloomberg,

Taiwan’s Foxconn revenue jumps in Q2 as AI demand accelerates

Foxconn, formally known as Hon Hai Precision Industry (TW:2317), reported a sharp revenue increase in the April–June quarter, supported by strong demand for artificial intelligence-related products. The world’s largest contract electronics maker said second-quarter revenue surged 39.8% year-on-year to T$2.513 trillion, equal to about $78.71 billion.

The result beat Reuters/LSEG estimates of T$2.372 trillion, showing stronger-than-expected momentum in Foxconn’s cloud and networking business. The company said AI development continued to drive demand for cloud and networking products, while consumer electronics also recorded solid growth.

Foxconn remains a key company in the global technology supply chain. It is the largest server maker for NVIDIA (NASDAQ) and one of the main iPhone assemblers for Apple (NASDAQ). This makes Foxconn’s latest revenue data important not only for Taiwan’s technology sector, but also for the broader AI, semiconductor, and consumer electronics markets.

However, the company also warned that global political and economic volatility could affect its outlook, without giving specific details. Foxconn said AI rack shipments are expected to continue growing in the current quarter, while seasonal trends should also support consumer electronics sales.

Possible market effect:

The data is positive for Foxconn (TW:2317) and supportive for the broader AI hardware supply chain, including sentiment around NVIDIA and AI server demand. Market sentiment toward Foxconn looks bullish-to-neutral after the strong revenue beat, but geopolitical risks may limit aggressive upside. The stock may be considered buyable on pullbacks or confirmation of momentum, while chasing after a sharp rally would carry higher risk.

Q: Why did Taiwan’s Foxconn revenue increase in Q2?

A: Taiwan’s Foxconn revenue increased mainly because of strong demand for AI-related cloud and networking products, along with solid growth in consumer electronics.

Q: Did Foxconn’s Q2 revenue beat market expectations?

A: Yes. Foxconn reported T$2.513 trillion in second-quarter revenue, above the Reuters/LSEG estimate of T$2.372 trillion.

Q: What is the market sentiment for Foxconn after the Q2 revenue report?

A: The sentiment is bullish-to-neutral. Strong AI demand supports the stock, but geopolitical and economic volatility may keep investors cautious.

Source: Foxconn company statement; Reuters/LSEG estimates.

Japanese Defense Stocks Surge on Monday, July 6, as Tokyo Plans New Defense Cooperation Bureau

Importance level: High

Japanese defense-related stocks climbed sharply on Monday, July 6, after Yomiuri reported that Japan’s government is planning to establish a new bureau within the Defense Ministry to strengthen international defense cooperation and support defense equipment exports.

According to the report, the government and ruling coalition have started coordinating plans for a bureau focused on international cooperation and exchanges with allied and like-minded countries. The move comes as Japan seeks to strengthen its defense capabilities amid a more difficult regional security environment.

The proposal is expected to be included in the government’s annual economic and fiscal policy guidelines later this month. If approved, the government plans to submit legislation to amend the Ministry of Defense Establishment Law during next year’s ordinary Diet session. Yomiuri said this would mark the ministry’s first organizational expansion since 2007.

Defense stocks reacted strongly. Mitsubishi Heavy Industries (TYO: 7011) jumped nearly 7% by 03:38 GMT. IHI Corp (TYO: 7013) climbed 5%, while Kawasaki Heavy Industries (TYO: 7012) advanced 7%. Tokyo Keiki (TYO: 7721) surged more than 10%, and NEC Corp (TYO: 6701) gained 4%.

The new bureau would reportedly separate international cooperation responsibilities from the Defense Policy Bureau, allowing the ministry to better manage expanding defense ties with partners in Southeast Asia and Europe.

Possible market effect:

This is positive for Japan’s defense, aerospace, shipbuilding, electronics, and security-technology sectors. The report supports expectations of stronger government backing for defense exports and international defense cooperation. However, after sharp one-day gains, some stocks may face short-term profit-taking.

Market sentiment:

Japanese defense stocks: Buyable, but short-term overheated

Mitsubishi Heavy Industries: Buyable on defense momentum

Kawasaki Heavy Industries: Buyable, but watch volatility

Tokyo Keiki: Speculative buyable after strong surge

Japanese yen: Neutral

Q: Why did Japanese defense stocks rise on Monday, July 6?

A: Japanese defense stocks rose after Yomiuri reported that Japan plans to create a new Defense Ministry bureau to expand international defense cooperation and support defense equipment exports.

Q: Which Japanese defense stocks gained the most?

A: Tokyo Keiki surged more than 10%, while Mitsubishi Heavy Industries and Kawasaki Heavy Industries each gained around 7%.

Q: Is the Japanese defense sector currently buyable?

A: The sector is buyable from a policy-momentum perspective, but short-term traders should watch for profit-taking after the sharp rally.

Source: Yomiuri; Tokyo market data

Saudi Aramco Edges Lower on Sunday as OPEC+ Quota Increase Adds Oil-Price Pressure

Importance level: Medium

Saudi Aramco (2222.SR) edged lower on Sunday on the Tadawul, trading at 26.04 SAR as the latest OPEC+ quota increase added to near-term pressure on oil prices.

The stock remained near the middle of its 52-week range of 23.04 to 27.96 SAR, showing that investors are not pricing in extreme weakness, but are still cautious as the supply outlook becomes heavier.

As the world’s largest oil exporter, Saudi Aramco is one of the clearest market indicators of how investors view OPEC+ pricing strategy, oil supply expectations, and Saudi energy-market sentiment.

Possible market effect:

The move is slightly negative for Saudi energy sentiment. If higher OPEC+ quotas continue to pressure crude prices, Aramco could face more valuation pressure. However, the stock’s position near the middle of its 52-week range suggests the market is still balanced rather than aggressively bearish.

Market sentiment:

Saudi Aramco: Neutral to slightly sell

Tadawul energy sector: Neutral to slightly negative

Brent / WTI crude oil: Slightly sell

Saudi equities: Neutral

Q: What was Saudi Aramco’s latest trading price on Sunday?

A: Saudi Aramco traded at 26.04 SAR on the Tadawul.

Q: Why did Saudi Aramco edge lower?

A: The stock slipped as the new OPEC+ quota increase added to near-term oil-price headwinds.

Q: Is Saudi Aramco currently buyable or sellable?

A: Saudi Aramco is neutral to slightly sell in the short term, mainly because weaker oil-price expectations may pressure energy-sector sentiment.

Source: Tadawul market data

Asian Chipmakers Recover by Monday, July 6 Close Despite Profit-Taking Pressure

Importance level: Medium

Asian technology and chip-related shares faced profit-taking on Monday, July 6, after last week’s rebound, but many chipmakers managed to recover and close higher by the end of the session.

Broader regional equity performance was mixed. South Korea’s KOSPI fell 3.2%, while Japan’s Nikkei 225 lost 1.3%, showing that investors remained cautious toward technology-heavy markets. In mainland China, the CSI 300 and Shanghai Composite both eased 0.6%, suggesting risk appetite toward tech shares stayed limited despite improving global sentiment.

Elsewhere in Asia, market performance was stronger. Hong Kong’s Hang Seng rose 1.1%, Indonesia’s Jakarta Stock Exchange Composite Index added 0.8%, and Australia’s S&P/ASX 200 was little changed.

Investors will also watch Taiwan’s June trade figures for signs that AI-related demand continues to support technology exports.

Possible market effect:

The market effect is mixed. Profit-taking in chipmakers shows investors are still sensitive to valuation risk after the recent rebound, but late-session recovery in many chip names suggests AI-linked demand remains a key support. Taiwan’s trade data could become important for confirming whether AI export momentum is still strong.

Market sentiment:

Asian chipmakers: Neutral to slightly buyable after recovery

KOSPI: Slightly sell

Nikkei 225: Neutral to slightly sell

Hang Seng: Slightly buyable

CSI 300 / Shanghai Composite: Neutral to slightly sell

ASX 200: Neutral

Q: Why did Asian chipmakers face pressure on Monday, July 6?

A: Asian chipmakers faced profit-taking after last week’s rebound, as investors remained cautious toward technology valuations.

Q: Did Asian chipmakers stay weak by the close?

A: No. Although profit-taking hit the sector earlier, many chipmakers recovered and closed higher by the end of the day.

Q: Why are Taiwan’s June trade figures important for technology markets?

A: Taiwan’s trade data is important because it can show whether AI-related demand is still supporting technology exports.

Source: Asian market data

European Stocks Open Near Record Levels on Monday, July 6, as EasyJet Jumps Nearly 10%

Importance level: Medium

European stocks opened near record levels on Monday, July 6, as the STOXX 600 stayed close to historic highs following last week’s strong rally.

The recent momentum has been supported by a broad-based market rotation, as signs of cooling inflation and a softer U.S. labor market renewed optimism that global interest-rate pressure may be easing.

Major European indexes were little changed in early trade. Germany’s DAX, France’s CAC 40, and London’s FTSE 100 all traded flat, suggesting investors were consolidating gains after last week’s strong performance.

European bourses posted a strong rally last week, with the STOXX 600 and Euro Stoxx 50 reaching fresh historic peaks. Germany’s DAX led the advance, helped by strong rebounds in major stocks such as Siemens and broader investor appetite beyond the technology sector.

Among individual names, easyJet jumped nearly 10% after agreeing to Castlelake’s takeover proposal, making it one of the key movers in European trading.

Possible market effect:

The market effect is cautiously positive. European equities remain supported by easing rate-pressure expectations and broader sector rotation, but flat moves in the DAX, CAC 40, and FTSE 100 suggest investors may be waiting for fresh catalysts after last week’s record highs. easyJet’s sharp move could also support sentiment in travel and airline stocks.

Market sentiment:

STOXX 600: Neutral to slightly buyable near record levels

Euro Stoxx 50: Neutral to slightly buyable

DAX: Neutral after recent strength

CAC 40: Neutral

FTSE 100: Neutral

easyJet: Speculative buyable after takeover news

Q: Why did European stocks open near record levels on Monday, July 6?

A: European stocks remained supported by last week’s rally, cooling inflation signals, softer U.S. labor-market data, and hopes that global interest-rate pressure may ease.

Q: How did major European indexes trade at the open?

A: Germany’s DAX, France’s CAC 40, and London’s FTSE 100 were all flat.

Q: Why did easyJet shares jump nearly 10%?

A: easyJet shares rose nearly 10% after the company agreed to Castlelake’s takeover proposal.

Source: European market data; easyJet takeover announcement

South Korea’s Samsung Flags 19-Fold Q2 Profit Surge, but Shares Drop on AI-Chip Cycle Concerns

Importance level: High

Samsung Electronics said on Tuesday that its second-quarter operating profit likely jumped 19-fold from a year earlier, driven by surging memory-chip prices and strong AI-related demand.

The world’s largest memory chipmaker estimated April–June operating profit at 89.4 trillion won / $58.44 billion, beating the LSEG SmartEstimate of 87.3 trillion won and far above the 4.7 trillion won reported a year earlier. Revenue is expected to rise 129% YoY to 171 trillion won.

However, the strong earnings update failed to calm investor concerns about the durability of the AI-driven chip rally. Samsung shares fell as much as 7.9% in morning trade, while SK Hynix dropped as much as 7.3%, dragging South Korea’s KOSPI down 6%.

Analysts said the market had already priced in strong results after Samsung’s pre-results rally. Some investors had expected operating profit to exceed 90 trillion won, especially after record memory prices. Samsung also booked provisions for large worker bonuses linked to semiconductor operating profit; analysts said without those provisions, operating profit would likely have exceeded 100 trillion won.

Memory prices rose sharply during the quarter as AI demand expanded beyond HBM into conventional DRAM and NAND. Citi Research said DRAM and NAND average selling prices rose 44% and 53% QoQ, respectively, in Q2. Analysts also noted that higher HBM production has tightened supply of conventional memory used in smartphones, PCs, and enterprise servers.

The main risk is whether AI infrastructure spending can continue at the current pace. Investors remain concerned that delays in U.S. data-center construction, power shortages, labor constraints, or weaker returns on AI investment could slow chip demand. Goldman Sachs expects AI-related capital expenditure by Meta, Microsoft, Amazon, and Alphabet to reach $5.3 trillion between fiscal 2025 and 2030, suggesting long-term demand remains strong, even if short-term positioning is crowded.

Samsung will release detailed results on July 30, including earnings breakdowns by business division.

Possible market effect:

The data is fundamentally positive for Samsung’s memory business, but the market reaction is negative because expectations were already very high. The selloff shows investors are more focused on whether the AI memory boom is sustainable than on the headline earnings beat. If memory prices remain strong and AI capex continues, the pullback may become a selective buying opportunity; however, short-term volatility in Samsung, SK Hynix, and KOSPI remains elevated.

Market sentiment:

Samsung Electronics: Neutral to slightly buyable after the selloff, but valuation-sensitive

SK Hynix: Neutral; vulnerable to AI-cycle profit-taking

South Korean chip sector: Selectively buyable, but volatile

KOSPI: Short-term sell pressure

AI memory/HBM theme: Structurally positive, but crowded

Q: How much operating profit did Samsung estimate for Q2?

A: Samsung estimated 89.4 trillion won / $58.44 billion in second-quarter operating profit, beating the 87.3 trillion won LSEG SmartEstimate.

Q: Why did Samsung shares fall despite strong earnings?

A: Samsung shares fell because strong earnings had already been priced in, while investors remained concerned about the sustainability of the AI-driven memory-chip boom.

Q: Is Samsung stock buyable after the selloff?

A: Samsung is neutral to slightly buyable for investors focused on memory-price strength and AI demand, but short-term traders should be cautious because valuation risk and AI-cycle concerns remain high.

Source: Samsung regulatory filing; LSEG; Citi Research; Goldman Sachs; Reuters

South Korea’s LG Energy Solution warns Q2 profit fell 77% as EV demand stays weak

LG Energy Solution (KS:373220) forecast a sharp decline in second-quarter operating profit, as weak global electric-vehicle demand continued to pressure the battery maker’s earnings.

The South Korean company estimated April–June operating profit at 113.3 billion won, down 77% from 492.1 billion won in the same period a year earlier. However, the result still showed a recovery from the 207.8 billion won operating loss recorded in the January–March quarter.

Revenue showed a stronger performance. LG Energy Solution estimated second-quarter revenue at 7.56 trillion won, up 24.8% year-on-year and 15.3% quarter-on-quarter, according to preliminary results.

The data suggests that while sales improved, profitability remains under pressure due to weak EV demand, pricing pressure, and margin challenges across the battery sector. The company noted that the preliminary results are subject to external audit and may differ from final earnings.

Possible market effect:

The report is mixed but cautious for LG Energy Solution (KS:373220). The sharp annual profit decline is negative for sentiment, but the recovery from a first-quarter operating loss and stronger revenue growth may limit downside pressure. Overall market sentiment looks neutral-to-slightly bearish. The stock does not look strongly buyable yet unless investors see clearer signs of EV demand recovery and margin improvement. For now, it is more suitable for neutral positioning or selective buying only after confirmation of earnings stabilization.

Q: Why did South Korea’s LG Energy Solution expect lower Q2 operating profit?

A: LG Energy Solution expected lower Q2 operating profit mainly because sluggish global electric-vehicle demand continued to weigh on battery-sector earnings.

Q: Did LG Energy Solution improve compared with the previous quarter?

A: Yes. Although operating profit fell sharply from a year earlier, the company recovered from a 207.8 billion won operating loss in the first quarter to an estimated 113.3 billion won operating profit in the second quarter.

Q: Is LG Energy Solution stock buyable after the Q2 preliminary results?

A: The sentiment is neutral-to-slightly bearish. Stronger revenue and a return to operating profit are positive, but the 77% annual profit drop keeps the stock under pressure until EV demand and margins show clearer recovery.

Source: LG Energy Solution preliminary earnings results.

Meta Rises 2.2% as SemiAnalysis Says 2027 AI Capex Could Be “Shockingly High”

Importance level: High

Meta Platforms (NASDAQ: META) traded 2.2% higher after SemiAnalysis argued that the company’s AI compute buildout is still far from peaking, despite recent fears that Meta may monetize excess AI computing capacity through a cloud business.

Meta has contracted more than 5GW of datacenter capacity across cloud and colocation in the first half of 2026 alone. SemiAnalysis said Meta has signed nearly 10GW of deals since early 2024, with much of its future capacity now coming through third-party providers. The firm expects this to continue and said Meta could become a major source of remaining performance obligation growth for companies such as CoreWeave (NASDAQ: CRWV) and Nebius (NASDAQ: NBIS).

The report helped reverse part of the negative reaction that hit neocloud stocks on July 1, when Bloomberg reported that Meta planned to launch a cloud business using excess AI capacity. CoreWeave and Nebius both fell more than 6% that day. CoreWeave later traded 4.8% higher, suggesting investors are reassessing whether Meta is a competitor to neocloud providers or a major future customer.

SemiAnalysis highlighted four possible drivers of Meta’s continued compute demand: Meta Superintelligence Labs, a planned 10x scaling of Meta’s advertising recommendation systems, a potential private Claude compute arrangement with Anthropic, and flexible “SpaceX-type” on-demand compute deals for external customers. The firm estimated Meta could generate more than $10 billion per year by allocating just 200MW of capacity to external customers at pricing comparable to about $50 billion per gigawatt annually.

SemiAnalysis also pointed to Oracle (NYSE: ORCL) as a company with strong compute positioning but said it had “failed to capitalize” on similar opportunities. Oracle shares were trading at $143.33, down roughly 38% over the past year.

Meta’s next key test will be its Q2 2026 earnings on July 29, where consensus expects EPS of $7.17 on revenue of $60.19 billion. Investors will focus on updated capex guidance, cloud monetization plans, and any formal comment on a possible Anthropic partnership. CoreWeave’s expected Q2 2026 earnings on August 18 will also be watched for signs that Meta’s procurement acceleration is translating into real contract wins for neocloud providers.

Possible market effect:

This is positive for the AI infrastructure theme, especially if Meta’s rising capex becomes a demand source for neocloud providers instead of a competitive threat. However, it may also increase investor concern about Meta’s spending intensity, especially after the stock previously sold off despite strong Q1 earnings because of elevated capex guidance.

Market sentiment:

META: Neutral to buyable, but capex-sensitive

CRWV: Buyable if Meta demand supports backlog growth

NBIS: Neutral to slightly buyable

ORCL: Neutral to slightly negative after weak execution concerns

AI infrastructure stocks: Selectively buyable, but valuation-sensitive

Q: Why did Meta shares rise 2.2%?

A: Meta rose after SemiAnalysis argued that the company’s AI compute buildout is likely to accelerate rather than slow, with 2027 capex potentially reaching very high levels.

Q: Why did CoreWeave recover 4.8%?

A: CoreWeave recovered as investors reconsidered the idea that Meta’s cloud strategy may support neocloud demand instead of directly cannibalizing it.

Q: What is the next major event for Meta investors?

A: Meta’s Q2 2026 earnings on July 29 will be the next major test, especially for capex guidance, cloud monetization strategy, and any Anthropic-related commentary.

Q: Is Meta stock buyable after this update?

A: Meta is neutral to buyable, but investors should watch capex risk. The long-term AI infrastructure story is supportive, while very high spending could keep valuation pressure active.

Source: SemiAnalysis; Bloomberg; company earnings calendar

More Equities news

Europe

German Factory Orders Rebound in May, Beating Expectations

Importance level: Medium

German Factory Orders MoM rose 1.9% in May, beating market expectations of 1.1% and recovering strongly from the previous 3.2% decline.

The rebound suggests that demand in Germany’s industrial sector improved after a weak previous reading. This is a positive signal for the manufacturing outlook, although one monthly recovery is not enough to confirm a full industrial turnaround.

Possible market effect:

The data is mildly positive for the euro and German industrial sentiment. However, the impact may remain limited unless upcoming production, PMI, and export data confirm broader recovery.

Market sentiment:

EUR: Neutral to slightly buyable

German equities / industrial stocks: Slightly positive

Q: What was Germany’s Factory Orders data in May?

A: German Factory Orders rose 1.9% MoM in May, above expectations of 1.1%.

Q: Is the German factory orders rebound positive for the euro?

A: Yes, it is mildly positive for the euro, but the market may wait for more confirmation from other German industrial data.

Source: Destatis

Swiss June Unemployment Gives Mixed Signal as Unadjusted Rate Falls but Adjusted Rate Rises

Importance level: Low

Switzerland’s June unemployment data delivered a mixed signal. The Unemployment Rate n.s.a. fell to 2.9%, better than expectations of 3.1% and below the previous 3.1%.

However, the seasonally adjusted unemployment rate rose to 3.1%, higher than expectations of 3.0% and above the previous 3.0%. This suggests that while the raw unemployment figure improved, the adjusted labor-market trend showed slight weakening.

Possible market effect:

The data is mixed for the Swiss franc. The lower unadjusted unemployment rate is supportive, but the rise in the seasonally adjusted rate reduces the positive impact. Because the importance level is low, the direct market reaction may remain limited.

Market sentiment:

CHF: Neutral

Swiss equities: Neutral

Q: What was Switzerland’s Unemployment Rate n.s.a. in June?

A: Switzerland’s Unemployment Rate n.s.a. fell to 2.9%, better than expectations of 3.1%.

Q: Why is the Swiss unemployment report mixed?

A: Because the unadjusted rate improved to 2.9%, while the seasonally adjusted rate worsened to 3.1%.

Q: Is this data positive or negative for the Swiss franc?

A: The data is mostly neutral for CHF, because the signals are mixed and the market importance is low.

Source: SECO

Eurozone Construction PMI Weakens in June as Sector Remains in Contraction

Importance level: Low

The HCOB Eurozone Construction PMI fell to 42.8 in June, down from the previous reading of 43.7.

The data shows that construction activity across the Eurozone remained firmly in contraction territory. A PMI reading below 50.0 signals falling activity, and the latest decline suggests that high financing costs, weak real estate demand, and cautious investment conditions are still weighing on the sector.

Possible market effect:

This is mildly negative for Eurozone construction and real estate sentiment. However, because the data has low market importance, the direct impact on the euro may remain limited.

Market sentiment:

EUR: Neutral to slightly sell

Eurozone construction stocks: Slightly negative

Q: What was the Eurozone Construction PMI in June?

A: The HCOB Eurozone Construction PMI fell to 42.8 in June, down from 43.7.

Q: Is the Eurozone construction sector expanding or contracting?

A: It is contracting, because the PMI remains below 50.0.

Source: HCOB / S&P Global

France Construction PMI Falls Further in June, Signaling Deeper Weakness

Importance level: Low

The HCOB France Construction PMI declined to 38.2 in June, down from the previous reading of 39.6.

France’s construction sector remained under heavy pressure, with the PMI far below the 50.0 expansion line. The decline points to a deeper contraction in activity and suggests that demand conditions in the French construction market remain weak.

Possible market effect:

The data is mildly negative for French construction, real estate, and cyclical equities. The impact on the euro is likely limited unless similar weakness appears across broader Eurozone indicators.

Market sentiment:

EUR: Neutral to slightly sell

French construction stocks: Slightly negative

CAC 40: Neutral

Q: What was France’s Construction PMI in June?

A: France’s HCOB Construction PMI fell to 38.2 in June from 39.6.

Q: What does France’s June Construction PMI show?

A: It shows that France’s construction sector remained in deep contraction, with activity far below the 50.0 expansion threshold.

Source: HCOB / S&P Global

German Construction PMI Improves in June but Stays Below Growth Line

Importance level: Low

The HCOB Germany Construction PMI rose to 44.8 in June, up from the previous reading of 42.4.

The improvement suggests that the pace of contraction in Germany’s construction sector eased in June. However, the index remains below the 50.0 threshold, meaning construction activity is still shrinking.

Possible market effect:

The data is mildly positive compared with the previous month, but not strong enough to signal a real recovery. It may slightly support German construction sentiment, while the broader impact on the euro and DAX is likely limited.

Market sentiment:

EUR: Neutral

German construction stocks: Neutral to slightly positive

DAX: Neutral

Q: What was Germany’s Construction PMI in June?

A: Germany’s HCOB Construction PMI rose to 44.8 in June from 42.4.

Q: Does Germany’s Construction PMI show recovery?

A: It shows improvement, but not full recovery. The index is still below 50.0, which means the sector remains in contraction.

Source: HCOB / S&P Global

Italy Construction PMI Drops in June as Sector Moves Deeper into Contraction

Importance level: Low

The HCOB Italy Construction PMI fell to 45.4 in June, down sharply from the previous reading of 49.4.

The decline shows that Italy’s construction sector weakened further and moved deeper into contraction territory. The previous reading was close to the 50.0 neutral line, but the latest data signals a clearer deterioration in activity.

Possible market effect:

This is mildly negative for Italian construction and real estate sentiment. It may weigh on construction-related equities, although the direct impact on the euro should remain limited because the data has low market importance.

Market sentiment:

EUR: Neutral to slightly sell

Italian construction stocks: Slightly negative

FTSE MIB: Neutral to slightly negative

Q: What was Italy’s Construction PMI in June?

A: Italy’s HCOB Construction PMI fell to 45.4 in June from 49.4.

Q: Why is Italy’s June Construction PMI negative?

A: Because the index moved further below 50.0, showing that construction activity weakened more clearly.

Source: HCOB / S&P Global

Eurozone Investor Confidence Improves Sharply in July but Remains Negative

Importance level: Low

The Eurozone’s Sentix Investor Confidence improved sharply to -3.1 in July, beating expectations of -14.5 and recovering from the previous reading of -13.4.

Although the index remains below zero, the great improvement suggests investors became notably less pessimistic about the Eurozone outlook. This may reflect easing recession concerns, better risk appetite, or expectations of more supportive financial conditions.

Possible market effect:

The data is mildly positive for the euro and Eurozone equities because it shows a clear improvement in investor sentiment. However, since the reading remains negative, the signal is supportive but not strong enough to confirm a full confidence recovery.

Market sentiment:

EUR: Neutral to slightly buyable

Eurozone equities: Slightly positive

DAX / CAC 40: Neutral to slightly positive

Q: What was the Eurozone Sentix Investor Confidence reading in July?

A: Eurozone Sentix Investor Confidence improved to -3.1, better than expectations of -14.5.

Q: Is Eurozone investor confidence now positive?

A: No. It improved sharply, but the index is still negative at -3.1.

Source: Sentix

Eurozone Investor Confidence Improves Sharply in July but Remains Negative,

Importance level: Low

The Eurozone’s Sentix Investor Confidence improved sharply to -3.1 in July, much better than the forecast of -14.5 and the previous reading of -13.4.

The data shows that investors became significantly less pessimistic about the Eurozone outlook. However, the index remains below zero, meaning confidence has improved but has not yet returned to positive territory.

Possible market effect:

This is mildly positive for the euro and Eurozone equities, as it shows a clear improvement in sentiment. Still, the negative reading suggests investors remain cautious.

Market sentiment:

EUR: Neutral to slightly buyable

Eurozone equities: Slightly positive

Q: What was the Eurozone Sentix Investor Confidence reading in July?

A: It improved to -3.1, better than the forecast of -14.5 and the previous -13.4.

Q: Is Eurozone investor confidence now positive?

A: No. It improved strongly, but the reading is still negative at -3.1.

Source: Sentix

Eurozone Producer Inflation Stays Firm in May as Annual PPI Rises to 5.9%

Importance level: Low

Eurozone PPI MoM rose 0.2% in May, matching market expectations but slowing from the previous 0.7% increase.

On an annual basis, PPI YoY climbed to 5.9%, above the forecast of 5.7% and higher than the previous 5.0%. This shows that producer-price pressure remained elevated despite softer monthly momentum.

Possible market effect:

The data is mildly supportive for the euro because stronger producer inflation can keep the European Central Bank cautious. However, it may be negative for equities if higher input costs pressure corporate margins.

Market sentiment:

EUR: Neutral to slightly buyable

Eurozone equities: Neutral to slightly negative

European bonds: Slightly negative if inflation concerns rise

Q: What was Eurozone PPI in May?

A: Eurozone PPI MoM rose 0.2%, while PPI YoY increased to 5.9%.

Q: Why is Eurozone PPI important for markets?

A: PPI matters because higher producer prices can feed into consumer inflation and influence European Central Bank policy expectations.

Source: Eurostat

Eurozone Retail Sales Improve in May as Consumer Demand Shows Resilience

Importance level: Low

Eurozone Retail Sales YoY rose 1.6% in May, slightly above the forecast of 1.5% and stronger than the previous 0.9% increase.

On a monthly basis, Retail Sales MoM increased 0.2%, matching expectations and improving from the previous 0.3% decline. The data suggests consumer demand in the Eurozone remained resilient despite pressure from prices and cautious household spending.

Possible market effect:

This is mildly positive for Eurozone equities and the euro, especially consumer-related sectors. However, because the importance level is low, the market reaction may remain limited.

Market sentiment:

EUR: Neutral to slightly buyable

Eurozone consumer stocks: Slightly positive

Eurozone equities: Neutral to slightly positive

Q: What was Eurozone retail sales growth in May?

A: Eurozone retail sales rose 1.6% YoY and 0.2% MoM in May.

Q: Is Eurozone retail sales data positive for the euro?

A: It is mildly positive for the euro, because it shows better consumer demand, but the direct market impact is limited.

Source: Eurostat

French BTF Auction Yields Ease Across 3-, 6- and 12-Month Bills

Importance level: Low

French short-term government bill yields eased in the latest BTF auctions, showing slightly lower short-term funding costs.

The 12-month BTF yield fell to 2.548%, down from 2.579%. The 3-month BTF yield edged down to 2.374%, compared with 2.377% previously. The 6-month BTF yield declined to 2.455%, from 2.483%.

Possible market effect:

Lower short-term auction yields are mildly supportive for French fixed-income sentiment. However, because the moves are small and the importance level is low, the direct effect on the euro and French equities is likely limited.

Market sentiment:

EUR: Neutral

French bonds: Neutral to slightly positive

CAC 40: Neutral

Q: What happened to French BTF auction yields?

A: French 3-month, 6-month, and 12-month BTF yields all moved slightly lower.

Q: Is this positive for the euro?

A: The effect on the euro is mostly neutral because the yield changes were small and the data has low market importance.

Source: Agence France Trésor

German Bund Yield Holds Near Two-Week High as ECB Speakers and Eurozone Data Come Into Focus

Importance level: Medium

Germany’s 10-year Bund yield, the benchmark for the Eurozone bond market, eased slightly from its two-week peak of 2.95% and hovered around 2.91% on Monday.

The shorter-dated, policy-sensitive 2-year German yield remained steady, suggesting a calm start to an important week for European interest-rate expectations.

Investors are focused on a busy lineup of European Central Bank speakers, including President Christine Lagarde and Chief Economist Philip Lane. Markets will also watch key Eurozone indicators this week, including retail sales, producer prices, and German industrial output for May, to judge whether the bloc’s manufacturing sector is beginning to stabilize.

Possible market effect:

The market effect is neutral to slightly supportive for European bonds, as Bund yields eased from recent highs. However, strong Eurozone data or hawkish ECB commentary could push yields back upward. For the euro, the impact depends on whether incoming data supports a stronger growth outlook or reinforces inflation concerns.

Market sentiment:

German Bunds: Neutral to slightly buyable

EUR: Neutral

European equities: Neutral to slightly positive if yields remain contained

DAX: Neutral, waiting for German industrial output

Q: What happened to Germany’s 10-year Bund yield on Monday?

A: Germany’s 10-year Bund yield moved slightly lower from its two-week peak of 2.95% and hovered around 2.91%.

Q: Why are ECB speakers important this week?

A: ECB speakers are important because their comments may guide expectations for future Eurozone interest-rate policy.

Q: Are German Bunds currently buyable or sellable?

A: German Bunds are neutral to slightly buyable while yields ease from recent highs, but hawkish ECB comments could limit gains.

Source: German bond market data; European Central Bank

More Europe news

Commodities

Gold Falls on Monday as Dollar Recovery Pressures Precious Metals

Importance level: Medium

Gold prices reversed early gains and traded lower on Monday, as the U.S. dollar recovered part of last week’s steep losses amid continued uncertainty over U.S. interest rates.

The yellow metal lost momentum after rebounding from eight-month lows last week. Meanwhile, the dollar moved higher from near two-week lows after a sharp decline in the previous week.

Spot gold fell 0.6% to $4,151.66 per ounce by 01:16 ET / 05:16 GMT, while gold futures declined 0.7% to $4,167.29 per ounce.

Despite Monday’s pullback, gold posted its first weekly gain since mid-May last week, rising more than 2%. The rally followed a weak U.S. nonfarm payrolls report on Thursday, which reduced expectations that the Federal Reserve would have enough room to raise interest rates this year.

For gold, the interest-rate outlook remains critical. Higher rates are usually negative for gold because they increase the opportunity cost of holding non-yielding assets compared with government debt. This has been a major pressure point for gold this year and pushed the metal well below its January record highs.

Other precious metals also retreated on Monday after strong gains last week. Spot silver fell 1.1% to $61.7430 per ounce, while spot platinum dropped 0.4% to $1,635.31 per ounce.

Possible market effect:

The short-term market effect is negative for gold and precious metals, mainly because of the dollar recovery. However, if U.S. labor-market weakness continues and rate-hike expectations decline further, gold could regain support. Traders should watch the dollar, Treasury yields, inflation data, and upcoming Fed signals.

Market sentiment:

Gold: Neutral to slightly sell in the short term

Silver: Slightly sell

Platinum: Neutral to slightly sell

USD: Neutral to slightly buyable if yields stay firm

Q: Why did gold prices fall on Monday?

A: Gold fell because the U.S. dollar recovered part of last week’s losses, while uncertainty over U.S. interest rates remained high.

Q: Did gold still record a positive weekly performance?

A: Yes. Gold rose more than 2% last week, marking its first weekly gain since mid-May.

Q: Is gold currently buyable or sellable?

A: In the short term, gold looks neutral to slightly sell, mainly because of dollar recovery. A renewed decline in yields or weaker U.S. data could make gold buyable again.

Source: Market report provided

Oil Prices Stay Subdued on Monday, July 6, as OPEC+ Supply and Gulf Exports Pressure Crude

Importance level: Medium

Oil prices were subdued on Monday, July 6, as expectations for higher OPEC+ output and recovering Gulf crude exports offset lingering geopolitical uncertainty around the Strait of Hormuz.

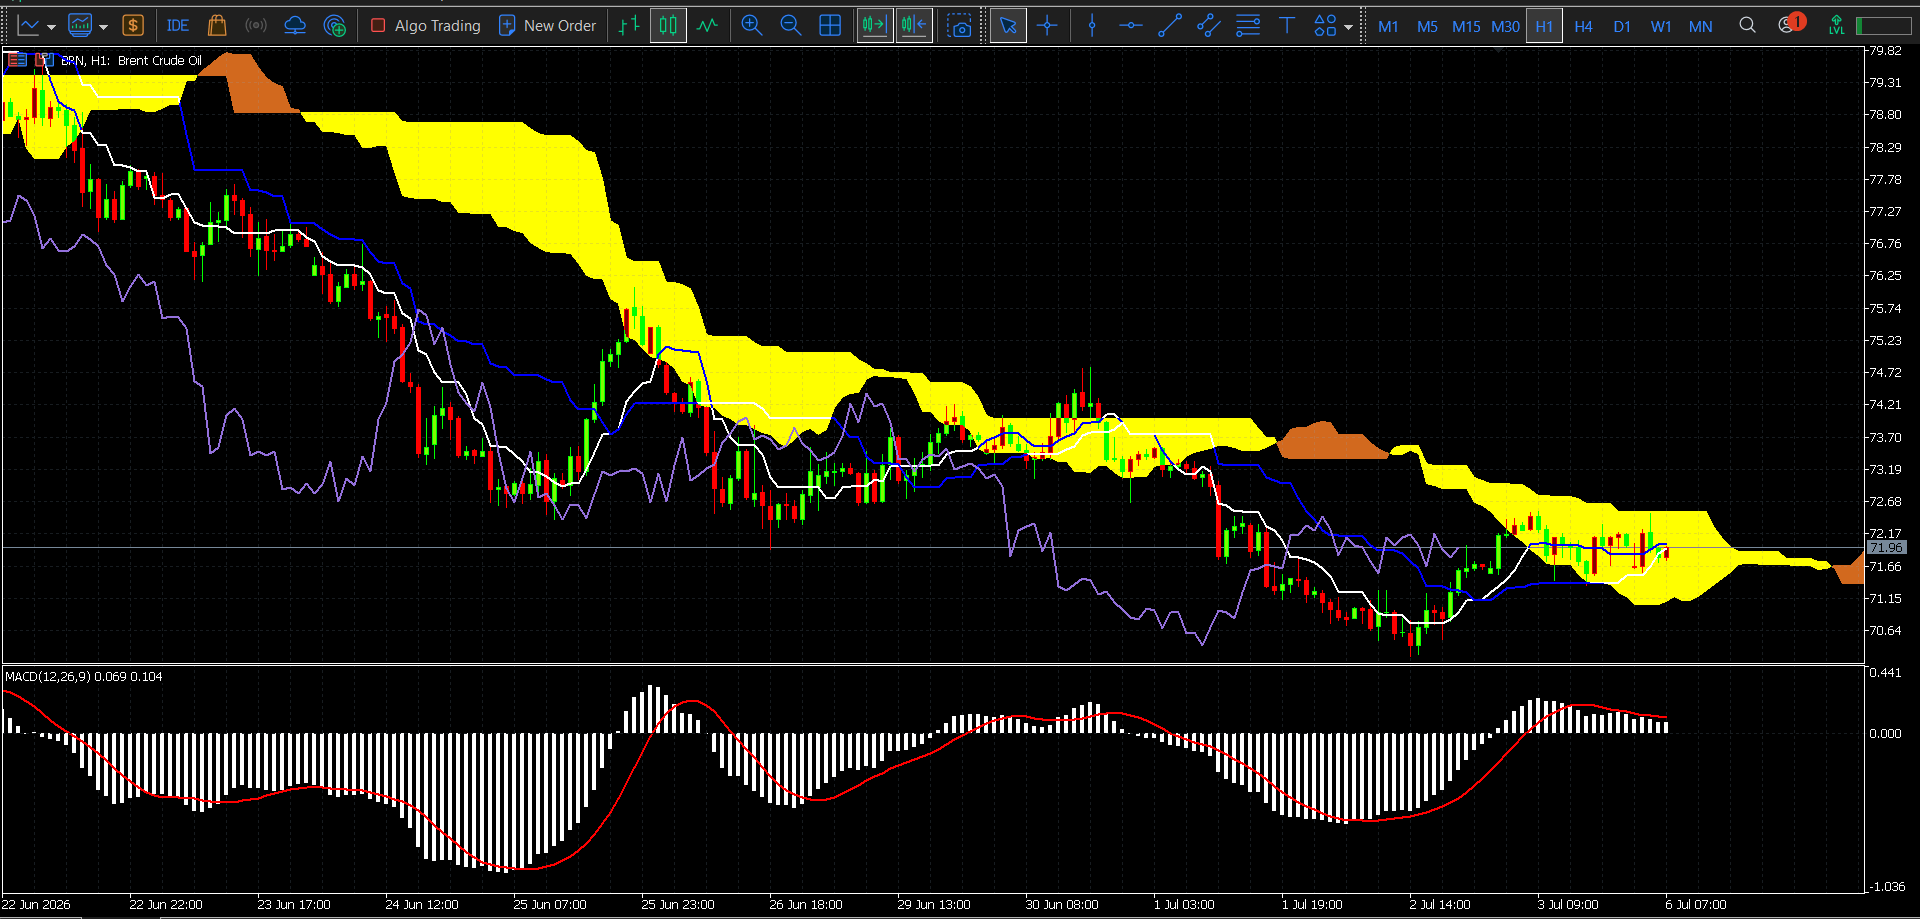
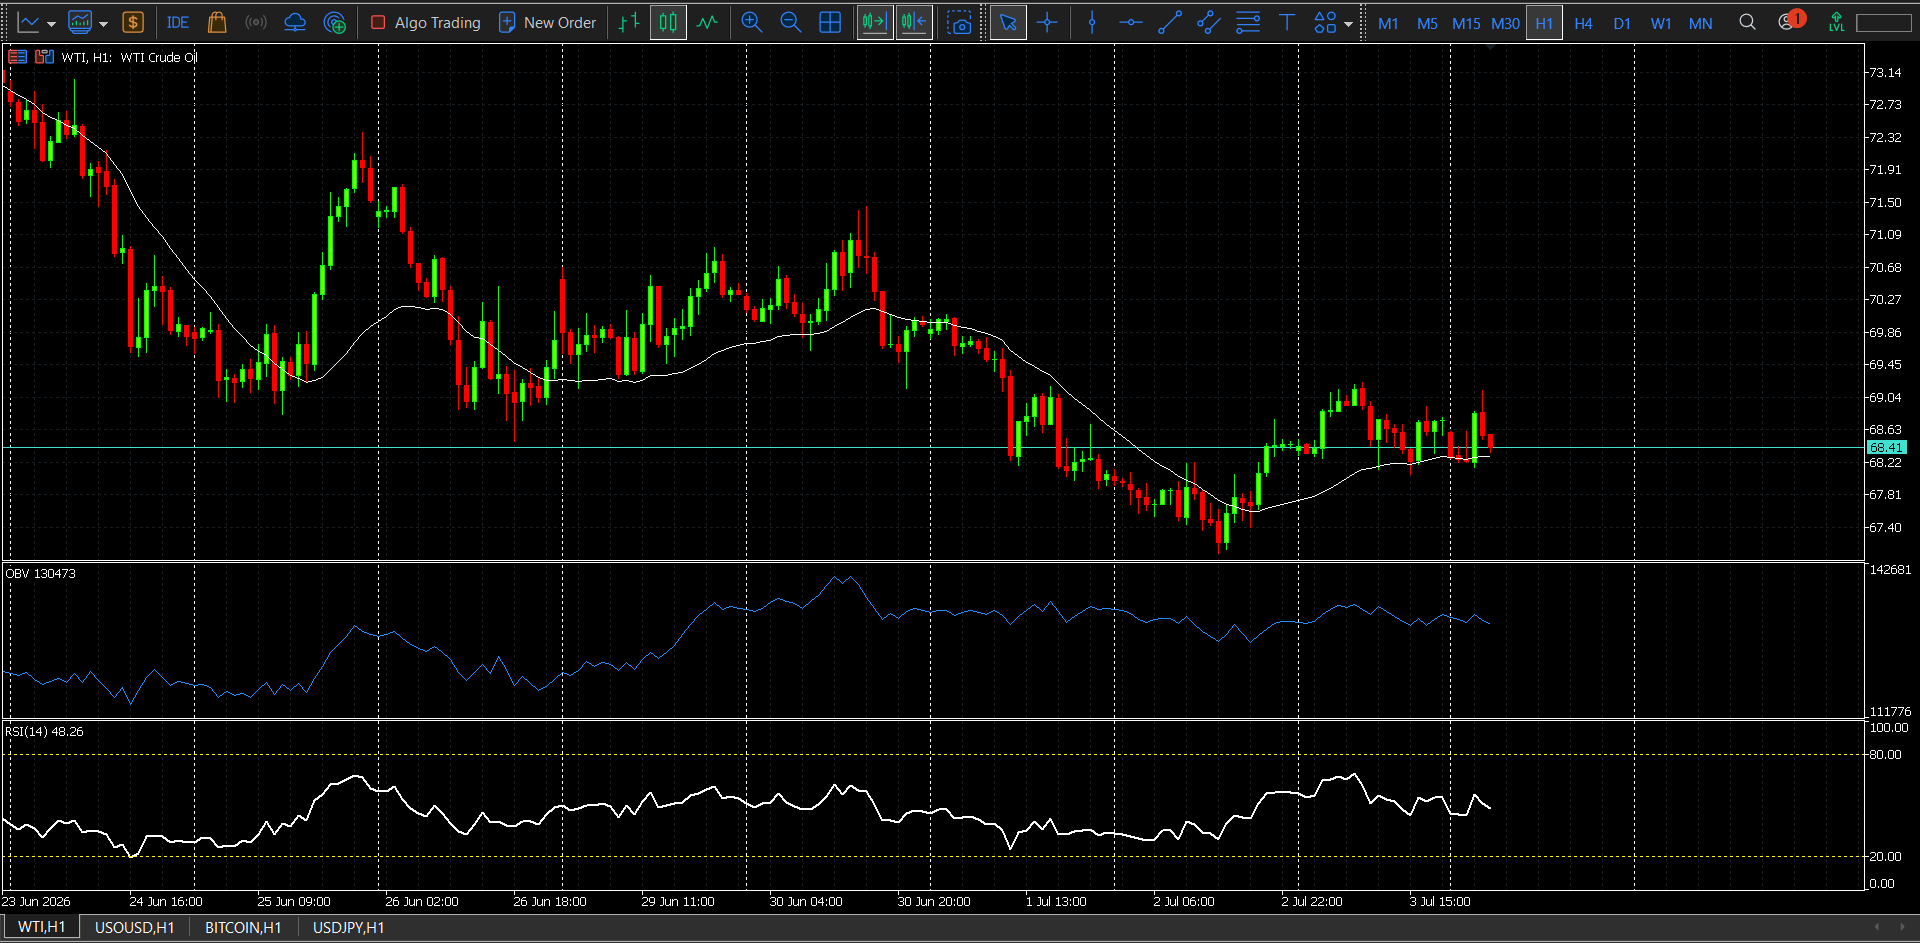
At 01:37 ET / 05:37 GMT, WTI Crude Oil Futures rose only 0.04% to $68.72 per barrel, while Brent Oil Futures fell 0.21% to $71.97 per barrel.

The latest move reflects competing forces in the oil market. Recovering Gulf exports and expectations of higher OPEC+ supply point to a better-supplied market, while mixed signals from Washington and Tehran over future arrangements for the Strait of Hormuz continue to limit risk appetite.

ANZ said Brent’s futures curve remains in a bearish contango structure, where near-term prices trade below longer-dated futures. This usually signals expectations of near-term oversupply.

Markets are now waiting for official selling prices from Saudi Arabia and other Gulf producers for further clues on regional demand. Investors will also monitor whether recovering exports continue to pressure crude prices.

Possible market effect:

The market effect is slightly bearish for crude oil, especially if higher OPEC+ output and recovering exports continue. However, geopolitical uncertainty around the Strait of Hormuz may limit deeper losses and keep risk premium in the market.

Market sentiment:

WTI crude oil: Neutral to slightly sell

Brent crude oil: Neutral to slightly sell

Energy stocks: Neutral, with pressure if crude weakens further

USD impact: Neutral

Q: Why were oil prices subdued on Monday, July 6?

A: Oil prices were subdued because expectations of higher OPEC+ output and recovering Gulf exports offset geopolitical uncertainty around the Strait of Hormuz.

Q: What were the latest WTI and Brent oil prices?

A: WTI Crude Oil Futures rose 0.04% to $68.72 per barrel, while Brent Oil Futures fell 0.21% to $71.97 per barrel.

Q: Is the current oil market sentiment buyable or sellable?

A: Oil sentiment is neutral to slightly sell, because supply expectations and recovering exports are pressuring prices, while geopolitical risk is preventing a stronger bearish move.

Source: Market report provided; ANZ

OPEC+ to Raise August Output as Persian Gulf Supply Recovery Pressures Oil

Importance level: Medium

Oil supply recovery is gathering pace after OPEC+ agreed over the weekend to increase production targets by 188,000 barrels per day from August, extending the gradual rollback of voluntary output cuts.

Although much of the additional supply has not yet reached the physical market, the decision strengthens expectations that crude supply will continue to recover as conditions in the Persian Gulf normalize.

Crude exports through the Strait of Hormuz have also improved in recent weeks, easing fears of prolonged shipping disruptions. Saudi Arabia has restored exports to near pre-conflict levels, while higher output from Gulf producers has reinforced expectations of a looser oil market.

Higher exports from other regional producers also suggest that more barrels may continue returning to the market, adding pressure to crude prices.

Possible market effect:

This news is bearish for oil prices because it supports the view that the market is moving toward better supply conditions. However, geopolitical uncertainty around the Strait of Hormuz may still limit deeper downside if tensions return.

Market sentiment:

WTI crude oil: Neutral to slightly sell

Brent crude oil: Slightly sell

Energy stocks: Neutral to slightly negative

Inflation outlook: Slightly positive if oil prices remain under pressure

Q: How much will OPEC+ increase production targets from August?

A: OPEC+ agreed to increase production targets by 188,000 barrels per day from August.

Q: Why is the recovery of Strait of Hormuz exports important for oil markets?

A: Because improved crude flows through the Strait of Hormuz reduce shipping disruption risks and support expectations of a better-supplied oil market.

Q: Is this supply recovery positive or negative for oil prices?

A: It is generally negative for oil prices, because higher OPEC+ output and recovering Persian Gulf exports increase supply expectations.

Source: Market report provided; OPEC+

Oil Market Faces Hormuz Risk Premium as June OPEC Output Jump Fuels Oversupply Fears

Importance level: Medium

Geopolitical risks around the Strait of Hormuz remain a key focus for oil traders, even as physical crude supplies continue to recover through the Persian Gulf.

Traders are weighing conflicting signals from Washington and Tehran over the future security and governance of the strategic waterway. The report noted that U.S. President Donald Trump said Iran had agreed to “just about everything we need,” while Iranian officials have maintained that Tehran will not give up its influence over the passage or accept conditions tied to shipping access.

This mixed messaging has kept uncertainty elevated and limited deeper downside for crude prices, even as Saudi Arabia, the UAE, and other Gulf producers continue restoring exports through Hormuz.

At the same time, oversupply concerns are offsetting demand optimism. ANZ said crude prices were largely steady last week as markets assessed rising Gulf supplies. The bank noted that OPEC production increased by 2.34 million barrels per day in June as exports resumed through the Strait of Hormuz.

ANZ also warned that although shipping has recovered, security risks remain, which could make it harder to sustain higher export flows over the medium term. Still, traders are increasingly focused on the possibility of a global supply surplus, as lower Chinese crude imports, stronger exports from major producers, and continued OPEC+ production increases suggest supply growth could outpace demand in the second half of the year.

Possible market effect:

The market effect is mixed but slightly bearish for oil. Hormuz-related geopolitical risk may keep a risk premium in crude prices, but rising Gulf exports, higher OPEC production, and weaker Chinese import demand increase the risk of oversupply. If supply growth continues to outpace demand, Brent and WTI may face further downside pressure.

Market sentiment:

Brent crude oil: Neutral to slightly sell

WTI crude oil: Neutral to slightly sell

Energy stocks: Neutral to slightly negative

Inflation outlook: Slightly positive if oil remains under pressure

Q: Why are geopolitical risks still important for oil prices?

A: Geopolitical risks remain important because uncertainty over the Strait of Hormuz can disrupt shipping confidence and keep a risk premium in crude prices.

Q: How much did OPEC production increase in June?

A: According to ANZ, OPEC production increased by 2.34 million barrels per day in June as exports resumed through the Strait of Hormuz.

Q: Is the current oil market more buyable or sellable?

A: Oil is currently neutral to slightly sell, because geopolitical risk is limiting losses, but oversupply concerns are becoming stronger.

Source: Market report provided; ANZ

Iran eyes Japan’s oil market again as August waiver deadline limits real buying

Iran has started exploring a possible return to the Japanese oil market for the first time in seven years, after the United States issued a temporary sanctions waiver on June 22 as part of ongoing 60-day peace negotiations with Tehran.

According to Reuters, the waiver expires on August 21, creating a short window for preliminary talks between Iran and Japanese companies. However, prospective Japanese buyers are asking for longer U.S. sanctions relief and stronger security assurances before committing to any crude purchases.

Reuters reported that three Japanese buyers are evaluating possible Iranian crude imports, which would be their first purchases since 2019. Japanese and Iranian officials have also held early discussions about restarting oil trade. Still, industry sources said the current waiver period is too short for normal commercial shipments, as voyages from Iran to Japan take several weeks.

Shipping insurance and security risks in the Strait of Hormuz remain major barriers. Although the ceasefire between Tehran and Washington has reduced immediate geopolitical tensions, commercial vessels still face security concerns, while insurers remain cautious after recent attacks and reports of floating mines in the waterway.

Japan, South Korea, India, and several European countries stopped buying Iranian crude after the United States tightened sanctions in 2018, following President Donald Trump’s withdrawal from the Iran nuclear agreement. Since then, China has remained Iran’s main oil customer.

For now, the temporary waiver is unlikely to trigger significant buying from well-supplied Asian refiners unless sanctions relief is extended and a durable peace agreement is reached. Independent Chinese refiners remain the most likely near-term buyers of Iranian crude.

Possible market effect:

The immediate impact on crude oil supply is likely limited because the waiver period is short and Japanese refiners still need legal, insurance, and shipping clarity. For oil prices, the news is neutral-to-slightly bearish if markets focus on the possibility of more Iranian barrels returning, but neutral-to-bullish if traders focus on Strait of Hormuz risks and geopolitical uncertainty. Overall, crude oil sentiment remains neutral with a risk-premium bias, while Iranian supply would become more bearish for oil only if sanctions relief is extended beyond August 21 and actual shipments resume.

Q: Is Iran’s return to Japan’s oil market already confirmed?

A: No. Iran and Japanese companies are only in preliminary discussions, and buyers want longer sanctions relief and stronger shipping-security guarantees before committing.

Q: Why is the August 21 waiver deadline important for Iranian oil exports to Japan?

A: The waiver expires on August 21, and voyages from Iran to Japan take several weeks, making the current timeframe too short for normal commercial oil shipments.

Q: What is the likely market impact of Iran-Japan oil talks?

A: The near-term impact is limited. The news could slightly pressure oil if traders price in future Iranian supply, but Strait of Hormuz risks and insurance concerns keep a geopolitical risk premium in the market.

Source: Reuters.

OPEC+ Adds 188,000 Barrels a Day for August as Oil Supply Recovery Accelerates

Importance level: High

Major OPEC+ members agreed on Sunday to raise their collective oil-production quotas for August by 188,000 barrels per day, adding further supply pressure to an already weakening oil market.

Seven countries led by Saudi Arabia and Russia approved the increase during a video conference. According to an OPEC statement, total quota additions since the war began have now reached 940,000 barrels per day, equal to nearly 1% of global oil demand.

The decision comes as crude prices remain under pressure from expectations of recovering supply, especially if the U.S.-Iran peace deal holds and the Strait of Hormuz continues to reopen more fully for crude exports.

The move also marks the final step in unwinding two tranches of production cuts introduced in 2023. A final tranche is still officially scheduled to remain in place through year-end, although some delegates have raised the possibility of accelerating its restart.

Possible market effect:

This is bearish for oil prices because it increases expectations of stronger supply in the second half of the year. If Persian Gulf exports continue to normalize and OPEC+ accelerates the return of more barrels, Brent and WTI may face additional downside pressure. However, any renewed geopolitical tension around the Strait of Hormuz could limit losses.

Market sentiment:

Brent crude oil: Slightly sell

WTI crude oil: Slightly sell

Energy stocks: Neutral to slightly negative

Inflation outlook: Slightly positive if oil prices keep falling

Q: How much will OPEC+ increase oil-production quotas for August?

A: Major OPEC+ members agreed to add 188,000 barrels per day to their August production target.

Q: How much have OPEC+ quotas increased since the war began?

A: Total quota additions have reached 940,000 barrels per day, equal to nearly 1% of global oil demand.

Q: Is the OPEC+ August production increase positive or negative for oil prices?

A: It is generally negative for oil prices because higher production targets increase expectations of a better-supplied market.

Source: OPEC statement

June Oil Supply Surge Deepens Oversupply Fears as UAE and Russia Exports Hit Records

Importance level: High

The global oil supply picture became more bearish in June, as producers operating outside strict OPEC+ discipline increased exports sharply, adding pressure to an already fragile crude market.

The UAE, which quit the organization in May over frustration with mandated output limits, posted record crude and condensate exports of about 3.7 million barrels per day in June. That surpassed its previous peak of 3.44 million barrels per day set in April 2020, according to Kpler and Vortexa ship-tracking data cited by Reuters.

Russia also added to the supply pressure. Exports from Russia’s western ports reached a record of nearly 3 million barrels per day in June, as Ukrainian drone attacks on domestic refineries forced Moscow to redirect crude that would otherwise have been processed locally.

Meanwhile, Iraq is pushing for a much higher OPEC quota and has raised the possibility of leaving the organization if its demand is rejected. Reuters cited an Iraqi energy adviser saying Iraq’s demand for a larger quota is mainly driven by rising economic pressure. Baghdad’s response to the August output decision, and whether it escalates its exit threat before the August 2 ministerial meeting, will be closely watched.

Possible market effect:

This is bearish for crude oil because record exports from the UAE and Russia, combined with Iraq’s demand for a higher quota, strengthen the risk of a looser global oil market. If OPEC+ discipline weakens further, supply growth could outpace demand more clearly in the second half of the year, adding downside pressure to Brent and WTI.

Market sentiment:

Brent crude oil: Sell to slightly sell

WTI crude oil: Sell to slightly sell

Energy stocks: Neutral to negative

Inflation outlook: Slightly positive if oil prices keep falling

Q: Why did oil oversupply concerns increase in June?

A: Oversupply concerns increased because the UAE exported about 3.7 million barrels per day, Russia’s western port exports reached nearly 3 million barrels per day, and Iraq pushed for a higher OPEC quota.

Q: Why is Iraq’s position important for OPEC?

A: Iraq’s position is important because it is demanding a much higher quota and has raised the possibility of leaving the organization if that demand is rejected.

Q: Is this news positive or negative for oil prices?

A: It is generally negative for oil prices, because rising exports and weaker production discipline increase expectations of stronger supply.

Source: Reuters; Kpler; Vortexa

Brent Curve Flips Into Contango on Wednesday, July 3, as Oversupply Fears Deepen

Importance level: High

The Brent forward curve flipped into contango for the first time this year on Wednesday, July 3, with the six-month spread falling to -$0.56 per barrel. This is a technical signal that near-term supply is becoming heavier than immediate demand.

For oil investors, the key question is how quickly OPEC+ quota increases turn into real barrels reaching the market, and whether global demand can absorb the additional supply.

Major banks are now warning about downside risk. Citi forecasts Brent will fall to $60–$65 per barrel by end-2026 as the Hormuz shock fades. Goldman Sachs and Morgan Stanley have both flagged the risk of a returning global supply glut. UBS cut its 2026 average Brent forecast to $83.74 and its 2027 forecast to $75 per barrel, while warning that Brent could fall toward $70 if UAE supply increases faster than expected.

Possible market effect:

This is bearish for Brent and broader crude sentiment. A move into contango often suggests the physical market is loosening, especially when supply is rising faster than demand. If actual OPEC+ barrels, UAE exports, and broader Gulf supply continue to increase, oil may face more downside pressure into the second half of the year.

Market sentiment:

Brent crude oil: Sell to slightly sell

WTI crude oil: Slightly sell

Energy stocks: Neutral to negative

Inflation outlook: Slightly positive if oil keeps falling

Q: What does Brent contango mean for the oil market?

A: Brent contango means near-term prices are trading below longer-dated prices, often signaling that immediate supply is stronger than demand.

Q: What was the Brent six-month spread on Wednesday, July 3?

A: The six-month Brent spread fell to -$0.56 per barrel.

Q: Is Brent currently buyable or sellable?

A: Brent is currently sellable to slightly sell, because contango, rising supply, and bank warnings about a possible supply glut point to weaker price conditions.

Source: Brent futures market pricing; Citi; Goldman Sachs; Morgan Stanley; UBS

Iran Eyes Return to Japan’s Oil Market Under June–August U.S. Sanctions Waiver

Importance level: High

Iran has begun exploring a possible return to the Japanese oil market for the first time in seven years, after Washington issued a temporary sanctions waiver on June 22 as part of ongoing 60-day peace negotiations with Tehran, according to Reuters.

The waiver, which expires on August 21, has opened the door for early talks between Iranian officials and Japanese companies. Reuters reported that three Japanese buyers are evaluating potential Iranian crude imports, which would be their first purchases from Iran since 2019.

However, Japanese refiners are seeking a longer sanctions-relief window and stronger security assurances before committing to purchases. Industry sources said voyages from Iran take several weeks, making the current waiver period too short for normal commercial shipments.

Insurance availability and shipping security through the Strait of Hormuz remain major obstacles. Although the ceasefire between Tehran and Washington has reduced immediate geopolitical tensions, insurers remain cautious after recent attacks and reports of floating mines in the waterway.

Japan, South Korea, India and several European countries stopped buying Iranian crude after the U.S. tightened sanctions in 2018 following President Donald Trump’s withdrawal from the Iran nuclear agreement. Since then, China has remained Iran’s main oil customer.

The temporary waiver is unlikely to generate major buying from well-supplied Asian refiners unless sanctions relief is extended and a durable peace agreement is reached. For now, independent Chinese refiners remain the most likely near-term buyers of Iranian crude.

Possible market effect:

This news is potentially bearish for oil prices if Iranian crude returns meaningfully to Asian markets, because it would add extra supply at a time when OPEC+ output is also rising. However, the short waiver period, insurance issues, and Hormuz security risks limit the immediate supply impact.

Market sentiment:

Brent crude oil: Neutral to slightly sell

WTI crude oil: Neutral to slightly sell

Japanese refiners: Neutral to slightly positive if cheaper Iranian crude becomes available

Iran-linked oil supply outlook: Slightly positive, but conditional

JPY: Neutral

Q: Why is Iran discussing a return to Japan’s oil market?

A: Iran is exploring a return because Washington issued a temporary sanctions waiver on June 22, allowing early talks with Japanese buyers.

Q: When does the U.S. sanctions waiver for Iranian oil talks expire?

A: The waiver expires on August 21.

Q: Why are Japanese refiners still cautious about buying Iranian crude?

A: They want longer sanctions relief, better insurance availability, and stronger shipping security through the Strait of Hormuz before committing to purchases.

Q: Is this news positive or negative for oil prices?

A: It is slightly negative for oil prices if Iranian supply returns, but the immediate impact is limited because the waiver is short and shipping risks remain high.

Source: Reuters

More Commodities news

Others

Singapore Retail Sales Slowed in May as Monthly Spending Fell 2.3%

Importance level: Low

Singapore’s Retail Sales YoY increased by 3.0% in May, slowing from the previous reading of 5.4%. Although annual retail sales remained positive, the pace of growth weakened clearly compared with the previous period.

On a monthly basis, Retail Sales MoM fell by 2.3% in May, reversing from the previous 0.4% increase. This monthly decline shows weaker short-term consumer spending momentum in Singapore.

Possible market effect:

The data is mildly negative for Singapore’s domestic-demand outlook. Slower annual growth and a sharp monthly decline may pressure consumer-related stocks, especially retail and discretionary sectors. However, because the importance level is low, the direct impact on the Singapore dollar may remain limited.

Market sentiment:

SGD: Neutral to slightly sell

Singapore consumer stocks: Neutral to slightly negative

Q: Did Singapore retail sales remain positive in May?

A: Yes. Singapore’s Retail Sales YoY rose by 3.0%, but growth slowed from 5.4%.

Q: What does the monthly Singapore retail sales decline show?

A: The 2.3% MoM decline suggests weaker short-term consumer spending momentum.

Q: Is this data positive or negative for the Singapore dollar?

A: It is slightly negative, but mostly neutral for SGD, because the data has low market importance.

Source: Singapore Department of Statistics / SingStat

Nomura: South Korean Memory-Chip Oversupply Fears Look Overstated as AI Demand Stays Strong

Importance level: Medium

Concerns over a new wave of investment announcements by South Korean memory chipmakers and Meta’s (NASDAQ: META) plan to sell excess computing capacity may be overstating the risk of a downturn in the memory cycle, according to Nomura analysts.

Nomura said Korean memory companies and affiliates recently announced long-term investment plans totaling about 4.8 quadrillion won, equal to roughly $3.5 trillion. Around 3.7 quadrillion won of that amount is directly tied to memory-related projects, raising investor concerns about potential oversupply.

However, Nomura argued that the market is still facing a severe shortage driven by AI demand. Producers are prioritizing high-margin high-bandwidth memory (HBM), while supply of commodity DRAM and NAND remains constrained.

The brokerage also said these projects are unlikely to materially affect supply for several years because semiconductor clusters require long development timelines. Nomura estimated that the Yongin Semiconductor Cluster, launched nine years ago, may not begin small-scale production until late 2027, implying a lead time of more than a decade from initial investment to meaningful output.

Nomura also dismissed concerns that Meta’s plan to market surplus computing power signals weaker AI hardware demand. The firm said monetizing excess data-center capacity is a natural step for large platforms and could improve returns on invested capital, while potentially supporting AI customers such as OpenAI and Anthropic.

Instead of reducing AI-related hardware demand, Nomura said lower computing costs could stimulate additional usage.

Possible market effect:

This view is supportive for memory-chip and AI infrastructure sentiment. If Nomura’s assessment is correct, oversupply fears may be exaggerated, while HBM demand and constrained DRAM/NAND supply could continue to support pricing power for memory producers. The impact is also mildly positive for AI-linked semiconductor stocks, but investors may remain selective because valuations are already elevated.

Market sentiment:

South Korean memory chipmakers: Neutral to buyable

HBM-related semiconductor stocks: Buyable, but valuation-sensitive

Commodity DRAM/NAND producers: Neutral to slightly positive

Meta: Neutral to slightly positive

Nasdaq / AI trade: Neutral to mildly buyable

Q: Why does Nomura think memory-chip oversupply fears are overstated?

A: Nomura believes AI demand is creating a severe shortage, while producers are focusing on high-margin HBM and leaving commodity DRAM and NAND supply constrained.

Q: How large were the announced Korean memory investment plans?

A: The announced long-term plans totaled about 4.8 quadrillion won, or roughly $3.5 trillion, with about 3.7 quadrillion won tied directly to memory projects.

Q: Is the AI semiconductor trade still buyable?

A: It remains selectively buyable, especially in HBM and AI infrastructure names, but investors should watch valuation risk and any signs of supply catching up.

Source: Nomura

Taiwan FX Reserves Fall in June as Holdings Drop to $597.15 Billion

Importance level: Low

Taiwan’s FX Reserves declined to $597.15 billion in June, down from the previous reading of $605.07 billion.

The decline shows a reduction in Taiwan’s foreign-exchange reserve holdings, although the level remains large. For markets, the figure may be watched as a sign of external stability, currency-management capacity, and broader capital-flow conditions.

Possible market effect:

The decline is mildly negative for the Taiwan dollar, but the market impact should remain limited because Taiwan’s reserves remain substantial and the data has low importance.

Market sentiment:

TWD: Neutral to slightly sell

Taiwan equities: Neutral

Q: What were Taiwan’s FX reserves in June?

A: Taiwan’s FX reserves fell to $597.15 billion in June from $605.07 billion.

Q: Is the decline in Taiwan’s FX reserves a major concern?

A: Not immediately. The decline is mildly negative, but Taiwan’s reserves remain large.

Source: Central Bank of the Republic of China / Taiwan FX reserve data

Mexico Fixed Investment Rebounds Strongly in April, Beating Forecasts

Importance level: Low

Mexico’s Gross Fixed Investment improved sharply in April, signaling stronger capital spending and business investment momentum.

On an annual basis, Gross Fixed Investment rose 5.90% YoY, beating the forecast of 3.80% and recovering from the previous 2.60% decline. On a monthly basis, investment increased 4.00% MoM, also above expectations of 3.00% and stronger than the previous 0.40% rise.

Possible market effect:

This data is mildly positive for Mexico’s growth outlook and investment sentiment. It may support the Mexican peso and Mexican equities, especially industrial and infrastructure-related sectors, although the direct market impact is limited because the importance level is low.

Market sentiment:

MXN: Neutral to slightly buyable

Mexican equities: Slightly positive

Q: How did Mexico’s Gross Fixed Investment perform in April?

A: It rose 5.90% YoY and 4.00% MoM, both above forecasts.

Q: Is Mexico’s investment data positive for the Mexican peso?

A: It is mildly positive for MXN, but the market impact may remain limited because the data has low importance.

Source: INEGI

Israel Holds Interest Rate at 3.50% in July After Previous 3.75% Level

Importance level: Low

The Bank of Israel kept its interest rate unchanged at 3.50% in July, in line with expectations. The previous rate was 3.75%.

The decision suggests the central bank is maintaining a cautious policy stance while monitoring inflation, growth conditions, and financial-market stability.

Possible market effect:

Because the decision matched expectations, the direct market reaction should be limited. The hold is broadly neutral for the Israeli shekel, unless the central bank’s guidance signals a stronger policy shift.

Market sentiment:

ILS: Neutral

Israeli equities: Neutral to slightly positive

Israeli bonds: Neutral

Q: What did the Bank of Israel decide in July?

A: The Bank of Israel kept the interest rate unchanged at 3.50%.

Q: Is this decision positive or negative for the Israeli shekel?

A: It is mostly neutral for ILS, because the decision matched expectations.

Source: Bank of Israel

Philippine Inflation Cools in June, but Core CPI Rises to 4.4%

Importance level: Low

Philippine inflation delivered a mixed signal in June. Headline CPI YoY slowed to 6.4%, below the forecast of 6.6% and down from the previous 6.8%, showing that overall inflation pressure eased.

On a monthly basis, CPI MoM fell 0.3%, compared with the forecast of a 0.1% rise and the previous 0.5% decline. This points to softer short-term price momentum.

However, Core CPI YoY rose to 4.4%, above the forecast and previous reading of 4.1%. This shows that underlying inflation pressure remained sticky even as headline inflation cooled.

Possible market effect:

The data is mixed for the Philippine peso. Lower headline inflation is supportive for consumer conditions and may reduce pressure for tighter policy, but higher core inflation could keep the Bangko Sentral ng Pilipinas cautious.

Market sentiment:

PHP: Neutral

Philippine equities: Neutral to slightly positive

Philippine bonds: Neutral

Q: Did Philippine inflation cool in June?

A: Yes. Headline CPI slowed to 6.4% YoY, below the forecast of 6.6% and the previous 6.8%.

Q: Why is the Philippine inflation report mixed?

A: It is mixed because headline inflation cooled, but Core CPI rose to 4.4%, showing sticky underlying price pressure.

Q: Is this inflation data positive or negative for the Philippine peso?

A: It is mostly neutral for PHP, because softer headline inflation is balanced by stronger core inflation.

Source: Philippine Statistics Authority

More Others news

USA

U.S. Services Sector Slows in June as ISM PMI Misses Forecast but Employment Improves

Importance level: High

U.S. services-sector data delivered a mixed signal in June. The S&P Global Services PMI slipped to 51.2, slightly below the forecast and previous reading of 51.3, while the S&P Global Composite PMI rose to 51.9, beating the previous 51.5 but missing the forecast of 52.2.

The ISM Non-Manufacturing PMI fell to 54.0, below expectations of 54.2 and down from 54.5, showing that service-sector expansion continued but lost some momentum. New Orders also weakened to 55.1, below the forecast of 56.8 and the previous 57.3, while Business Activity declined to 55.4 from 57.7.

However, the labor component improved. ISM Non-Manufacturing Employment rose to 51.2, beating expectations of 48.2 and recovering from 47.9, moving back into expansion territory. Meanwhile, ISM Non-Manufacturing Prices eased to 67.7, below the previous 71.3 but still slightly above the forecast of 67.5, showing price pressure remains elevated.

Possible market effect:

This data is mixed for markets. Softer activity, new orders, and business activity may reduce confidence in U.S. growth momentum, while stronger employment and still-elevated prices could keep the Federal Reserve cautious. For equities, the data is not clearly bullish because growth momentum weakened, but it is also not strongly bearish because services remain in expansion.

Market sentiment:

USD: Neutral to slightly buyable

U.S. equities: Neutral

Treasury yields: Neutral to slightly higher if inflation concerns dominate

Gold: Neutral to slightly sell if USD firms

Q: Did the U.S. services sector remain in expansion in June?

A: Yes. The ISM Non-Manufacturing PMI stayed above 50.0 at 54.0, meaning the services sector remained in expansion, although momentum slowed.

Q: What was the most positive part of the U.S. services data?

A: The strongest signal came from ISM Non-Manufacturing Employment, which rose to 51.2, beating the forecast of 48.2 and moving back into expansion territory.

Q: Is this U.S. services data positive for the U.S. dollar?

A: The data is neutral to slightly positive for the USD, because weaker activity is balanced by stronger employment and still-high price pressure.

Source: S&P Global; Institute for Supply Management

U.S. Employment Trends Index Edges Lower in June, Signaling Softer Labor Momentum

Importance level: Low

The Conference Board Employment Trends Index slipped to 106.69 in June, slightly below the previous reading of 106.90.

The small decline suggests that U.S. labor-market momentum softened modestly, although the move was not large enough to signal a sharp deterioration. The index is useful because it tracks several labor-market indicators that can help anticipate future employment trends.

Possible market effect:

The data is mildly negative for the U.S. labor outlook, but the direct market impact should remain limited because the decline was small and the importance level is low. Traders are more likely to focus on payrolls, unemployment, wages, and Fed communication.

Market sentiment:

USD: Neutral

U.S. equities: Neutral to slightly positive if weaker labor reduces rate pressure

Treasury yields: Neutral to slightly lower

Q: What was the U.S. Employment Trends Index in June?

A: The index fell slightly to 106.69, down from 106.90.

Q: Does the Employment Trends Index show a sharp labor-market slowdown?

A: No. The decline was modest, suggesting softer labor momentum but not a sharp deterioration.

Source: The Conference Board

U.S. Short-Term Treasury Bill Yields Ease in Latest 3-Month and 6-Month Auctions

Importance level: Low

U.S. short-term Treasury bill auction yields moved slightly lower, showing a modest decline in short-term funding rates.

The 3-month bill auction yield slipped to 3.735%, down from the previous 3.740%. The 6-month bill auction yield also eased to 3.830%, compared with the previous 3.840%.

The small decline suggests demand for short-term U.S. government debt remained stable, while markets continue to assess the Federal Reserve’s interest-rate outlook.

Possible market effect:

The market impact is limited, but slightly lower short-term bill yields may be mildly supportive for Treasury sentiment. The effect on the U.S. dollar is likely neutral unless broader yield trends continue lower.

Market sentiment:

USD: Neutral

U.S. Treasury bills: Neutral to slightly positive

Gold: Neutral to slightly positive if yields keep easing

U.S. equities: Neutral

Q: What was the latest U.S. 3-month bill auction yield?

A: The U.S. 3-month bill auction yield fell slightly to 3.735%, from 3.740% previously.

Q: What was the latest U.S. 6-month bill auction yield?

A: The U.S. 6-month bill auction yield eased to 3.830%, down from 3.840%.

Q: Is this data positive or negative for the U.S. dollar?

A: The data is mostly neutral for the U.S. dollar, because the yield decline was very small and the importance level is low.

Source: U.S. Treasury

U.S. Treasury Yields Drift Lower on Monday as Markets Await First Warsh-Era Fed Minutes

Importance level: High

U.S. Treasury yields moved lower on Monday, extending last week’s downward shift after softer-than-expected labor-market data pushed bond investors to reassess the near-term path for inflation and interest rates.

The benchmark 10-year Treasury yield eased to around 4.45%, giving back part of its recent gains as fixed-income markets found support ahead of Wednesday’s key Federal Reserve June policy minutes. The policy-sensitive 2-year Treasury yield also declined to 4.11%, reflecting stronger market conviction that the U.S. labor market is entering a cooling phase.

However, bond-market gains remained limited because investors are still uncertain about the Fed’s final terminal rate. Fixed-income portfolios are being actively protected before the release of the June FOMC minutes, which will be closely watched as the first major insight into central-bank dynamics under newly appointed Fed Chair Kevin Warsh.

Possible market effect:

Lower Treasury yields are generally supportive for equities, gold, and rate-sensitive assets, while slightly negative for the U.S. dollar. However, if the Fed minutes show policymakers remain worried about sticky inflation or signal a higher terminal rate, yields could rebound quickly.

Market sentiment:

U.S. Treasury bonds: Neutral to slightly buyable

USD: Neutral to slightly sell

Gold: Neutral to slightly buyable if yields keep falling

U.S. equities: Neutral to slightly positive

2-year yield outlook: Downside pressure unless Fed minutes sound hawkish

Q: Why did U.S. Treasury yields fall on Monday?

A: U.S. Treasury yields fell because softer labor-market data increased expectations that the U.S. economy is cooling and reduced near-term pressure for additional Fed tightening.

Q: What were the latest U.S. 10-year and 2-year Treasury yields?

A: The 10-year Treasury yield eased to around 4.45%, while the 2-year Treasury yield declined to 4.11%.

Q: Are U.S. Treasury bonds currently buyable or sellable?

A: U.S. Treasury bonds are neutral to slightly buyable, but traders should watch the Fed minutes because hawkish signals could push yields higher again.

Source: U.S. Treasury market data; Federal Reserve

U.S.-China Meeting Signal: Trump Expects Xi Visit Around September 24

Importance level: High

President Donald Trump said on Monday that he expects to meet Chinese President Xi Jinping around September 24, a date that would align with the United Nations General Assembly in New York.

Trump mentioned the possible timing during a Monday event while discussing plans for a new White House ballroom, saying a visit by Xi would require a larger venue. He said Xi was expected “toward the end of Sept. 24,” adding that many people would want to attend.

A visit around that date would come during a key diplomatic window. Trump is scheduled to speak at the UN General Assembly on September 22 and typically stays in New York for several days to meet global leaders. Xi has attended the UN gathering only once since taking office in 2012.

Trump had previously said he expected to host Xi in September, but this was the first time he mentioned a possible date. The two leaders last met in May during a summit in Beijing, where both sides sought to strengthen ties after tensions linked to the Iran war.

Possible market effect:

This news could be positive for global risk sentiment if markets see the meeting as a sign of improving U.S.-China relations. It may support Asian equities, global trade-sensitive stocks, and the Chinese yuan. However, the market reaction may stay cautious until the meeting is officially confirmed and policy details become clearer.

Market sentiment:

U.S. equities: Neutral to slightly positive

Chinese equities: Slightly positive

USD/CNY: Neutral to slightly lower if diplomatic sentiment improves

Gold: Neutral to slightly negative if risk appetite improves

Global risk assets: Slightly positive

Q: When does Trump expect to meet Xi Jinping?

A: Trump said he expects to meet Xi Jinping around September 24.

Q: Why is the September 24 timing important?

A: The date aligns with the United Nations General Assembly, where Trump is scheduled to speak on September 22 and meet other world leaders.

Q: Could this meeting affect markets?

A: Yes. A confirmed Trump-Xi meeting could improve risk sentiment, support Chinese and Asian equities, and slightly reduce safe-haven demand.

Source: Trump remarks at Monday event

More USA news

Forex

U.S. Dollar Rebounds on Monday as Fed Rate Uncertainty Keeps Markets Cautious

Importance level: Medium

The U.S. Dollar Index rose 0.1% on Monday, recovering from a near two-week low reached last week, as markets continued to question whether the Federal Reserve will raise interest rates again this year.

Despite last week’s decline, the greenback remained close to the 13-month highs touched in June, supported by sticky U.S. inflation and uncertainty over the future path of interest rates.

Investors are now waiting for the minutes of the Fed’s June policy meeting, due this week, which could provide more clarity on whether policymakers still see room for another rate hike. During the June meeting, Fed officials signaled that persistent inflation may require at least one rate hike this year.

Falling oil prices helped ease some inflation concerns, but markets remain cautious about other inflationary pressures, including the potential cost impact of the artificial intelligence industry and rising global temperatures.

Possible market effect:

The data is mildly supportive for the U.S. dollar, especially if the Fed minutes confirm that policymakers remain concerned about sticky inflation. However, weaker labor-market data and lower oil prices may limit aggressive dollar buying.

Market sentiment:

USD: Neutral to slightly buyable

Gold: Neutral to slightly sell while USD recovers

U.S. equities: Neutral, waiting for Fed minutes

Treasury yields: Neutral to slightly higher if Fed minutes sound hawkish

Q: Why did the U.S. dollar rise on Monday?

A: The U.S. dollar rose because markets remained uncertain about the Fed’s interest-rate path, while sticky inflation kept the possibility of another rate hike alive.

Q: Why are the Fed minutes important for markets this week?

A: The Fed minutes may show whether policymakers still believe inflation is strong enough to justify at least one more rate hike this year.

Q: Is the U.S. dollar currently buyable or sellable?

A: The U.S. dollar is neutral to slightly buyable, especially if the Fed minutes sound hawkish. However, weak labor data or softer inflation signals could limit upside.

Source: Market report provided

Japanese Yen Weakens on Monday, July 6, as USD/JPY Stays Above 160 and Intervention Risk Builds

Importance level: High

The Japanese yen remained under pressure on Monday, July 6, with USD/JPY rising 0.3% to 161.82 yen, staying close to levels last seen in 1986.

The pair had dropped sharply after weaker U.S. labor-market data last week, but recovered quickly on Friday. The yen continues to face pressure from the wide interest-rate gap between the United States and Japan, while doubts over further government spending also weighed on sentiment.

USD/JPY remained well above the 160 yen level, a zone that has previously triggered heavy intervention by Japanese authorities. Officials have issued verbal warnings against speculation in recent weeks, keeping traders cautious about possible direct action in the currency market.

The yen’s weakness came even after the Bank of Japan raised interest rates in June and warned of more hawkish moves. ING analysts said softer U.S. data improves near-term conditions for the yen, but stronger hawkish communication from the Bank of Japan is still needed to prevent another USD/JPY rebound similar to the move seen after the April/May intervention round.

Tokyo last intervened in late April and early May, pushing USD/JPY as low as 155 yen, but the pair later rebounded quickly.

Possible market effect:

The market effect is highly sensitive. A move above 160 keeps intervention risk elevated, which may limit fresh USD/JPY buying. However, unless the Bank of Japan delivers stronger hawkish signals or U.S. yields fall further, the yen may remain vulnerable.

Market sentiment:

USD/JPY: Neutral to slightly buyable above 160, but intervention risk is high

JPY: Weak, but intervention-sensitive

USD: Neutral to slightly buyable versus JPY

Japanese equities: Mixed; weak yen supports exporters, but intervention risk may create volatility

Q: Why did USD/JPY rise on Monday, July 6?

A: USD/JPY rose because the yen remained pressured by the wide U.S.-Japan interest-rate gap and doubts over further government spending.

Q: Why is the 160 level important for USD/JPY?

A: The 160 yen level is important because it has previously attracted Japanese government intervention, making traders cautious about further yen weakness.

Q: Is USD/JPY currently buyable or sellable?

A: USD/JPY is neutral to slightly buyable while it holds above 160, but the trade carries high intervention risk near 161.82.

Source: ING; market data

Asian Currencies Weaken on Monday as Dollar Firms and Yen Stays Near 40-Year Lows

Importance level: Medium

Most Asian currencies weakened on Monday, as the U.S. dollar firmed slightly after falling from 13-month highs last week. The Japanese yen remained close to 40-year lows, keeping markets alert to the risk of further government intervention from Tokyo.

Asian currencies had gained some ground after Thursday’s softer U.S. labor report, which raised questions over how much room the Federal Reserve still has to raise interest rates this year. However, those gains faded as markets remained concerned about sticky U.S. inflation and waited for the Federal Reserve’s meeting minutes.

The Chinese yuan’s USD/CNY pair rose 0.1%, while USD/SGD also increased 0.1%, showing mild weakness in both the yuan and Singapore dollar. The South Korean won’s USD/KRW pair rose 0.1%, as Seoul began 24-hour onshore spot trading of the dollar-won pair to broaden currency convertibility and support its push for developed-market status in the MSCI global index.

The Australian dollar’s AUD/USD pair fell 0.2%, while USD/TWD rose 0.4% and USD/INR gained 0.2%, showing pressure on the Taiwan dollar and Indian rupee.

Possible market effect:

The market effect is mildly positive for the U.S. dollar and negative for most Asian currencies. If the Fed minutes sound hawkish, Asian FX could face more pressure. However, the yen’s weakness near extreme levels keeps intervention risk high, especially if USD/JPY continues rising.

Market sentiment:

U.S. dollar: Neutral to slightly buyable

Japanese yen: Weak, but intervention-sensitive

Chinese yuan: Neutral to slightly sell

Singapore dollar: Neutral to slightly sell

South Korean won: Neutral to slightly sell

Australian dollar: Slightly sell

Taiwan dollar: Slightly sell

Indian rupee: Neutral to slightly sell

Q: Why did most Asian currencies weaken on Monday?

A: Most Asian currencies weakened because the U.S. dollar recovered slightly, while sticky U.S. inflation kept markets cautious ahead of the Federal Reserve minutes.

Q: Why is the Japanese yen still important for Asian FX sentiment?

A: The yen is important because it remains close to 40-year lows, raising the risk of another intervention by Japanese authorities.

Q: Is the U.S. dollar currently buyable against Asian currencies?

A: The U.S. dollar is neutral to slightly buyable against most Asian currencies, especially if the Fed minutes support a hawkish interest-rate outlook.

Source: Market data

Japanese Yen Weakens on Monday, July 6, as USD/JPY Hits 162.04 and Intervention Risk Stays High

Importance level: High

The Japanese yen weakened against the U.S. dollar on Monday, July 6, with USD/JPY rising 0.4% to 162.04. The yen remained near a 40-year low against the greenback, despite briefly strengthening last Thursday after weaker U.S. jobs data reduced expectations for another Federal Reserve rate hike.

USD/JPY has stayed well above the key 160 level since mid-June, a zone that has previously triggered heavy intervention from Tokyo. Japanese officials have issued repeated verbal warnings against speculative moves in recent weeks, keeping traders alert to the risk of direct currency-market intervention.

The yen’s weakness has persisted even after the Bank of Japan raised interest rates in June and signaled the possibility of more hawkish policy steps. ING analysts said softer U.S. data helps the yen in the near term, but stronger hawkish communication from the Bank of Japan is still needed to prevent another quick rebound in USD/JPY similar to the move after the April/May intervention round.

Tokyo last intervened in late April and early May, pushing USD/JPY as low as 155, but the pair quickly rebounded and returned near intervention-sensitive levels above 160.

Possible market effect:

This is a high-risk setup for FX markets. USD/JPY remains technically supported above 160, but the move toward 162.04 increases intervention risk. A direct intervention could trigger a sharp short-term drop in USD/JPY, while no action from Tokyo may allow the pair to remain elevated unless U.S. yields fall or the Bank of Japan turns more clearly hawkish.

Market sentiment:

USD/JPY: Neutral to slightly buyable, but high intervention risk

JPY: Weak, but intervention-sensitive

USD: Neutral to slightly buyable against JPY

Japanese equities: Mixed; weak yen supports exporters, but intervention risk may increase volatility

Q: Why did USD/JPY rise on Monday, July 6?

A: USD/JPY rose because the yen remained under pressure despite softer U.S. labor data, while markets still saw a wide gap between U.S. and Japanese interest rates.

Q: Why is the 160 level important for USD/JPY?

A: The 160 level is important because it has previously attracted Japanese government intervention, making traders cautious when USD/JPY trades well above it.

Q: Is USD/JPY currently buyable or sellable?

A: USD/JPY is neutral to slightly buyable while it holds above 160, but buying near 162.04 carries high intervention risk.

Source: ING; FX market data

More Forex news

UK

UK New Car Registrations Jump in June as Vehicle Demand Improves

Importance level: Low

The United Kingdom’s New Passenger Car Registrations rose to 213,166 in June, up sharply from the previous reading of 160,662.

The increase points to stronger vehicle registration activity and suggests improved demand in the UK auto market. However, because this indicator has low market importance, its direct impact on sterling or broader UK assets may remain limited.

Possible market effect:

The data is mildly positive for UK auto-related sentiment and consumer-demand indicators. It may support auto retailers, vehicle finance, and related cyclical sectors, but the direct effect on GBP should be limited.

Market sentiment:

GBP: Neutral

UK auto-related stocks: Neutral to slightly positive

Q: What was the UK New Passenger Cars Registration figure in June?

A: UK New Passenger Cars Registration rose to 213,166 in June, compared with the previous 160,662.

Q: Is the UK car registration data positive for the UK economy?

A: It is mildly positive because it shows stronger vehicle demand, but the market impact is limited due to low importance.

Source: UK vehicle registration data

UK Construction PMI Misses Forecast in June as Sector Stays Deep in Contraction

Importance level: Low

The United Kingdom’s S&P Global Construction PMI came in at 38.4 in June, below market expectations of 40.1, but slightly above the previous reading of 38.2.

The data shows that the UK construction sector remained under heavy pressure. A PMI reading below 50.0 signals contraction, and the latest figure remains far below that threshold. However, the small rise from the previous month suggests the pace of deterioration eased only marginally.

Possible market effect:

This is negative for UK construction, housing, and real estate sentiment. The weaker-than-expected reading may also weigh slightly on GBP, although the direct FX impact should remain limited unless broader UK data confirms deeper weakness.

Market sentiment:

GBP: Neutral to slightly sell

UK construction stocks: Slightly negative

UK housing-linked assets: Slightly negative

Q: What was the UK Construction PMI in June?

A: The UK S&P Global Construction PMI was 38.4, below expectations of 40.1, but slightly above the previous 38.2.

Q: Is the UK construction sector expanding or contracting?

A: It is contracting, because the PMI remains well below 50.0.

Source: S&P Global

UK Car Registrations Accelerate in June as Annual Growth Reaches 11.4%

Importance level: Low

The United Kingdom’s car registrations YoY rose 11.4% in June, accelerating from the previous 7.1% increase.

The stronger reading suggests vehicle demand improved in the UK auto market, which may point to better consumer activity and stronger momentum for auto retailers and related services.

Possible market effect:

This is mildly positive for UK auto-related stocks and consumer sentiment. The direct impact on GBP is likely limited because the data has low market importance.

Market sentiment:

GBP: Neutral

UK auto-related stocks: Neutral to slightly positive

UK consumer sector: Slightly positive

Q: What was UK car registration growth in June?

A: UK car registrations rose 11.4% YoY in June, up from the previous 7.1%.

Q: Is the UK car registration data positive for markets?

A: It is mildly positive for auto-related stocks and consumer sentiment, but its impact on GBP is limited.

Source: UK vehicle registration data

UK Media Deal: Sky to Buy ITV Media & Entertainment Unit for £1.6 Billion

Importance level: High

Sky has agreed to acquire the Media & Entertainment division of ITV PLC (LON: ITV) in a deal valued at £1.6 billion / $2.2 billion, creating one of the UK’s largest commercial broadcasting and streaming businesses.

Under the agreement, Sky will pay £1.2 billion in cash at completion, with an additional £200 million linked to agreed advertising revenue targets in 2027. As part of the transaction, ITV will acquire Love Productions from Sky for £200 million, bringing the producer of The Great British Bake Off into ITV Studios.

The deal includes ITV’s free-to-air television channels and the ITVX streaming platform, while ITV Studios will remain a standalone listed production business. Sky also committed to spending at least £2.1 billion on ITV Studios programming between 2028 and 2032, supporting long-term content investment after the separation.

ITV said the transaction is expected to generate around £1.05 billion in net cash proceeds after costs. The company plans to use part of the proceeds to reduce leverage at ITV Studios before returning around £950 million, or about 25 pence per share, to shareholders.

Morgan Stanley said the deal transforms ITV into a pure-play, London-listed content producer, supported by the long-term programming agreement with Sky and the addition of Love Productions. ITV shares were little changed in London trading after the announcement, compared with a 0.3% gain in the broader FTSE 100.

The transaction remains subject to shareholder, regulatory and competition approvals and is expected to complete in 2027.

Possible market effect:

The deal is structurally positive for ITV because it simplifies the business, improves cash visibility, reduces leverage, and creates a clear shareholder-return path. However, the limited share-price reaction suggests investors are still pricing in approval risk, execution risk, and the long timeline to completion.

Market sentiment:

ITV: Neutral to slightly buyable, with deal-risk caution

UK media sector: Slightly positive

FTSE 100: Neutral

GBP: Neutral

Q: What is Sky buying from ITV?

A: Sky is buying ITV’s Media & Entertainment division, including free-to-air channels and the ITVX streaming platform.

Q: How much is the Sky-ITV transaction worth?

A: The transaction is valued at £1.6 billion / $2.2 billion.

Q: How much does ITV plan to return to shareholders?

A: ITV plans to return around £950 million, or about 25 pence per share, to shareholders.

Q: Is ITV stock buyable after the Sky deal?

A: ITV is neutral to slightly buyable from a restructuring and shareholder-return perspective, but investors should watch regulatory approval and completion risk.

Source: Sky; ITV; Morgan Stanley

More UK news

Day Trade Signals

WTI: Sell on confirmed weakness

  • Entry: 68.18
  • Stop Loss: 68.78
  • Take Profit 1: 67.80
  • Take Profit 2: 67.40

WTI on the H1 chart is trading around 68.41 and sitting directly on a key intraday pivot. The recent structure is no longer in a clean rebound phase. Price recovered from the 67.30–67.40 low zone, but repeated failures near 68.60–68.65 show that buyers are losing momentum. The short-term moving average is flattening around price, OBV is not confirming aggressive accumulation, and RSI(14) near 48.26 keeps the chart in a neutral-to-soft zone rather than a strong bullish one.

Technically, the market is now caught between a fragile support band and capped upside. The first support sits at 68.20, followed by 67.80, while the deeper bearish extension comes in at 67.35–67.40. On the upside, the first resistance remains 68.60–68.65, followed by 69.00–69.05. As long as WTI stays below 68.65, the chart favors a mild bearish bias, with rallies looking corrective rather than trend changing.

Scenario Violation:

If price closes above 68.78, the bearish trade should be fully exited because the scenario is violated.

If price breaks above 69.05, the bearish view should be considered fully invalidated, and the market shifts to a bullish recovery structure.

Brent Oil (H1): Sell on weak rebound

Entry: 71.60–71.70

Stop Loss: 72.22

Take Profit 1: 71.15

Take Profit 2: 70.65

Market Condition: Neutral to Mildly Bearish

The Brent Oil H1 chart shows a market that has stabilized after the late-June selloff, but the recovery still lacks strong confirmation. Price is trading around 71.66–71.96, while the structure remains capped under the overhead cloud resistance zone near 71.95–72.20. The recent candles are compressing rather than extending higher, which suggests hesitation rather than a clean bullish continuation.

Technically, the chart still carries a soft bearish bias because price is trading inside or just under the lower edge of the cloud, while the latest push higher has started to flatten. The first support comes in around 71.66, followed by 71.15, and then the deeper support zone near 70.65. On the upside, the first resistance stands at 71.95–72.00, followed by 72.20, with a stronger recovery barrier around 72.70. As long as Brent remains below 72.00–72.20, rebounds still look corrective rather than trend-changing.

Momentum is mixed. The MACD histogram remains slightly positive, but the bars are shrinking, and the MACD lines are beginning to roll over, which signals that upside momentum is fading. In practical terms, this is a market trying to hold a base, but not yet showing enough strength to confirm a sustained upside breakout.

Scenario Violation

If price closes above 72.22, the bearish trade should be fully exited because the scenario is violated.

If price breaks above 72.70, the bearish idea should be considered fully invalidated, and the chart would shift into a stronger bullish recovery structure.

BTC USD Trading Signal (H1): Sell on weak rebound / corrective short

Entry: 63,150–63,250

Stop Loss: 63,480

Take Profit 1: 63,033

Take Profit 2: 62,700

Market Condition: Neutral to Mildly Bearish in the short term, constructive in the broader H1 structure

The BTC/USD H1 chart shows a market that is still technically stronger than it was at the start of July, but the latest candles point to a corrective pullback rather than a fresh impulsive breakout. Price is trading around 63,180, after failing to hold the spike toward the 64,000–64,045 area. The chart still reflects a strong recovery from the July 1 low zone near 58,000, but the immediate move has lost momentum under overhead resistance.

From a price-action perspective, the first support now sits around 63,033, followed by 62,696. A deeper pullback could expose 61,685 next. On the upside, the first resistance is the marked pivot near 63,184, followed by 63,370, with the more important breakout barrier still near 64,045. As long as price stays below 63,370–64,045, the latest recovery looks paused and vulnerable to another short-term downside test.

Momentum is not aggressively bearish, but it has clearly cooled. The CCI(14) is near 12.20, which places momentum in mildly positive but near-neutral territory rather than in a strong trend zone. In practical terms, the H1 chart is not broken structurally, but it is currently in a corrective phase after rejection from the recent high.

Scenario Violation

If price closes above 63,480, the bearish trade should be fully exited because the scenario is violated.

If price breaks above 64,045, the bearish view should be considered fully invalidated, and the chart shifts into a stronger bullish continuation structure.

More Day Trade Signals news

Cryptocurrency

Bitcoin Climbs Above $63,000 on Monday as Fed Rate-Hike Bets Ease

Importance level: Medium

Bitcoin climbed above $63,000 in Asian trading on Monday, extending last week’s rally as softer-than-expected U.S. economic data reduced expectations for a near-term Federal Reserve interest-rate hike. Renewed inflows into spot Bitcoin ETFs also improved investor sentiment.

The world’s largest cryptocurrency last traded 0.8% higher at $63,227.5 by 01:18 ET / 05:18 GMT, after reaching a two-week high near $64,000 in the previous session.

Bitcoin gained roughly 5% last week, rebounding from a 21-month low below $58,000 touched earlier in the week.

Possible market effect:

The move is mildly positive for crypto sentiment, especially if softer U.S. data continues to reduce rate-hike expectations. However, Bitcoin may face resistance near the $64,000 area if the U.S. dollar or Treasury yields recover.

Market sentiment:

Bitcoin: Neutral to buyable above $63,000

Crypto market: Slightly positive

USD impact: Slightly negative if Fed rate-hike bets continue to fade

Q: Why did Bitcoin rise above $63,000 on Monday?

A: Bitcoin rose as softer U.S. economic data reduced expectations for a near-term Fed rate hike, while renewed spot ETF inflows supported sentiment.

Q: What was the latest Bitcoin price?

A: Bitcoin traded 0.8% higher at $63,227.5 by 01:18 ET / 05:18 GMT.

Q: Is Bitcoin currently buyable or sellable?

A: Bitcoin is neutral to buyable while it holds above $63,000, but traders should watch resistance near $64,000 and Fed-related signals.

Source: Market data

Altcoins Extend Gains on Monday as Ethereum, XRP and Dogecoin Move Higher

Importance level: Medium

Most altcoins edged higher on Monday, extending their rebound from last week as broader crypto sentiment improved.

Ethereum gained 0.7% to $1,775.92, while XRP rose 0.6% to $1.14. Solana and Cardano traded largely flat in early trading, showing more limited momentum compared with other major altcoins.

Among meme tokens, Dogecoin rose 1.4%, outperforming several large-cap altcoins in early trade.

Possible market effect:

The altcoin rebound suggests improving risk appetite across crypto assets. However, the move remains selective: Ethereum, XRP and Dogecoin are showing positive momentum, while Solana and Cardano are still mostly neutral. Bitcoin’s ability to hold above $63,000 remains important for broader altcoin direction.

Market sentiment:

Ethereum: Neutral to slightly buyable

XRP: Neutral to slightly buyable

Dogecoin: Slightly buyable, but speculative

Solana: Neutral

Cardano: Neutral

Q: Which major altcoins gained on Monday?

A: Ethereum rose 0.7% to $1,775.92, while XRP gained 0.6% to $1.14.

Q: How did Dogecoin perform compared with other altcoins?

A: Dogecoin rose 1.4%, outperforming Ethereum and XRP in early trading.

Q: Is the altcoin market currently buyable?

A: The altcoin market is selectively buyable, with stronger momentum in Ethereum, XRP and Dogecoin, while Solana and Cardano remain neutral.

Source: Market data

Bitcoin Rebounds on Monday as Fed Hike Fears Ease and ETF Inflows Return

Importance level: Medium

Bitcoin extended its recovery on Monday as weaker-than-expected U.S. June payrolls data reinforced expectations that the Federal Reserve is unlikely to raise interest rates this year.

Market sentiment also improved after Federal Reserve Chair Kevin Warsh said inflation had continued to moderate and confirmed that policymakers would remain data-dependent. His comments pushed markets to further reduce expectations for additional monetary tightening.

Investor confidence was also supported by a return to net inflows into U.S. spot Bitcoin ETFs after several weeks of outflows, signaling that institutional demand may be stabilizing.

The rebound follows sharp Bitcoin losses in June, when tighter financial conditions and profit-taking after a strong rally earlier this year pressured the cryptocurrency. Analysts warned that trading volumes remain relatively subdued, meaning Bitcoin may need continued ETF inflows and supportive macroeconomic data to sustain its recovery.

This week, traders will focus on the minutes of the Federal Reserve’s June policy meeting for more clues on the U.S. interest-rate outlook. Technically, the key question is whether Bitcoin can hold above the $63,000–$64,000 range to extend its rebound.

Possible market effect:

The news is positive for Bitcoin and broader crypto sentiment, mainly because lower rate-hike expectations reduce pressure on risk assets. However, the recovery still depends on continued ETF inflows, stable macro data, and Bitcoin holding above the $63,000–$64,000 zone.

Market sentiment:

Bitcoin: Neutral to buyable above $63,000–$64,000

Crypto market: Mildly positive

USD: Neutral to slightly negative if Fed hike expectations keep falling

Risk assets: Slightly positive

Q: Why did Bitcoin rebound on Monday?

A: Bitcoin rebounded because weaker U.S. June payrolls data reduced expectations for a Fed rate hike, while renewed inflows into U.S. spot Bitcoin ETFs improved investor confidence.

Q: Why are U.S. spot Bitcoin ETF inflows important for Bitcoin?

A: ETF inflows are important because they suggest institutional demand is stabilizing, which can support Bitcoin’s price recovery.

Q: Is Bitcoin currently buyable or sellable?

A: Bitcoin is neutral to buyable if it can hold above the $63,000–$64,000 range. A break below that area could weaken the recovery signal.

Source: Federal Reserve remarks; U.S. spot Bitcoin ETF flow data; market data

More Cryptocurrency news

Japan

Japan Household Spending Beat Forecasts in May as Monthly Consumption Jumped 3.7%

Importance level: Medium

Japan’s household spending improved in May, with Household Spending YoY falling only 0.4%, much better than the expected 2.3% decline and slightly better than the previous 0.5% drop.

On a monthly basis, Household Spending MoM jumped 3.7%, beating the forecast of 1.4% and the previous 1.6% increase. The data suggests consumer activity in Japan was stronger than expected, especially on a short-term monthly basis.

Possible market effect:

This data is mildly positive for Japan’s domestic-demand outlook and consumer-related stocks. For the Japanese yen, the effect is slightly supportive because stronger consumption can strengthen the case for a more confident Bank of Japan policy stance.

Market sentiment:

JPY: Neutral to slightly buyable

Japanese consumer stocks: Slightly positive

Nikkei 225: Neutral to slightly positive

Q: Was Japan’s household spending data positive in May?

A: Yes. Household spending beat forecasts, with monthly spending rising 3.7% and annual spending falling only 0.4%.

Q: Is Japan’s household spending data positive for the yen?

A: It is mildly positive for the yen, but the impact may be limited unless other data also confirm stronger domestic demand.

Source: Statistics Bureau of Japan

Japan Wage Growth Slows in May as Overall Pay and Overtime Income Weaken

Importance level: Low

Japan’s wage data softened in May. Overall wage income of employees rose 3.2% YoY, below the forecast of 3.4% and weaker than the previous 3.6%.

Overtime pay YoY also slowed to 2.90%, down from the previous 4.80%. The weaker wage trend suggests that income momentum softened, which may reduce confidence in a sustained consumption recovery despite stronger household spending data.

Possible market effect:

This data is mildly negative for the Japanese yen because softer wage growth may make the Bank of Japan more cautious about tightening policy. It is also slightly negative for domestic-demand sentiment if weaker pay growth continues.

Market sentiment:

JPY: Neutral to slightly sell

Japanese consumer stocks: Neutral

Bank of Japan policy outlook: Slightly less hawkish

Q: Did Japan’s wage growth improve in May?

A: No. Overall wage income slowed to 3.2% YoY, below the forecast of 3.4% and the previous 3.6%.

Q: Why does Japan’s wage data matter for the Bank of Japan?

A: Wage growth matters because stronger wages can support inflation and consumption, while weaker wage momentum may make the Bank of Japan more cautious.

Source: Japan Ministry of Health, Labour and Welfare

Japan Foreign Reserves Fall in June to $1,287.5 Billion

Importance level: Low

Japan’s foreign reserves declined to $1,287.5 billion in June, down from the previous $1,305.9 billion.

The decline shows a reduction in Japan’s reserve holdings, but the level remains very large. Markets may watch this figure alongside yen volatility and possible currency-market intervention risks.

Possible market effect:

The direct impact is limited, but the decline may draw attention because the yen remains under pressure and intervention risk is elevated. Still, Japan’s reserve position remains strong.

Market sentiment:

JPY: Neutral

USD/JPY: Intervention-sensitive

Japanese bonds: Neutral

Q: What were Japan’s foreign reserves in June?

A: Japan’s foreign reserves fell to $1,287.5 billion, down from $1,305.9 billion.

Q: Is the decline in Japan’s foreign reserves a major concern?

A: Not immediately. The level remains very large, but markets may watch it closely because of yen weakness and intervention risk.

Source: Japan Ministry of Finance

More Japan news

Canada

Canada Reserve Assets Slip in June to $126.4 Billion

Importance level: Low

Canada’s Reserve Assets Total fell to $126.4 billion in June, down from the previous $126.9 billion.

The decline was small and suggests only a modest reduction in Canada’s reserve holdings. Because the change was limited and the indicator has low market importance, the direct impact on Canadian assets is likely minimal.

Possible market effect:

The data is slightly negative for the Canadian dollar, but the effect should be limited. CAD direction is more likely to depend on oil prices, Bank of Canada expectations, and U.S. dollar movement.

Market sentiment:

CAD: Neutral

Canadian equities: Neutral

Q: What were Canada’s reserve assets in June?

A: Canada’s reserve assets fell to $126.4 billion, compared with $126.9 billion previously.

Q: Is the decline in Canada’s reserve assets important for CAD?

A: Not strongly. The decline is small, so the direct impact on CAD is likely limited.

Source: Department of Finance Canada

More Canada news