
 English
 پارسی



Oil Trading Guide: Brent, WTI, Fundamental Reports, Price Action and Risk Management
Brent vs WTI: Two Benchmarks, Two Market Stories
Brent and WTI are both quoted in U.S. dollars per barrel, but they do not price the same risks.
- Brent crude oil
Brent originated as a North Sea benchmark and is widely used to price seaborne crude oil around the world. It is particularly sensitive to global shipping conditions, European and Asian demand, OPEC+ policy and geopolitical disruptions affecting internationally traded barrels.
- WTI crude oil
WTI is the benchmark for light, sweet U.S. crude oil. Its main futures contract is connected to physical delivery at Cushing, Oklahoma. WTI is therefore especially sensitive to U.S. production, Cushing inventories, refinery utilization, imports, exports and pipeline capacity.
- The Brent-WTI spread
The difference between Brent and WTI prices is more than a comparison between two contracts. It can reveal changes in U.S. export competitiveness, domestic logistics, the Atlantic Basin balance and regional supply stress. Traders may monitor the spread as an independent relative-value signal instead of relying only on the outright direction of oil prices.
The standard NYMEX/CME WTI futures contract, commonly identified by the symbol CL, represents 1,000 barrels. A movement of $0.01 per barrel equals $10 per contract. The ICE Brent futures contract also represents 1,000 barrels, although its delivery and settlement mechanism differs from WTI. Traders using CFDs or other broker products must check their broker's contract size and tick value because the specifications may not match exchange-traded futures.
How the Oil Market Is Structured
Oil prices emerge from a chain that connects physical barrels to financial markets:
- Upstream: exploration, drilling and production.
- Midstream: pipelines, storage and transportation.
- Downstream: refining, petroleum products and refinery margins.
- Financial market: futures, options, exchange-traded funds and CFDs.
The price of a barrel is not determined by “global demand” alone. Crude quality, sulfur content, location, delivery date, storage capacity and transportation constraints all matter. A shortage in one location can coexist with a surplus elsewhere, causing Brent and WTI—or different contract months—to diverge.
This is why oil traders should identify the market's dominant transmission channel. Is price responding to physical supply, demand, inventories, refining activity, macro conditions, geopolitical risk, or speculative positioning? Each driver has a different time horizon and may affect Brent, WTI or refined products differently.
Essential Oil-Market Terms
- Barrel (bbl)
The standard unit used to measure crude oil volume. Futures prices are normally quoted in U.S. dollars per barrel.
- API gravity
API gravity measures how heavy or light crude oil is relative to water. A higher API gravity generally indicates lighter crude.
- Sweet vs sour crude
Sweet crude has relatively low sulfur content, while sour crude contains more sulfur. Quality affects refining requirements, costs, and the price differential between crude grades.
- Crack spread
The crack spread is a simplified measure of refinery margins: the value of refined products relative to the cost of crude oil feedstock. Strong product margins may encourage higher refinery runs and support crude demand.
- Backwardation
Backwardation exists when nearby contracts trade above later maturities. It often signals tight prompt supply and rewards holders of immediately available physical oil.
- Contango
Contango exists when later-dated contracts trade above nearby contracts. It often reflects plentiful prompt supply and may create an incentive to store oil when the spread covers financing and storage costs.
- Cushing
Cushing, Oklahoma, is the principal delivery and storage hub for the WTI futures contract. Its inventory and pipeline conditions can materially influence WTI pricing.
- Inventory draw and build
A draw is a decline in inventories; a build is an increase. The surprise relative to market expectations usually matters more than the absolute number.
What Moves Brent and WTI Prices?
1. Supply
Oil supply responds to OPEC+ production policy, U.S. shale activity, planned maintenance, unplanned outages, sanctions and operational disruptions. A cut is not automatically bullish: traders must consider compliance, spare capacity, existing expectations and whether other producers can replace the lost barrels.
2. Demand
Demand is closely linked to transportation, industrial activity and economic growth. The United States and China are especially important, but regional consumption patterns, aviation activity and seasonal fuel demand also matter.
3. Inventories
Inventories connect current supply and demand. Falling stocks can indicate tightening, while persistent builds may indicate surplus. Traders should examine crude oil, gasoline and distillates together rather than focusing on crude alone.
4. Refining
Refinery utilization, maintenance and profit margins influence how much crude refiners want to process. A crude draw caused by strong refinery intake has a different meaning from a draw caused mainly by lower imports.
5. Macroeconomic conditions
Oil is priced in U.S. dollars. A stronger dollar can pressure commodities by making them more expensive for non-dollar buyers, although a severe supply shock can overwhelm this relationship. Interest rates, bond yields and recession risks affect financial conditions and expectations for future demand.
6. Geopolitics
Wars, sanctions, port closures, threatened shipping lanes and higher maritime insurance costs can add a risk premium. However, geopolitical headlines often reverse when no physical barrels are lost. A trader should identify exactly which production, export, refining capacity or shipping route is threatened, then look for confirmation in prompt prices and spreads.
7. Positioning and sentiment
Futures positioning can accelerate or weaken a move. A market with crowded speculative longs may fall sharply on disappointing news, while heavy short positioning can amplify a rally through short covering.
The Most Important Oil Reports
EIA Short-Term Energy Outlook (STEO)
The U.S. Energy Information Administration's STEO contains forecasts for oil prices, U.S. production, consumption, inventories and the broader energy system. It is useful for evaluating the official U.S. supply outlook, price assumptions and expected changes in energy balances.
IEA Oil Market Report (OMR)
The International Energy Agency's monthly OMR analyzes global demand, supply, stocks, refining, prices and trade. It is particularly valuable for comparing OECD and non-OECD demand and understanding the global balance.
OPEC Monthly Oil Market Report (MOMR)
OPEC's MOMR presents its view of the world economy, global oil demand, non-OPEC supply, OPEC crude production and inventory changes. Traders use it to understand the producer-side narrative and the context surrounding OPEC+ policy.
Weekly API and EIA inventory reports
The American Petroleum Institute normally publishes a private-sector estimate of U.S. inventories before the EIA releases its more detailed official Weekly Petroleum Status Report. The EIA report includes crude oil, gasoline, distillates, refinery utilization, production, imports and exports.
The trading formula is simple but important: the difference between the reported figure and market expectations generally matters more than the absolute figure.
CFTC Commitments of Traders report
The weekly COT report shows how commercial and non-commercial groups are positioned in futures markets. It can help traders evaluate large speculative flows, market crowding, and potential changes in sentiment. It is better used as context than as a stand-alone timing signal because the data are released with a lag.
Baker Hughes rig count
The weekly rig count is a forward-looking indicator of U.S. drilling activity and the potential response of shale supply. It should not be treated as an immediate production number because productivity, completion rates, and capital discipline also matter.
How to Turn Monthly Reports into a Price View
Do not trade a monthly report simply because it contains a large number. Use a three-step process.
- First, identify the direction and size of revisions. A report is relatively bullish when demand is revised higher, supply lower, or expected inventories downward compared with the previous edition and market consensus. The opposite mix is relatively bearish.
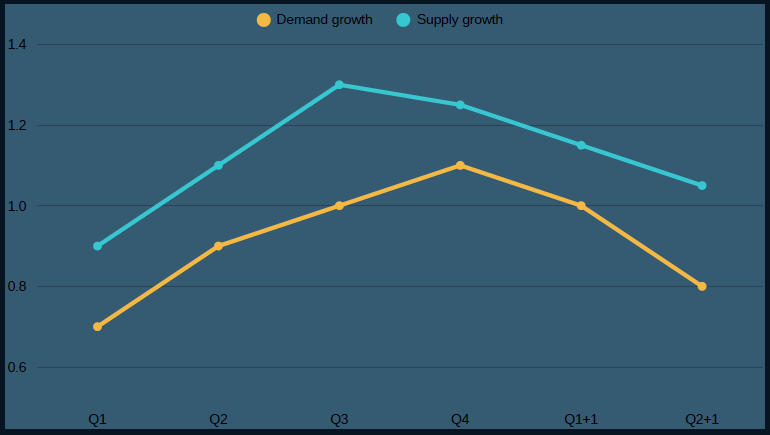
- Second, calculate the implied balance. When supply growth exceeds demand growth, the result normally points toward inventory accumulation and weaker prompt pricing. When demand outpaces supply, the balance suggests tightening.
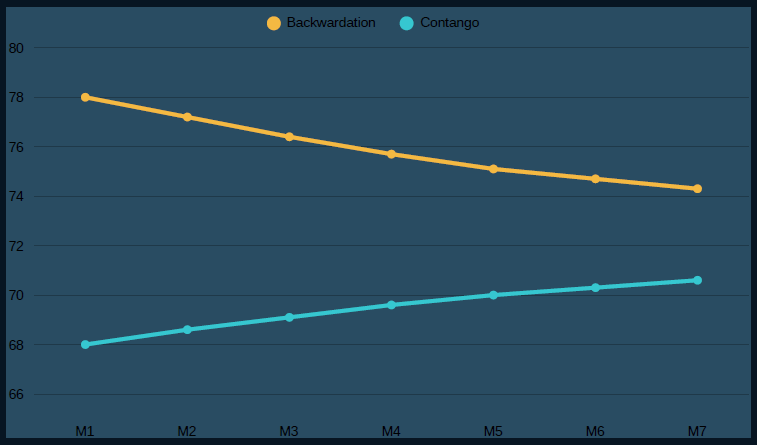
- Third, check the futures curve. Widening backwardation can confirm prompt scarcity, while deeper contango can confirm surplus. If the report's narrative and the curve disagree, the market may already have priced the information or may doubt the forecast.
How to Interpret Weekly API and EIA Inventory Data
Crude inventories should never be interpreted in isolation. The four basic combinations are:
1. Crude draw plus product draws: potentially a strong bullish combination when demand and healthy refinery activity confirm the move.
2. Crude draw plus product builds: mixed. The crude decline may reflect refinery intake or lower imports, while product accumulation can signal weak end-user demand.
3. Crude build plus product draws: mixed. Crude supply may be loose, but falling product stocks can show resilient final demand.
4. Crude build plus product builds: potentially bearish when increases exceed expectations and refinery utilization remains weak.
Also check Cushing inventories, U.S. production, refinery utilization, net imports, exports, and seasonal distortions. The first market reaction can reverse once traders read the full report.
Understanding the Futures Curve and Calendar Spreads
The futures curve converts the physical balance into tradable prices across time. Backwardation usually points to near-term tightness, while contango often signals surplus and available storage. However, the curve is not a perfect forecast of future spot prices; it also reflects financing, storage, convenience yield, and hedging pressure.
Calendar spreads compare two delivery months. They can express a view on tightening or loosening balances with less exposure to the outright direction of oil than a simple long or short position. Nevertheless, spreads carry their own liquidity, rollover, and event risks.
A Five-Step Technical Framework for Oil Trading
Fundamentals explain why the market may move; technical analysis helps define where the trade becomes actionable and where the idea is wrong.
- Step 1: Define the market context
Start with the daily and four-hour trend, the volatility regime, and the calendar of major events. Determine whether the market is trending, ranging, or reacting to a fresh shock.
- Step 2: Map market structure
Identify higher highs and higher lows in an uptrend, lower highs and lower lows in a downtrend, or clear range boundaries when direction is absent.
- Step 3: Mark decision zones
Useful areas include prior swing highs and lows, range boundaries, gaps, weekly opens, session highs and lows, VWAP or relevant moving averages, and the high and low of the candle formed during an important report.
- Step 4: Wait for a trigger
A level alone is not an entry. Look for acceptance after a breakout, a successful retest, a rejection candle, or a failed breakout. Waiting for confirmation can reduce the risk of chasing the first volatile candle after news.
- Step 5: Manage the scenario
Place the stop beyond the price level that invalidates the idea. Define the first and subsequent targets before entry, and avoid moving the stop farther away merely to keep a losing trade open.
Three Practical Oil-Trading Setups
1. Breakout and retest
Use this momentum setup when a verified fundamental catalyst pushes price beyond important support or resistance. Enter only after price accepts the breakout and the retest holds. The stop normally belongs beyond the retest swing.
2. Trend pullback
Use this continuation setup when fundamental data or the futures curve supports the prevailing direction and price retraces toward a decision zone. A rejection candle can provide the trigger, with invalidation beyond the pullback swing.
3. Failed breakout and return to range
Use this mean-reversion setup after headline risk fades and price fails to hold outside a well-defined range. Entry follows the return into the range, while invalidation belongs beyond the false-break extreme.
Every valid setup needs three elements: a catalyst or market rationale, a technical trigger and a precise invalidation point.
Risk Management: The Oil Trader's Survival Advantage
Oil is volatile, and slippage may increase around inventory reports, OPEC announcements, central-bank decisions and geopolitical headlines. Position sizing and event discipline are therefore more important than forecasting precision.
Decide the maximum account risk before entering. For a futures position:
Number of contracts = Account risk / (Stop distance in ticks × Tick value)
For products quoted by a broker in lots:
Position size = Account risk / (Stop distance in pips or points × Value per pip or point)
For example, if the risk budget is $500, the WTI stop is 50 ticks, and each tick is worth $10, the maximum size is one standard CL contract. A micro contract may allow more precise sizing. Always verify the current contract specifications and include expected slippage and commissions.
The stop should sit beyond structural invalidation—not at an arbitrary distance chosen only to achieve a preferred position size. If the correct stop is too wide, reduce size or skip the trade.
Pre-Trade Oil Checklist
Before opening a position, answer these questions:
What is moving the market: supply, demand, inventories, refining, macro conditions, geopolitics or positioning?
- Is the idea expressed more clearly in Brent, WTI, a calendar spread, or a refined product?
- Does the higher timeframe support the intraday trigger?
- Where are the entry, invalidation, first target, and second target?
- Is an API, EIA, OPEC, FOMC, or other major event near?
- If the stop is triggered, what is the total monetary loss after expected slippage and fees?
- Does the futures curve confirm or contradict the trade narrative?
If the checklist does not produce a clear scenario, not trading may be the best decision.
Conclusion
Successful oil trading is a process of alignment. The strongest opportunities often appear when the physical balance, report revisions, futures curve, macro environment, and price action tell a consistent story. Even then, no scenario is certain.
The practical sequence is to identify the dominant driver, choose the correct benchmark, compare data with expectations, seek confirmation from the curve and price structure, wait for a defined trigger, and size the position according to the invalidation level. That framework turns a complex global market into a repeatable decision process.
Frequently Asked Questions
What is the main difference between Brent and WTI?
Brent is a global seaborne benchmark with strong sensitivity to international supply, shipping and geopolitical risks. WTI is a U.S. light, sweet crude benchmark linked to delivery at Cushing and is more sensitive to U.S. inventories, production, refining and pipelines.
Which report is most important for short-term oil traders?
The EIA Weekly Petroleum Status Report is among the most closely watched short-term releases because it provides detailed official data on crude oil, products, refining, production and trade. The surprise relative to expectations matters more than the headline number alone.
Is an inventory draw always bullish for oil?
No. A crude draw can accompany large product builds, weak final demand, or unusual import and export flows. Traders should review the entire report and compare every key figure with expectations.
What do contango and backwardation indicate?
Backwardation often signals tight near-term supply, while contango often indicates plentiful prompt supply and an incentive to store oil. Both structures can also reflect financing, storage, and hedging conditions.
Can the COT report predict oil prices?
The COT report can reveal crowding and changes in speculative positioning, but it is delayed and should not be used alone as a precise entry signal.
How should traders handle geopolitical oil headlines?
Identify the physical barrels, infrastructure or shipping routes genuinely at risk. Then seek confirmation from prompt prices, calendar spreads and price acceptance before entering a trade.
What is a suitable risk per oil trade?
There is no universal percentage. The amount must reflect account size, volatility, strategy and loss tolerance. The key is to determine risk before entry, use structural invalidation and keep risk small enough to survive a sequence of losses.
Are the example price levels in this article live signals?
No. Any examples are educational illustrations of setup structure. Current prices, volatility, contract specifications, and market conditions must be checked before any real decision.
----------------------------------------------------------------------------------
Risk disclaimer: This article is for educational purposes only and does not constitute financial or investment advice or an offer to buy or sell any financial instrument. Oil futures and leveraged products carry substantial risk.
 Oil Trading Guide: Brent, WTI, Reports, Strategies and Risk Management